CONTENTS
6. Summary of Monitoring Exceedance, Complaints, Notification of Summons and Prosecutions 34
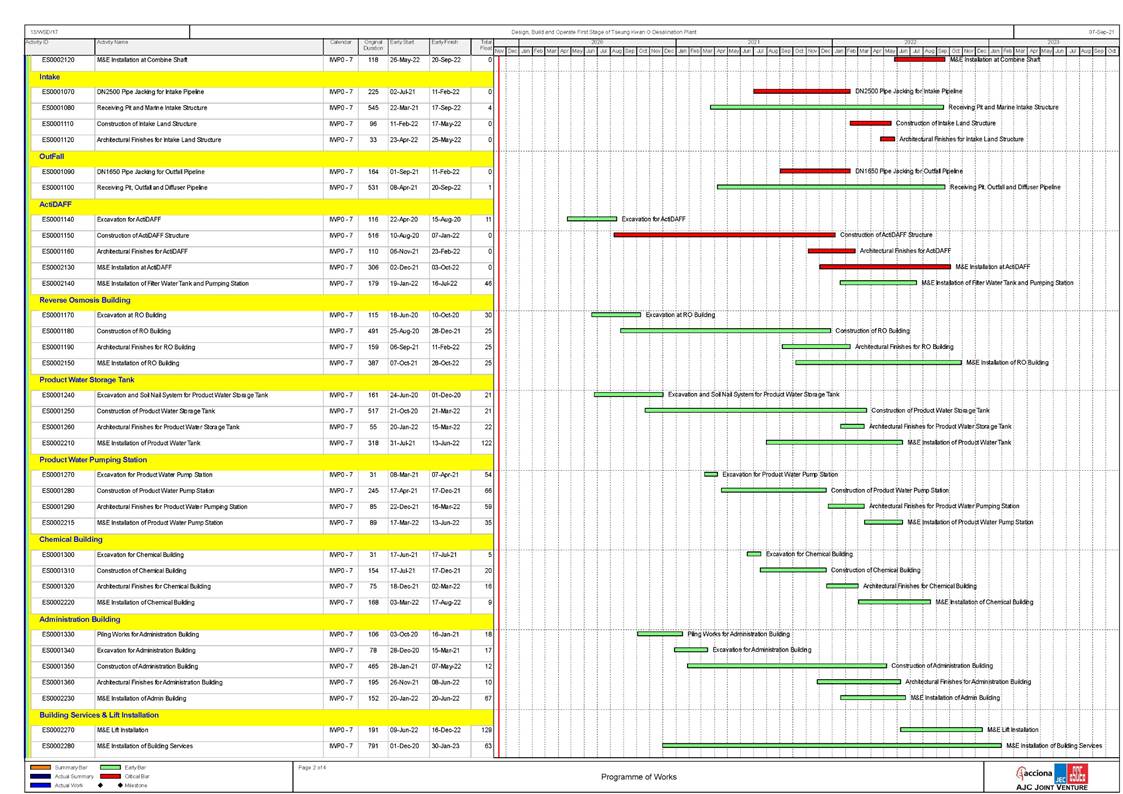
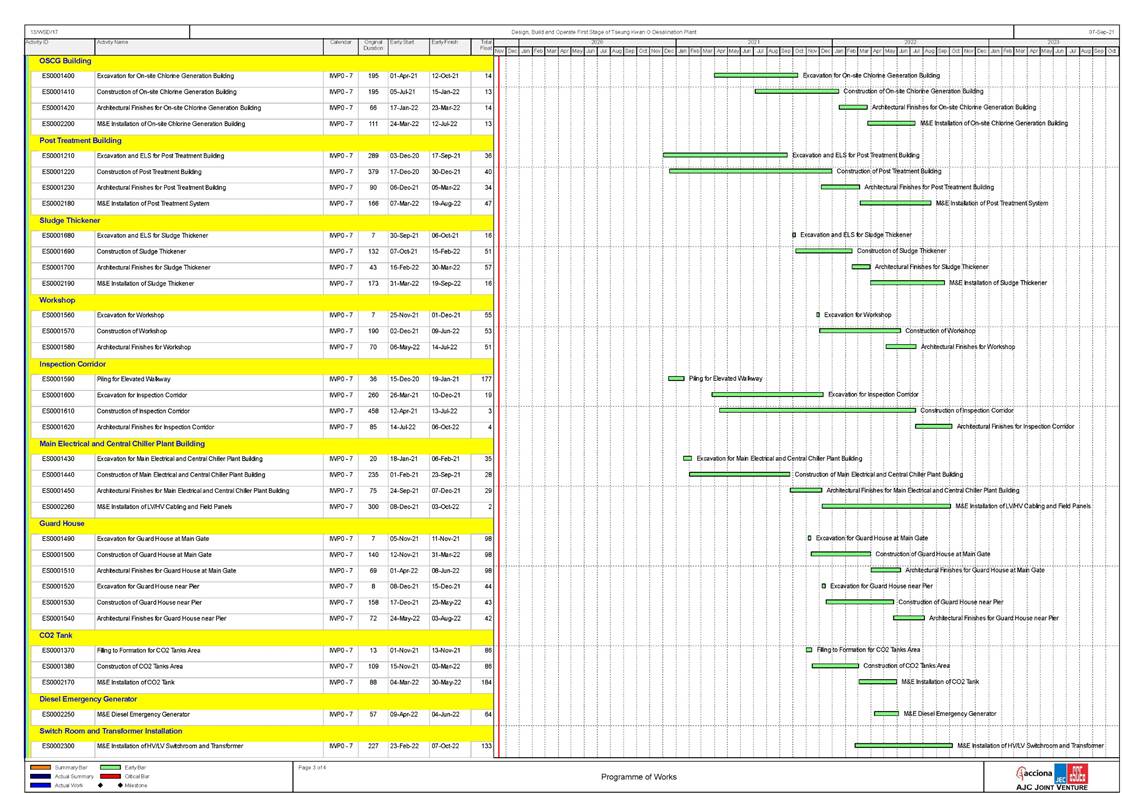
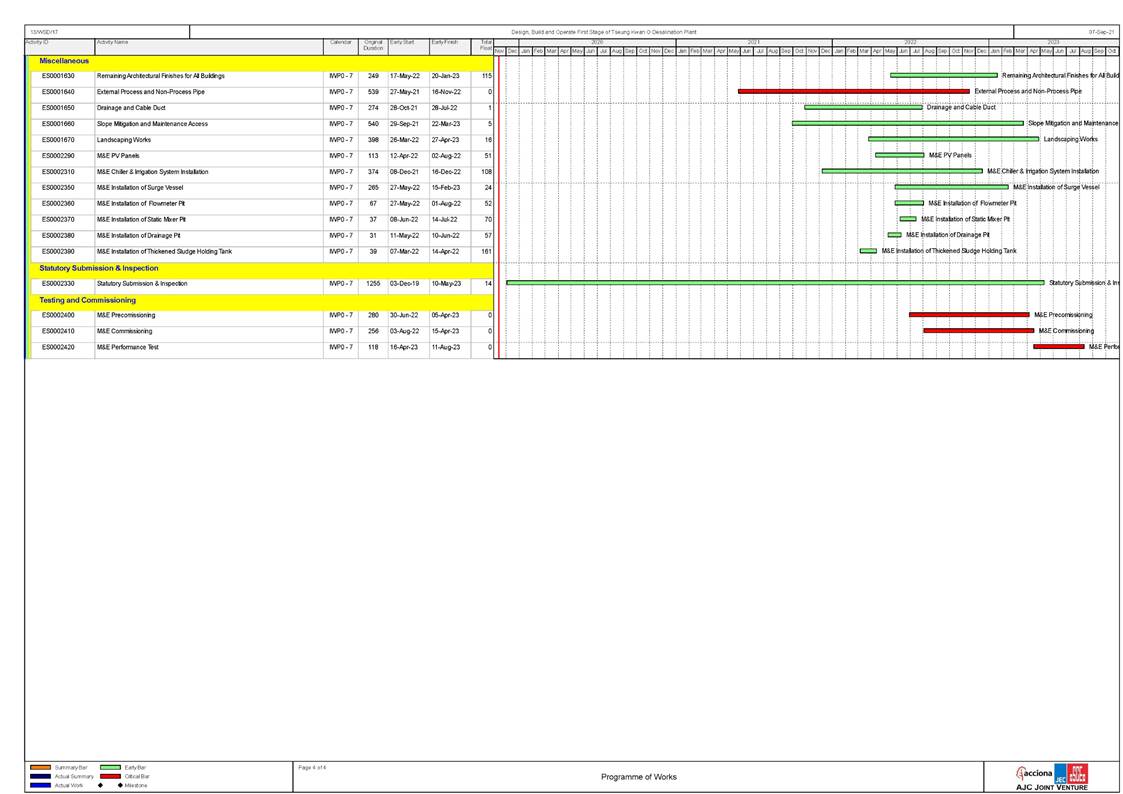
Appendix A Master Programme
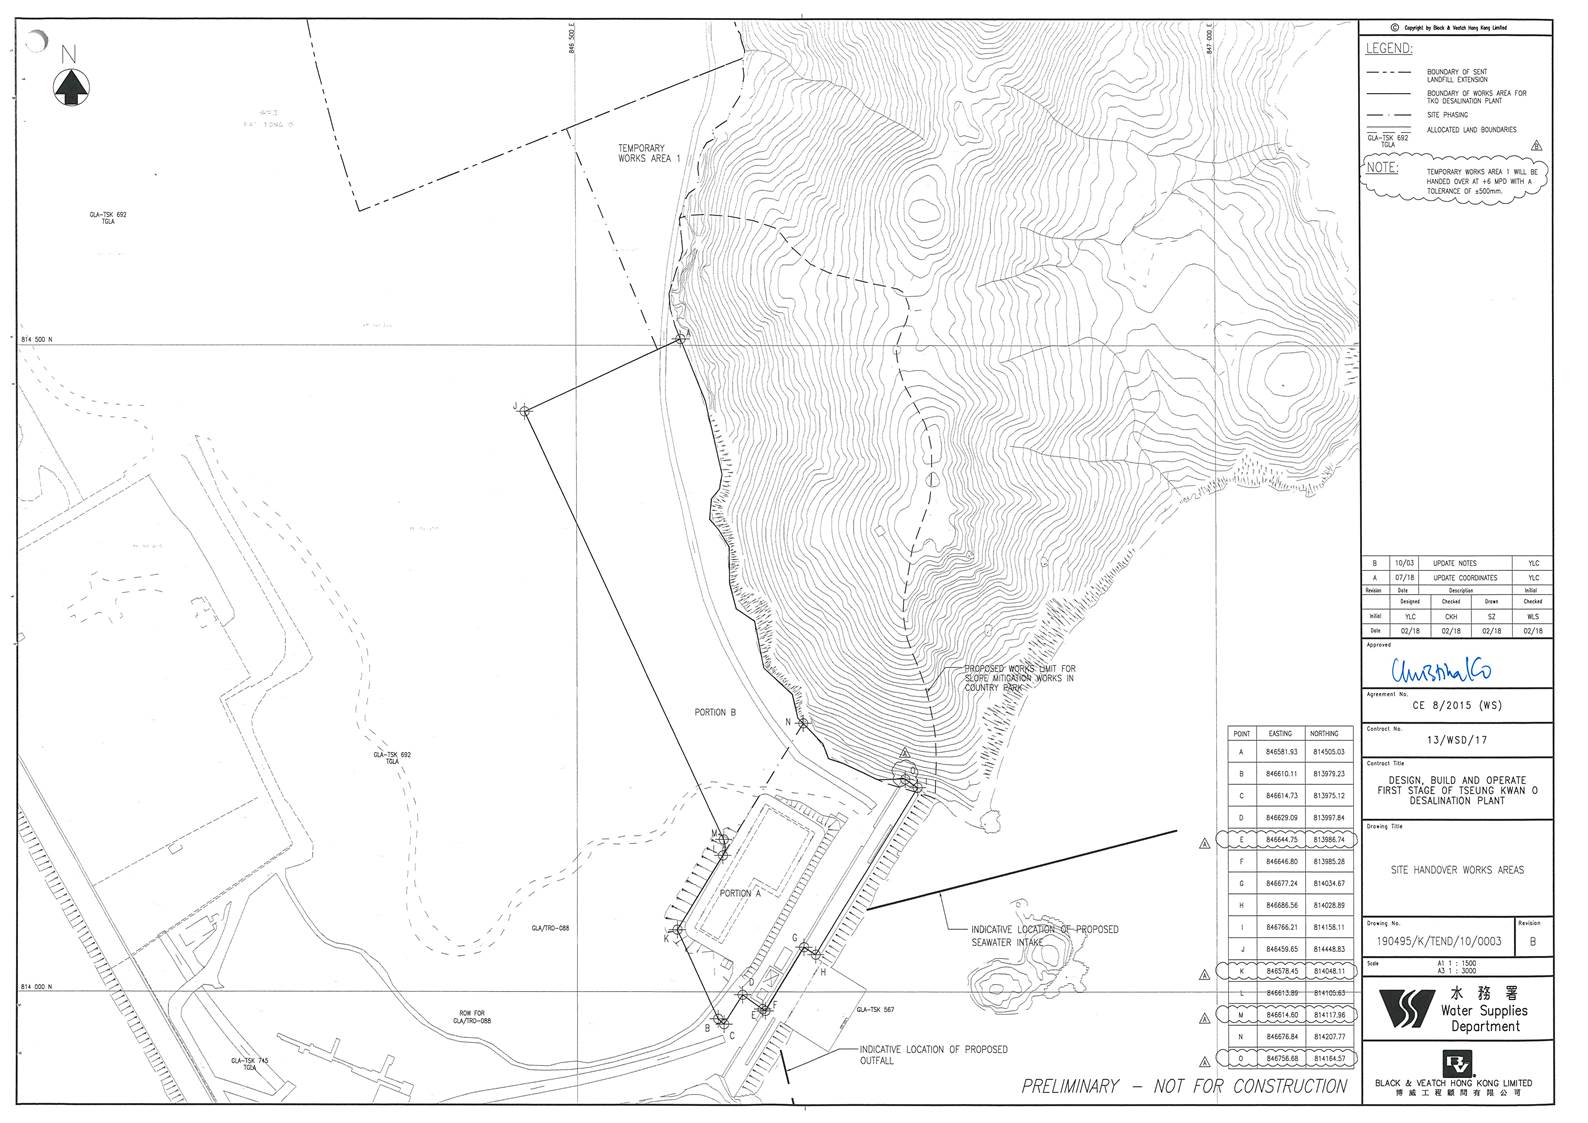
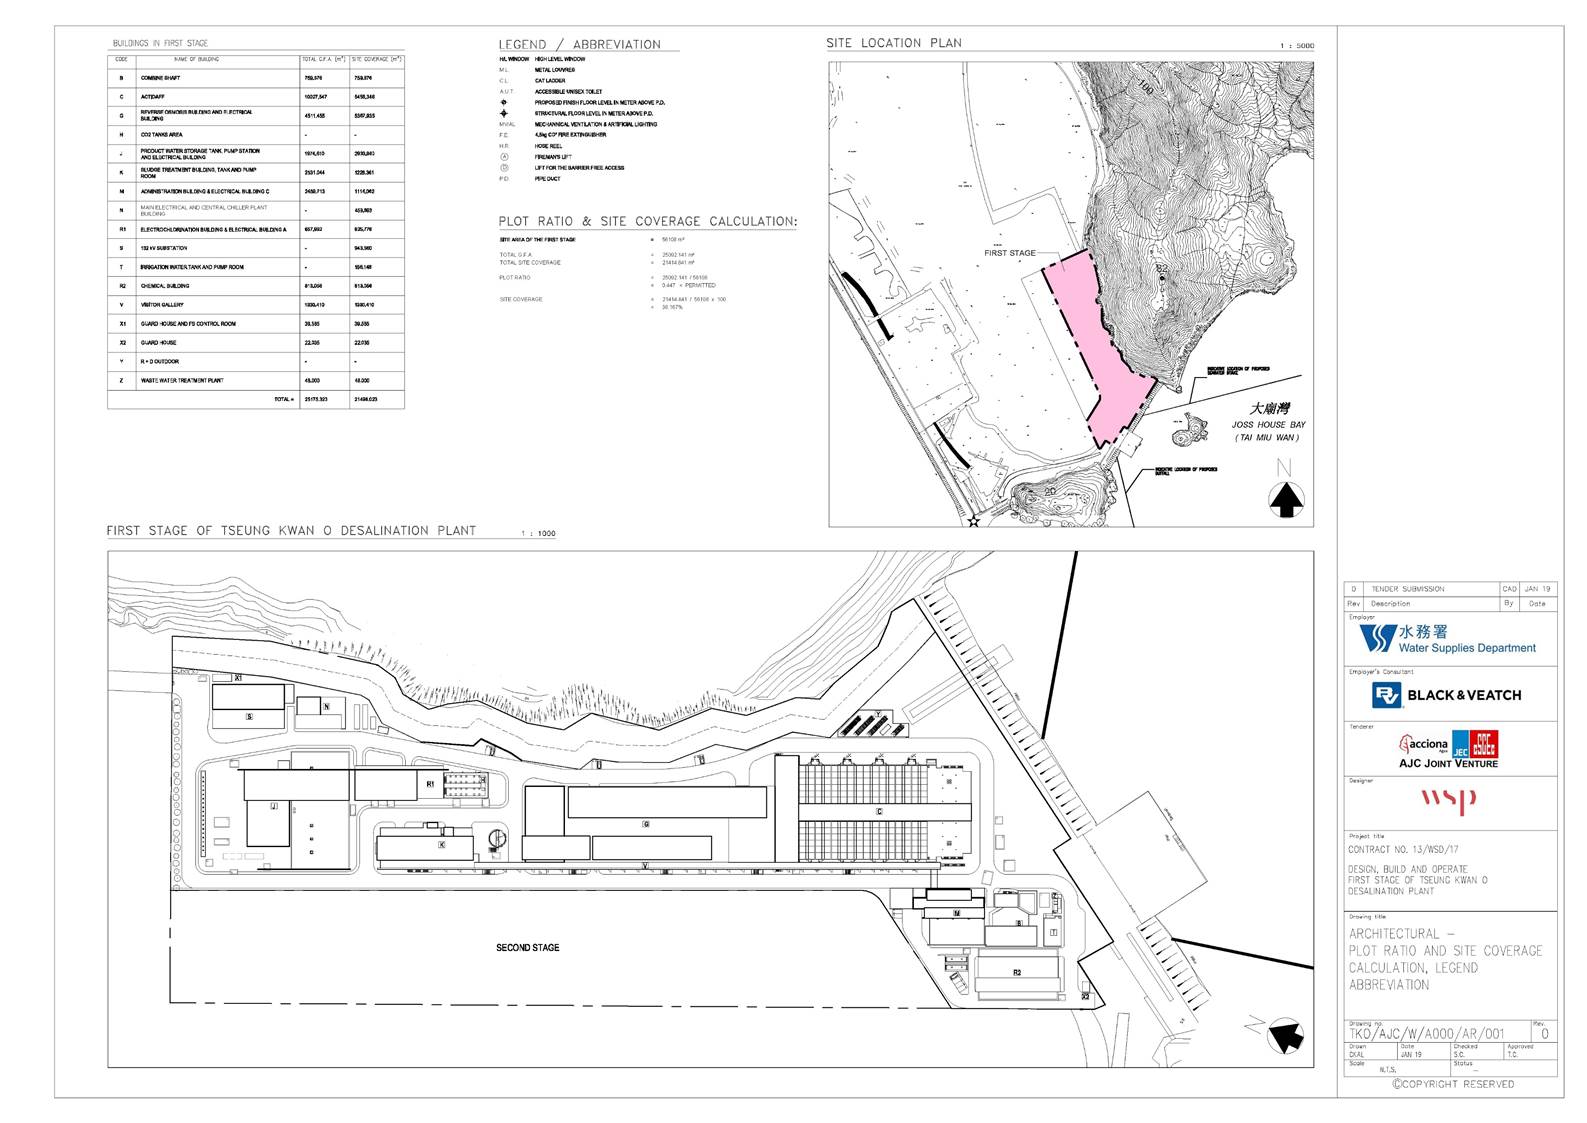
Appendix B Overview of Desalination Plant in Tseung Kwan O
Appendix C Summary of Implementation Status of Environmental Mitigation Appendix D Impact Monitoring Schedule of the Reporting Month
Appendix E Event/Action Plan for Noise Exceedance
Appendix F Noise Monitoring Equipment Calibration Certificate (Blank) Appendix G Event/Action Plan for Water Quality Exceedance
Appendix H Waste
Flow Table
Appendix I Site Inspection Proforma
Appendix J Complaint Log
Appendix K Impact Monitoring Schedule of Next Reporting Month
Appendix L Water
Quality and Landfill Gas Monitoring Data
Appendix M HOKLAS Laboratory Certificate
Appendix N
Water Quality and Landfill Gas Equipment Calibration Certificate
Appendix O Exceedance Report(s)
INTRODUCTION
A1. The Project, Design, Build and Operate First Stage of Tseung Kwan O Desalination Plant (TKODP), is a Designated Project under the Environmental Impact Assessment Ordinance (Cap. 499) (EIAO) and is currently governed by a Further Environmental Permit (EP No. FEP - 01/503/2015/A) for the construction and operation of the Contract.
A2. In accordance with the Environmental Monitoring and Audit (EM&A) Manual for the Contract, EM&A works for marine water quality, noise, waste management and ecology should be carried out by Environmental Team (ET), Acuity Sustainability Consulting Limited (ASCL), during the construction phase of the Contract.
A3. This is the 23rd Monthly EM&A Report, prepared by ASCL, for the Contract summarizing the monitoring results and audit findings of the EM&A programme at and around Tseung Kwan O Area 137 (TKO 137) during the reporting period from 1 January 2022 to 31 January 2022.
A4. The EM&A programme for this contract has covered environmental monitoring on construction noise level at selected NSRs and Contractor��s environmental performance auditing in the aspects of construction dust, construction noise, water quality, waste management, Landscape and Visual and Ecology.
SUMMARY OF
MAIN
WORKS UNDERTAKEN & KEY MITIGATION MEASURES IMPLEMENTED
A5. Key activities carried out in this reporting period for the Contract included the followings:
-
Land Survey;
-
Construction of ActiDAFF
parapet;
-
Construction of Reverse
Osmosis (RO) Building
- staircases and internal finishing;
-
Construction of Sludge
tank and Post Treatment Building
(PTB);
-
Construction of
On-Site Chlorine Generation (OSCG) Building and carbon dioxide (CO2) tank area;
-
Internal finishing works at Product
Water Storage Tank (PWST) and Electrical Building
and Main Electrical and Central Chiller Plant Building (MECCP);
-
Construction of manhole
and Glass Reinforced Plastic (GRP) pipe installation;
-
Commence construction of Manholes no.15 and no.16
adjacent to ActiDAFF
and Reverse Osmosis Area (RO);
-
Construction of first and second
floor walls and columns of Administration Building;
-
Construction of reinforced concrete (RC) support
of Inspection Corridor;
-
Construction of 1st floor structural wall of
Chemical Building;
-
Dewatering, predrill, rock cutting and excavations at Outfall Shaft;
-
Excavation & Lateral
Support (ELS) erection
and commencement of marine dredging
at Intake Shaft;
-
Concrete blinding laying and backfill with aggregate at Intake
Shaft;
-
Pipe jacking works
at Combined Shaft for
Intake & Outfall
pipelines;
-
Outfall Shaft - rock coring,
chain-cut the bed rock inside
the caisson and pumping clean seepage water within silt curtain
area
-
Intake Shaft - fitting in waling and welding inside the shaft
-
Intake Shaft - excavate
non-MD inside the shaft
-
Intake Shaft
- Blinding layer concreting works inside
the shaft
-
Intake Shaft
- mobilizing vibratory hammer for retrieving 7 nrs. pipe piles
-
Construction of
base slab of Pump house
A6. The major environmental impacts brought by the above construction works include:
- Construction dust and noise generation from marine construction works, excavation works, construction works; rock cutting works and pipe piling driving works
- Waste generation from the construction activities
- Impact on water quality from marine construction works and inland construction works
A7. The key environmental mitigation measures implemented for the Contract in this reporting period associated with the above construction works include:
- Dust suppression by regular wetting and water spraying for construction works;
- Reduction of noise from equipment and machinery on-site and regular inspection to machinery and plants/vehicles on-site to ensure proper functioning;
- Sorting and storage of general refuse and construction waste; and
- Deployment of temporary silt curtain in the area where marine construction works were conducted and deployment of water sedimentation tanks for treatment of wastewater at inland and marine areas before discharge.
SUMMARY OF EXCEEDANCE & INVESTIGATION
& FOLLOW-UP
A8. No noise monitoring was conducted during the reporting period since there are no Contract - related construction activities undertaken within a radius of 300m from the monitoring locations. No contract-related exceedance of the Action Level was recorded during the reporting period.
A9. The EM&A works for water quality were conducted during the reporting period in accordance with the EM&A Manual.
A10. Fifty-two (52) of the general water quality monitoring results of suspended solids (SS) obtained had exceeded the Action Level. Thirty-three (33) of the general water quality monitoring results of SS obtained during the reporting period had exceeded the Limit Level.
A11.Details of the exceedance are presented in Appendix O.
A12.Investigation
on the reason of exceedance has been carried out, where the exceedances of SS on 1, 4, 6, 8, 11, 15, 18, 20, 22, 25, 27, 29 and 31 January 2022 were concluded to be unrelated
to the Contract as detailed in the Incident Reports on Action Level or
Limit Level Non- compliance along with supporting materials in Appendix O.
A13. It was concluded that all exceedances recorded in January were unrelated to the Contract.
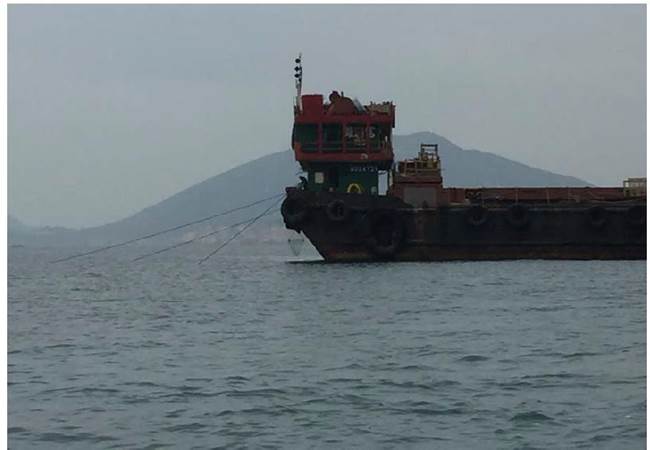
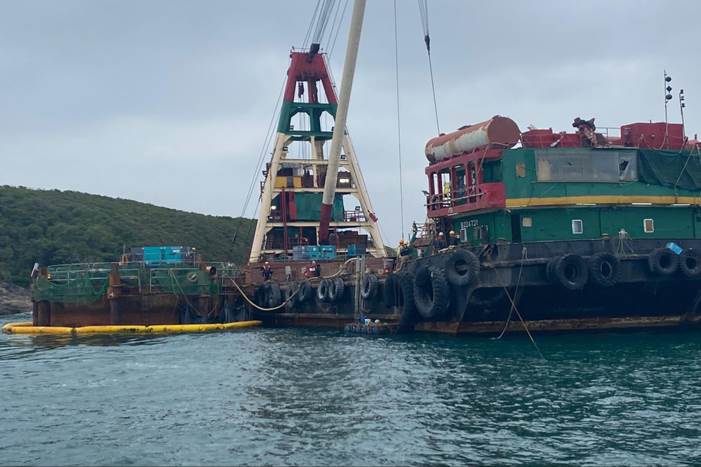
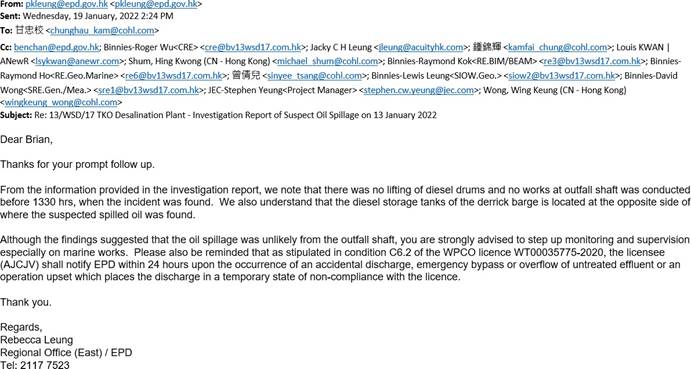
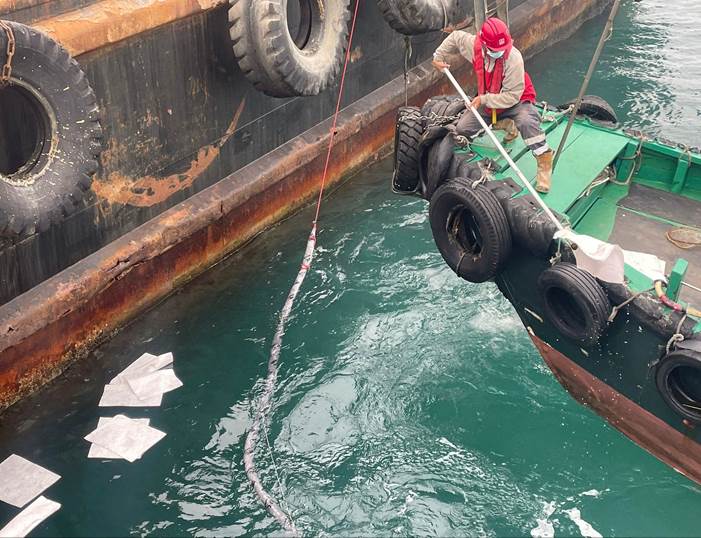
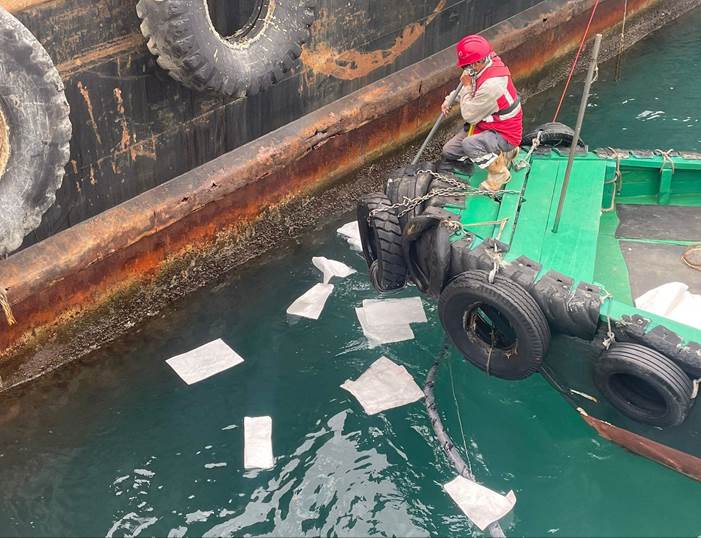
A14.ACJCJ��s Environmental Office received a text message on 14 January 2022 from EPD inspector claiming that susceptible oil spillage at the water surface nearby to Outfall Shaft was observed during their routine drone check on 13 January 2022. The message from EPD was relayed to ET by AJCJV on 15 January 2022. Immediate investigation by AJCJV has been made after the acknowledgement of the incident, whilst implementing emergency clean up measure on any residue oil spillage. After investigation, the oil spillage was unlikely originated from the Outfall Shaft. The incident may therefore be considered as non-project related. Detail of the incident could be referring to Appendix O.
A15.In this reporting period, 47 times of landfill gas monitoring were recorded at Wan Po Road (Ch1+360 - Ch1+513). No exceedance of action and limit levels for methane, oxygen and carbon dioxide was observed. Monitoring was conducted during excavations at 1m depth or more within the consultation zone and whenever workers entered the excavation on the day.
A16.Joint site inspections of the construction work by ET and IEC were carried out on 4, 11, 18,
26 and 31 January 2022 to audit the mitigation measures implementation status.
Observations were recorded
in the site inspection
checklists and provided to the contractors together with the appropriate follow-up actions where necessary.
COMPLAINT HANDLING AND PROSECUTION
A17.No environmental complaint was received during the reporting period. A18.Neither notification of summons nor prosecution was received for the Contract.
REPORTING CHANGE
A19.There was no change to be reported that may affect the on-going EM&A programme.
SUMMARY OF UPCOMING KEY ISSUES AND
KEY MITIGATION MEASURES
A20.Key activities anticipated in the next reporting period for the Contract will include the followings:
- Land Survey;
- Construction of solar panel supports at roof of ActiDAFF;
- Construction of Reverse Osmosis (RO) Building - staircases and internal finishing;
- Construction of sludge thickener, Post Treatment Building (PTB);
- Construction of On-Site Chlorine Generation Building (OSCG Bldg) and carbon dioxide (CO2) Tank area;
- Internal finishing work at Product Water Storage Tank (PWST), Electrical Building and Main Electrical (elec), Building. and Central Chiller Plant Building (MECCP);
- Manhole construction and Glass Reinforced Plastic (GRP) pipe installation;
- Construction of manholes no.15 and no.16 adjacent to ActiDAFF and RO;
- Construction of 1/F to 2/F walls and columns of Administration Building;
- Construction of reinforced concrete (RC) support of Inspection Corridor;
- Construction of structural wall and Roof of Chemical Building;
- Outfall Shaft - Dewatering; Predrill, Rock cutting and excavations;
- Intake shaft - Retrieval of DN 2500 Tunnel Boring Machine (TBM) under water;
- Pipe jacking at Combined Shaft for Outfall pipelines; and
- Intake tunnel - Demobilize the jack pipe system and commencement of grouting works.
A21.The major environmental impacts brought by the above construction works will include:
- Construction dust and noise generation from pipe piling driven works, rock cutting works, drilling, excavation and construction works;
- Waste generation from construction activities; and
- Impact on water quality from marine construction works and inland construction works.
A22. The key environmental mitigation measures for the Contract in the coming reporting period associated with the above construction works will include:
- Dust suppression by regular wetting and water spraying for construction works;
- Reduction of noise from equipment and machinery on-site;
- Sorting and storage of general refuse and construction waste; and
- Deployment of temporary silt curtain in the area where marine construction works were conducted and deployment of water sedimentation tanks for treatment of wastewater at inland and marine areas before discharge.
1.1. BACKGROUND
The Acciona Agua, S.A. Trading, Jardine Engineering Corporation, Limited and China State Construction Engineering (Hong Kong) Limited As AJC Joint Venture (AJCJV) is contracted to carry out the Design, Build and Operate First Stage of Tseung Kwan O Desalination Plant (DPTKO) under Contract No. 13/WSD/17 (the Contract).
Acuity Sustainability Consulting Limited (ASCL) is commissioned by AJCJV to undertake the Environmental Team (ET) services as required and/or implied, both explicitly and implicitly, in the Environmental Permit (EP), Environmental Impact Assessment Report (EIA Report) (Register No. AEIAR-192/2015) and Environmental Monitoring and Audit Manual (EM&A Manual) for the Contract; and to carry out the Environmental Monitoring and Audit (EM&A) programme in fulfillment of the EIA Report��s EM&A requirements and Contract No. 13/WSD/17 Specification requirements.
Pursuant to the Environmental Impact Assessment Ordinance (EIAO), the Director of Environmental Protection granted the Environmental Permit (No. EP-01/503/2015) and Variation of Environmental Permit (No. EP-01/503/2015/A) to Water Supplies Department (WSD); and granted the Further Environmental Permit (No. FEP-01/503/2015/A) to AJCJV for the Contract.
1.2. THE REPORTING SCOPE
This is the 23rd Monthly EM&A Report for the Contract which summarizes the key findings of the EM&A programme during the reporting period from 1 January to 31 January 2022.
1.3. CONTRACT ORGANIZATION
The Contract Organization structure for Construction Phase is presented in Figure 1.1.
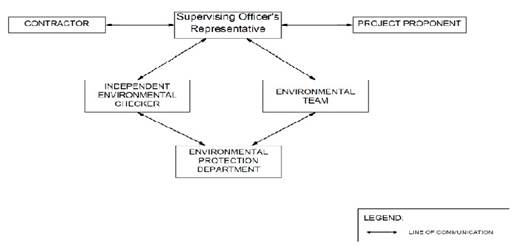
Contact details of the key personnel are presented in Table 1.1 below:
|
Party |
Position |
Name |
Telephone no. |
|
Contract Proponent (Water
Supplies Department) |
SE/CM2 |
Benny Lam |
2634-3573 |
|
Supervising Officer (Binnies Hong Kong Limited) |
Project Manager |
Christina Ko |
2608-7302 |
|
Chief Resident Engineer |
Roger Wu |
6343-1002 |
|
|
The
Jardine Engineering Corporation, Limited,
China State Construction Engineering
(Hong Kong) Limited and Acciona Agua,
S.A. Trading |
Project Manager |
Stephen Yeung |
2807-4665 |
|
Environmental Monitoring Manager |
Brian Kam |
9456-9541 |
|
|
Acuity Sustainability Consulting Limited |
Environmental Team Leader |
Jacky Leung |
2698-6833 |
|
ANewR Consulting Limited |
Independent Environmental Checker (IEC) |
Louis Kwan |
2618-2831 |
1.4. SUMMARY OF CONSTRUCTION WORKS
Details of the major construction activities undertaken in this reporting period are shown as below. The construction programme is presented in Appendix A.
Key activities carried out in this reporting period for the Contract included the followings:
-
Land Survey;
-
Construction of ActiDAFF
parapet;
-
Construction of Reverse
Osmosis (RO) Building - staircases and internal
finishing;
-
Construction of Sludge
tank and Post Treatment Building
(PTB);
-
Construction of
On-Site Chlorine Generation (OSCG) Building and carbon dioxide (CO2) tank area;
-
Internal finishing works at Product
Water Storage Tank (PWST) and Electrical Building
and Main Electrical and Central Chiller Plant Building (MECCP);
-
Construction of manhole
and Glass Reinforced Plastic (GRP) pipe installation;
-
Commence construction of Manholes no.15 and no.16
adjacent to ActiDAFF
and Reverse Osmosis
Area (RO);
-
Construction of first and second
floor walls and columns of Administration Building;
-
Construction of reinforced concrete (RC) support
of Inspection Corridor;
-
Construction of 1st floor structural wall of
Chemical Building;
-
Dewatering, predrill, rock cutting and excavations at Outfall
Shaft;
-
Excavation & Lateral
Support (ELS) erection and commencement of marine
dredging at Intake Shaft;
-
Concrete blinding laying and backfill with aggregate at Intake
Shaft;
-
Pipe jacking works
at Combined Shaft for
Intake & Outfall pipelines;
-
Outfall Shaft - rock coring,
chain-cut the bed rock inside
the caisson and pumping clean seepage water within silt curtain
area
-
Intake Shaft - fitting in waling and welding inside the shaft
-
Intake Shaft - excavate
non-MD inside the shaft
-
Intake Shaft
- Blinding layer concreting works inside
the shaft
-
Intake Shaft
- mobilizing vibratory hammer for retrieving 7 nrs. pipe piles
-
Construction of
base slab of Pump house
A summary of the valid permits, licences, and/or notifications on environmental protection for this Contract is presented in Table 1.2.
|
Permit/ Licenses/ Notification |
Reference |
Validity Period |
Remarks |
|
Environmental Permit |
FEP - 01/503/2015/A |
Throughout
the Contract |
|
|
Notification
of Construction Works under the Air Pollution Control (Construction
Dust) Regulation (Form NA) |
Ref. No.:
451539 |
Throughout
the Contract |
|
|
Wastewater
Discharge Licence (Land and Marine works) |
WT00035775-2020 |
23/08/2021 - 31/07/2025 |
|
|
Chemical
Waste Producer Registration |
5213-839-A2987-01 |
Throughout
the Contract |
|
|
Construction Noise Permit (24 hrs)
- CNP
for general works, TBM at Combined Shaft
and marine works |
GW-RE1041-21 |
01/11/2021 - 30/04/2022 |
|
|
Billing
Account for Disposal of Construction Waste |
7036276 |
Throughout
the Contract |
|
|
Vessel CHITs
for fill disposal |
7039300 |
*Application
for renewal was submitted on 14 December
2021. Application in progress |
|
|
Dumping
at Sea Ordinance (DASO) Permit to
dump materials (Category M) at sea |
EP/MD/22-083 |
03/12/2021 - 02/01/2022 |
|
|
Dumping
at Sea Ordinance (DASO) Permit to
dump materials (Category L) at sea |
EP/MD/22‐028 |
02/08/2021 - 01/02/2022 |
|
The status for all environmental aspects is presented in Table 1.3.
|
Parameters |
Status |
|
Water Quality |
|
|
Baseline
Monitoring under EM&A Manual |
The baseline water quality monitoring was conducted between 12 May 2020 to
6 Jun 2020 |
|
Impact Monitoring |
On-going |
|
Noise |
|
|
Baseline Monitoring |
The baseline
noise monitoring result
has been reported
in Baseline Monitoring Report and submitted to EPD under EP Condition 3.4 |
|
Impact Monitoring |
On-going |
|
Waste Management |
|
|
Mitigation
Measures in Waste Monitoring Plan |
On-going |
|
Landfill Gas |
|
|
Regular
Monitoring when Construction Works
are within the 250m Consultation Zone |
In this reporting period,
47 time of landfill gas monitoring
was recorded at Wan Po Road (Ch1+360 - Ch1+513).
No exceedance of action and limit levels for
methane, oxygen and carbon dioxide
was observed. Monitoring was conducted during
excavations at 1m depth or more within
the consultation zone and whenever workers entered the excavation on the day. |
|
Environmental Audit |
|
|
Site
Inspection covering Measures of Air Quality, Noise Impact, Water Quality,
Waste, Ecological Quality, Fisheries, Landscape and Visual |
On-going |
Other than the EM&A work by ET, environmental briefings, trainings and regular environmental management meetings were conducted, in order to enhance environmental awareness and closely monitor the environmental performance of the contractors.
The EM&A programme has been implemented in accordance with the recommendations presented in the approved EIA Report and the EM&A Manual. A summary of implementation status of the environmental mitigation measures for the construction phase of the Contract during the reporting period is provided in Appendix C.
2.1. MONITORING REQUIREMENTS
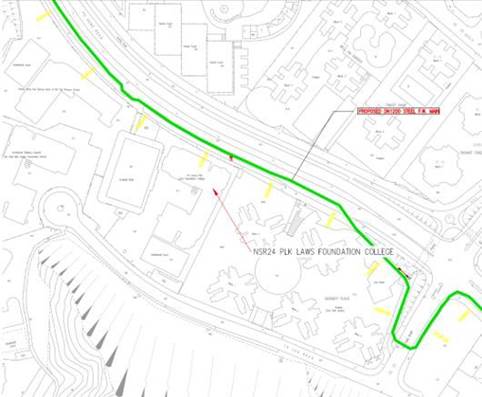
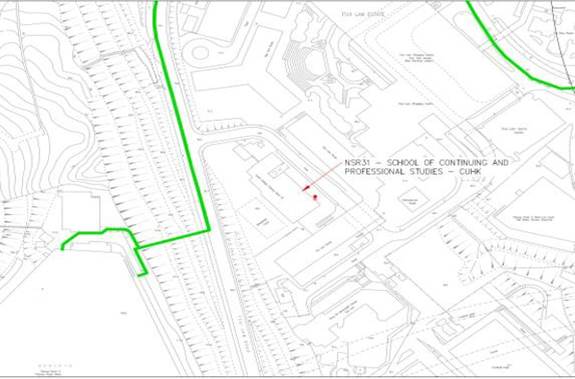
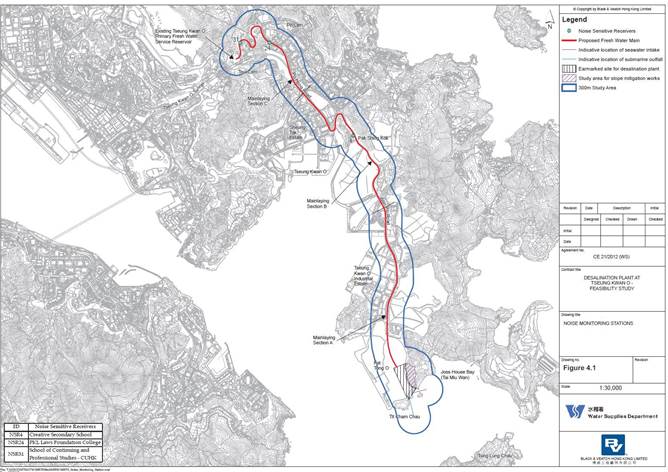
To ensure no adverse noise impact, noise monitoring is recommended to be carried out within 300m radius from the nearby noise sensitive receivers (NSRs), during construction phase. The NSRs selected as monitoring station are (i) NSR4 - Creative Secondary School, (ii) NSR24 - PLK Laws Foundation College, and (iii) NSR31 - School of Continuing and Professional Studies - CUHK respectively.
In accordance with the EM&A Manual, baseline noise level at the noise monitoring stations were established as presented in the Baseline Monitoring Report. Impact noise monitoring will be conducted once per week in the form of 30-minutes measurements Leq, L10 and L90 levels recorded at each monitoring station between 0700 and 1900 on normal weekdays.
Referring to EM&A manual Section 4.1.2, the impact noise monitoring should be carried out at all the designated monitoring stations when there are contract-related construction activities undertaken within a radius of 300m from the monitoring stations.
No impact monitoring for noise impact was conducted in the reporting month due to the overly distant monitoring station from the works location, where they were farther than 1 km from the closest monitoring station NSR4 to the works location.
Impact noise monitoring will be conducted weekly in the reporting period between 0700-1900 on normal weekdays. Construction works would follow stipulations of the valid Construction Noise Permits if works had to be conducted during restricted hours or public holidays.
Construction noise level were measured in terms of the A-weighted equivalent continuous sound pressure level (LAeq). Leq 30min was used as the monitoring parameter for the time period between 0700 and 1900 on normal weekdays. Table 2.1 summarizes the monitoring parameters, frequency and duration of the impact noise monitoring.
|
Time |
Duration |
Interval |
Parameters |
|
Daytime: 0700-1900 |
Day
time: 0700-1900 (during
normal weekdays) |
Continuously in Leq
5min/Leq 30min (average of 6 consecutive Leq 5min) |
Leq
30min L10
30min & L90
30min |
2.2. MONITORING LOCATIONS
The monitoring locations should normally be made at a point 1m from the exterior of the NSRs building façade and be at a position 1.2m above the ground. A correction of +3dB(A) should be made to the free-field measurements.
According to the environmental findings detailed in the EIA report and Baseline Monitoring Report, the designated locations for the construction noise monitoring are listed in Table 2.2 below.
|
NSR
ID |
Noise Sensitive Receivers |
Monitoring Location |
Position |
|
NSR 4 |
Creative Secondary School |
Roof Floor |
1
m from facade |
|
NSR 24 |
PLK
Laws Foundation College |
Pedestrian Road on
Ground Floor |
Free-field |
|
NSR 31 |
School of Continuing and Professional Studies - CUHK |
Roof Floor |
1
m from facade |
Three noise monitoring locations for impact monitoring at the nearby sensitive receivers are shown in Figure 2.1-2.3.
![]()
|
|
|
Figure 2.2 NSR24 PLK Laws Foundation College |
|
|
|
Figure 2.3 NSR31 School
of Continuing and Professional Studies - CUHK |
2.3. IMPACT MONITORING METHODOLOGY
Integrated sound level meter shall be used for the noise monitoring. The meter shall be in compliance with the International Electrotechnical Commission Publications 651: 1979 (Type 1) and 804: 1985 (Type 1) specifications. Immediately prior to and following each noise measurement the accuracy of the sound level meter shall be checked using an acoustic calibrator generating a known sound pressure level at a known frequency. Measurements may be accepted as valid only if the calibration levels before and after the noise measurements agree to within 1.0 dB(A). Calibration certificates of the instruments used to be shown at Appendix F are intentionally left blank since no impact monitoring equipment was used in the reporting month.
Noise measurements shall not be made in the presence of fog, rain, wind with a steady speed exceeding 5 m/s or wind with gusts exceeding 10 m/s. The wind speed shall be checked with a portable wind speed meter capable of measuring the wind speed in m/s.
|
Equipment |
Brand and
Model |
Detection Limit |
|
Sound Level
Meter |
Nti XL2 |
30-130 dB(A) |
|
Sound Level
Meter Calibrator |
Rion NC-74 |
Nil |
|
Pocket Wind Meter Anemometer |
Kestrel 1000
Wind Meter |
Nil |
2.4. ACTION AND LIMIT LEVELS
The Action/Limit Levels are in line with the criteria of Practice Note for Professional Persons (ProPECC PN 2/93) ��Noise from Construction Activities - Non-statutory Controls�� and Technical Memorandum on Environmental Impact Assessment Process issued by HKSAR Environmental Protection Department [��EPD��] under the Environmental Impact Assessment Ordinance, Cap 499, S.16 are presented in Table 2.4.
|
Time Period |
Action |
Limit (dB(A)) |
|
0700-1900 on normal
weekdays |
When one documented complaint is received from any one of the noise sensitive receivers |
-
70 dB(A)
for school and -
65 dB(A) during
examination period |
Notes: Limits
specified in the GW-TM and IND-TM for construction and operation noise,
respectively.
If exceedances were found during noise monitoring, the actions in accordance with the Event and Action Plan shall be carried out according to Appendix E.
2.5. MONITORING RESULTS AND OBSERVATIONS
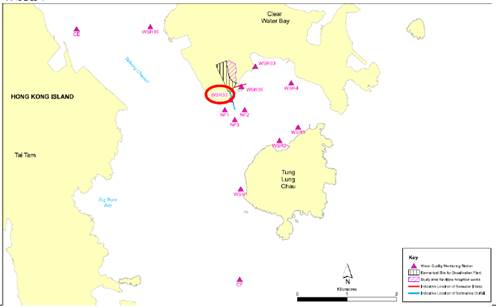
Referring to EM&A manual Section 4.1.2, the impact noise monitoring should be carried out when there are Contract-related construction activities undertaken within a radius of 300m from the monitoring stations. No monitoring station was located within a radius of 300m of the Contract site as shown in Figure 2.4, no impact monitoring for noise impact was conducted in the reporting period.
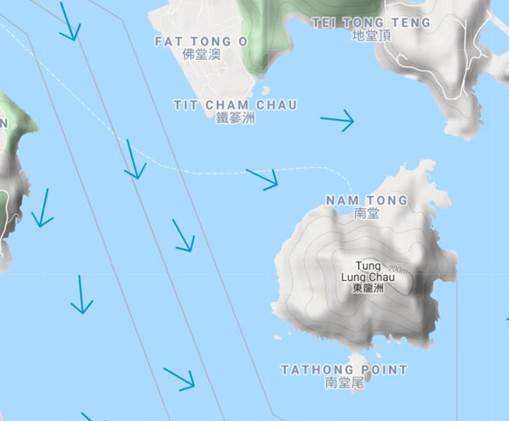
In accordance with the recommendations of the EIA, water quality EM&A is required during dredging for the submarine pipelines and, during operation phase. In addition, baseline water quality monitoring will be required prior to the commencement of marine construction activities. The following Section provides details of the water quality monitoring to be undertaken by the Environmental Team (ET) to verify the distance of sediment and brine plume dispersion and to identify whether the potential exists for any indirect impacts to occur to ecological sensitive receivers. The water quality monitoring programme will be carried out to allow any deteriorating water quality to be readily detected and timely action taken to rectify the situation. The status and locations of water quality sensitive receivers and the marine works location may change after issuing this Document. If required, the ET in consultation with IEC will propose updated monitoring locations and seek approval from EPD.
Water quality monitoring for the Contract can be divided into the following stages:
- Dredging activities during construction phase;
- Discharge of effluent from main disinfection during construction phase;
- Operation phase - first year upon commissioning; and,
- Continuous monitoring of effluent quality.
In addition, the marine works contractor is required to complete a silt curtain efficiency test for the combined use of floating silt curtain type and cage type silt curtain for dredging at seawater intake to confirm the silt curtain reduction efficiency assumptions of the assessment. The details of testing plan together with the silt curtain deployment plan shall be submitted by the ET to seek approval from the IEC and EPD.
With the onset of marine dredging activities in late April 2021 at Outfall Shaft Area, a silt curtain efficiency test has been conducted at the Outfall Shaft Area on 16th April 2021 at 6 monitoring intervals (08:00, 10:00, 12:00, 14:00, 16:00, 18:00). The baseline monitoring event has been conducted on 10th April 2021 at 5 monitoring locations. Testing protocols and methodologies had followed the guidelines as presented in the EM&A Manual Annex C. Detailed analysis of in-situ and laboratory data was presented in a separate report which has been submitted to EPD after approval by IEC on 31 May 2021. The overall Silt Removal Effectiveness at Outfall Shaft Area for the combined used of cage and floating type silt curtains was 95.28%.
3.1.1.
WATER QUALITY PARAMETERS
The parameters that have been selected for measurement in situ and in the laboratory are those that were either determined in the EIA to be those with the most potential to be affected by the construction works or are a standard check on water quality conditions. Parameters to be measured in the baseline monitoring are listed in Table 3.1.
|
Parameters |
Unit |
Abbreviation |
|
In-situ measurements |
||
|
Dissolved oxygen |
mg/L |
DO |
|
Temperature |
oC |
- |
|
pH |
- |
- |
|
Turbidity |
NTU |
- |
|
Salinity |
0/00 |
- |
|
Total Residual Chlorine NOTE1 |
mg/L |
TRC |
|
Laboratory measurements |
||
|
Suspended Solids |
mg/L |
SS |
|
Iron-Soluble NOTE2 |
mg/L |
Fe |
|
Anti-scalant as Reactive Phosphorus NOTE2 |
mg/L |
PO4 as P- |
NOTE 1: Monitoring of
TRC will be conducted when cleaning and sterilization of the new freshwater
main is carried out. NOTE 2: The testing
methods shall be submitted to EPD for approval prior to the commencement of monitoring programme
In addition to the water quality parameters, other relevant data will also be measured and recorded in Water Quality Monitoring Logs, including the location of the sampling stations, water depth, time, weather conditions, sea conditions, tidal stage, current direction and velocity, special phenomena and work activities undertaken around the monitoring and works area that may influence the monitoring results.
3.1.2.
MONITORING EQUIPMENT
For water quality monitoring, the following equipment will be used:
Dissolved Oxygen and Temperature Measuring Equipment - The instrument will be a portable, weatherproof dissolved oxygen measuring instrument complete with cable, sensor, comprehensive operation manuals, and will be operable from a DC power source. It will be capable of measuring: dissolved oxygen levels in the range of 0 - 20 mg/L and 0 - 200% saturation; and a temperature of 0
- 45 degrees Celsius. It shall have a membrane electrode with automatic temperature compensation complete with a cable of not less than 35 m in length. Sufficient stocks of spare electrodes and cables shall be available for replacement where necessary (e.g. YSI model 59 DO meter, YSI 5739 probe, YSI 5795A submersible stirrer with reel and cable or an approved similar instrument).
Turbidity Measurement Equipment - The instrument will be a portable, weatherproof turbidity- measuring unit complete with cable, sensor and comprehensive operation manuals. The equipment will be operated from a DC power source, it will have a photoelectric sensor capable of measuring turbidity between 0 - 1000 NTU and will be complete with a cable with at least 35 m in length (for example Hach 2100P or an approved similar instrument).
Salinity Measurement Instrument - A portable salinometer capable of measuring salinity in the range of 0 - 40 ppt will be provided for measuring salinity of the water at each monitoring location.
Water Depth Gauge - A portable, battery-operated echo sounder (for example Seafarer 700 or a similar approved instrument) will be used for the determination of water depth at each designated monitoring station. This unit will preferably be affixed to the bottom of the work boat if the same vessel is to be used throughout the monitoring programme. The echo sounder should be suitably calibrated. The ET shall seek approval for their proposed equipment with the client prior to deployment.
Current Velocity and Direction - No specific equipment is recommended for measuring the current velocity and direction. The environmental contractor shall seek approval of their proposed equipment with the client prior to deployment.
Positioning Device - A Global Positioning System (GPS) shall be used during monitoring to allow accurate recording of the position of the monitoring vessel before taking measurements. The Differential GPS, or equivalent instrument, should be suitably calibrated at appropriate checkpoint (e.g. Quarry Bay Survey Nail) to verify that the monitoring station is at the correct position before the water quality monitoring commence.
Water Sampling Equipment - A water sampler, consisting of a PVC or glass cylinder of not less than two litres, which can be effectively sealed with cups at both ends, will be used (e.g. Kahlsico Water Sampler 13SWB203 or an approved similar instrument). The water sampler will have a positive latching system to keep it open and prevent premature closure until released by a messenger when the sampler is at the selected water depth.
Total Residual
Chlorine for Discharge
of Sterilization Water - Total
residual chlorine (TRC) shall be measured
in-situ using a handheld colorimeter
with its testing toolkits.
3.1.3.
SAMPLING / TESTING PROTOCOLS
All in situ monitoring instruments will be checked, calibrated and certified by a laboratory accredited under HOKLAS or any other international accreditation scheme before use, and subsequently re- calibrated at monthly intervals throughout the stages of the water quality monitoring. Responses of sensors and electrodes will be checked with certified standard solutions before each use.
On-site calibration of field equipment shall follow the ��Guide to On-Site Test Methods for the Analysis of Waters��, BS 1427: 2009. Sufficient stocks of spare parts shall be maintained for replacements when necessary. Backup monitoring equipment shall also be made available so that monitoring can proceed uninterrupted even when equipment is under maintenance, calibration etc.
3.1.4.
LABORATORY MEASUREMENT AND ANALYSIS
All laboratory work shall be carried out in a HOKLAS accredited laboratory. Sufficient volume of each water sample shall be collected at the monitoring stations for carrying out the laboratory analyses. Using chain of custody forms, collected water samples will be transferred to an HOKLAS accredited laboratory for immediate processing. The determination work shall start within the next working day after collection of the water samples. The laboratory measurements shall be provided to the client within 5 working days of the sampling event. Analytical methodology and sample preservation of other parameters will be based on the latest edition of Standard Methods for the Examination of Waste and Wastewater published by APHA, AWWA and WPCF and methods by USEPA, or suitable method in accordance with requirements of HOKLAS or another internationally accredited scheme. The submitted information should include pre-treatment procedures, instrument use, Quality Assurance/Quality Control (QA/QC) details (such as blank, spike recovery, number of duplicate samples per-batch etc), detection limits and accuracy. The QA/QC details shall be in accordance with requirements of HOKLAS or another internationally accredited scheme.
Parameters for laboratory measurements, their standard methods and their detection limits are presented in Table 3.2.
|
Parameters |
Standard Methods |
Detection Limit |
Reporting Limit |
Precision |
|
Dissolved
oxygen (mg/L) |
Instrumental,
CTD |
0.1 |
- |
+-25% |
|
Temperature (oC) |
Instrumental,
CTD |
0.1 |
- |
+-25% |
|
pH |
Instrumental,
CTD |
0.1 |
- |
+-25% |
|
Turbidity (NTU) |
Instrumental,
CTD |
0.1 |
- |
+-25% |
|
Salinity (0/00) |
Instrumental,
CTD |
0.1 |
- |
+-25% |
|
Suspended Solids (mg/L) |
APHA 17th Ed 2540D |
1.0 |
2.0 |
+-17% |
|
Total Residual Chlorine
(mg/L) |
APHA 21st Ed 4500 - Cl G NOTE1 |
0.1NOTE1 |
0.2NOTE1 |
+-10% NOTE1 |
|
Iron-soluble |
USEPA 6010C NOTE 1 |
0.2NOTE1 |
0.2NOTE1 |
+-25%NOTE1 |
|
Anti-scalant as Reactive phosphorus |
APHA 4500P: B&F NOTE1 |
0.01NOTE1 |
0.01NOTE1 |
+-25%NOTE1 |
NOTE1: The testing
methods, Quality Assurance/Quality Control (QA/QC) details,
detection limits and accuracy shall be submitted to EPD for approval prior to the commencement of monitoring programme.
If exceedances were found during water monitoring, the actions in accordance with the Event and Action Plan shall be carried out according to Appendix G.
3.1.5.
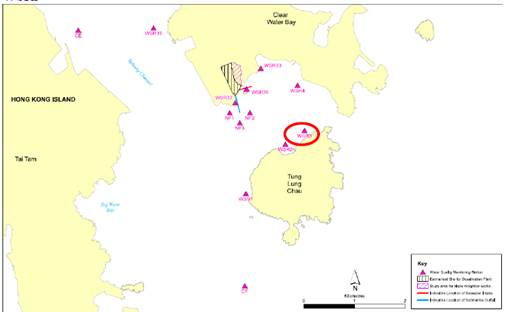
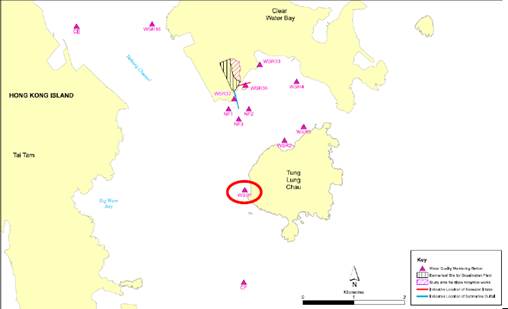
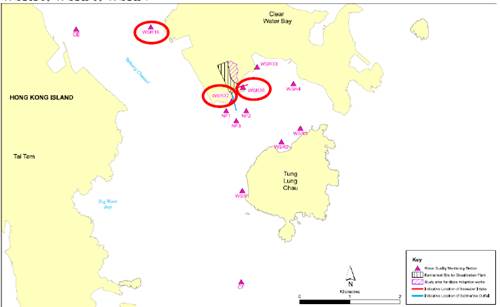
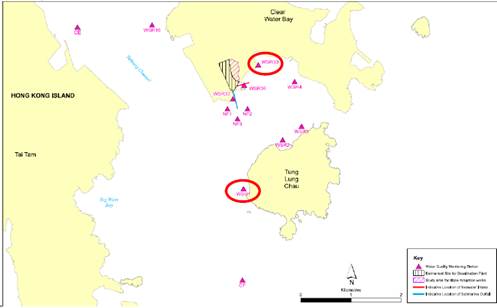
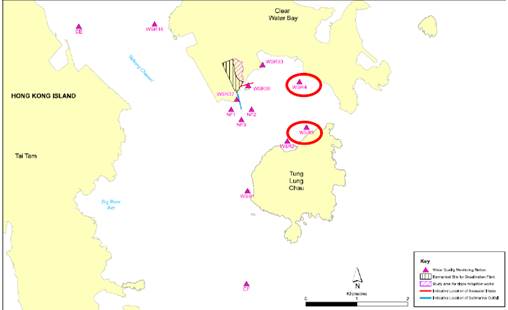
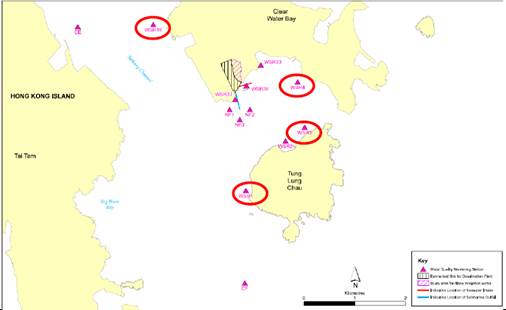
MONITORING LOCATION
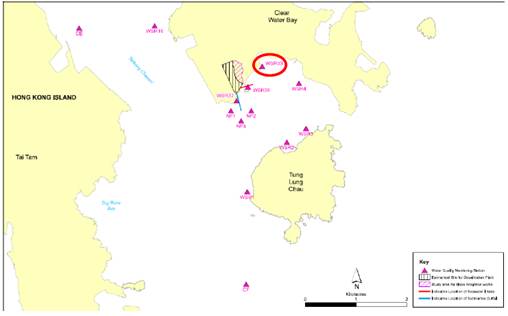
The water quality monitoring locations for baseline are in accordance with the EM&A Manual and detailed in Table 3.3 below. A schedule for water quality monitoring shall be prepared by the ET and approved by IEC and EPD prior to the commencement of the monitoring.
|
Station |
Easting |
Northing |
Description |
|
CE |
843550 |
815243 |
Upstream
control station at ebb tide |
|
CF |
846843 |
810193 |
Upstream control station at flood tide |
|
WSR1 |
846864 |
812014 |
Ecological sensitive receiver at Tung Lung Chau |
|
WSR2 |
847645 |
812993 |
Fisheries
sensitive receiver at Tung Lung Chau |
|
WSR3 |
848023 |
813262 |
Ecological sensitive receiver at Tung Lung Chau |
|
WSR4 |
847886 |
814154 |
Ecological sensitive receiver at Tai Miu Wan |
|
WSR16 |
845039 |
815287 |
Ecological sensitive receiver at Fat Tong Chau |
|
WSR33 |
847159 |
814488 |
Ecological sensitive receiver at Tai Miu Wan |
|
WSR36 |
846878 |
814081 |
Ecological sensitive receiver at Kwun Tsai |
|
WSR37 |
846655 |
813810 |
Ecological sensitive receiver at Tit Cham Chau |
|
NF1 |
846542 |
813614 |
Edge of mixing zone, ~ 200m west of outfall diffuser |
|
NF2 |
846942 |
813614 |
Edge of mixing zone, ~ 200m east of outfall
diffuser |
|
NF3 |
846742 |
813414 |
Edge of mixing zone, ~ 200m south of outfall diffuser |
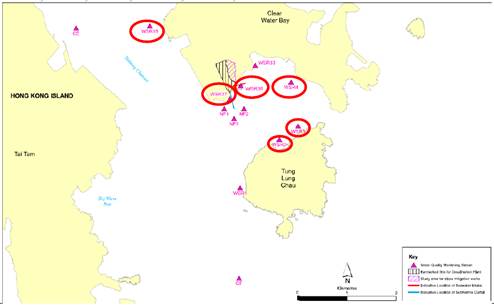
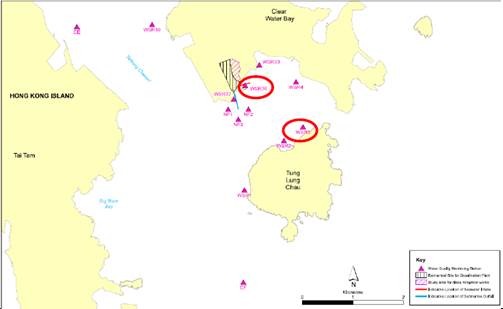
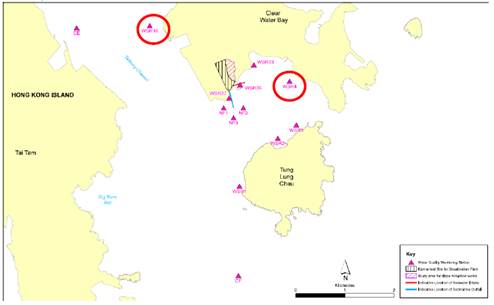
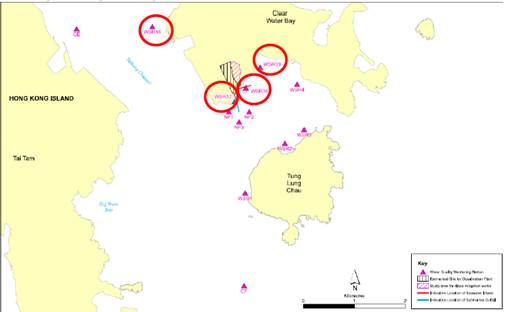
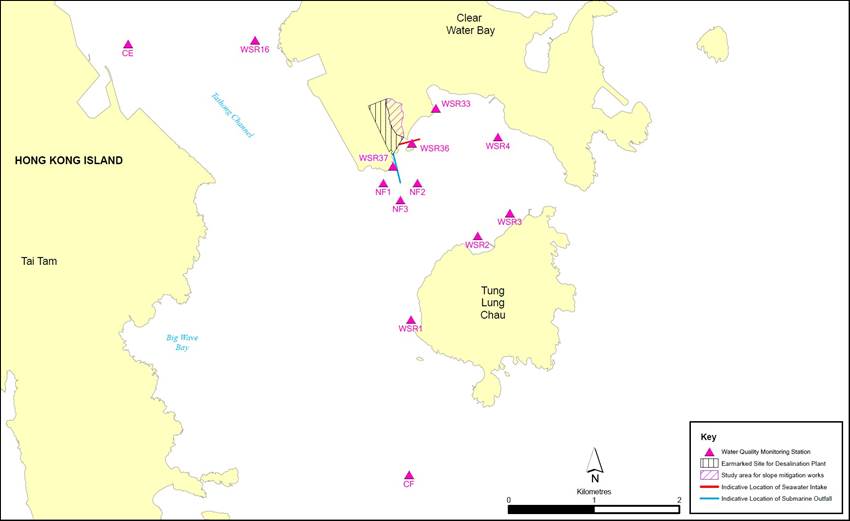
WSR1 to WSR37 were identified in accordance with Annex 14 of the EIAO-TM as well as Clause 3.4.4.2 of the Environmental Impact Assessment Study Brief for Desalination Plant at Tseung Kwan O (No. ESB-266/2013). WSR1 to WSR3 are sited near the Tung Lung Chau Fish Culture Zone; WSR16 and WSR36 are sited near the coral assemblages along the coastlines of Fat Tong Chau and Kwun Tsai respectively; WSR 4 and WSR33 are sited near the Coastal Protection Area and coral assemblages in waters of Tai Miu Wan; WSR37 is sited near the fisheries resource including spawning and nursery grounds at the coastal water of Tit Cham Chau.
3.1.6.
SAMPLING FREQUENCY
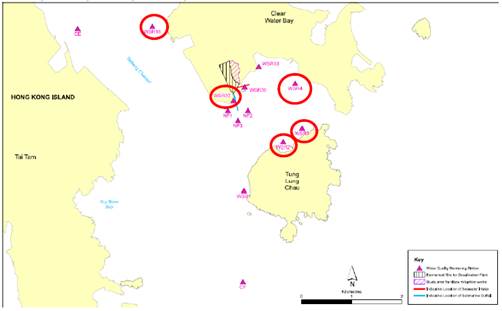
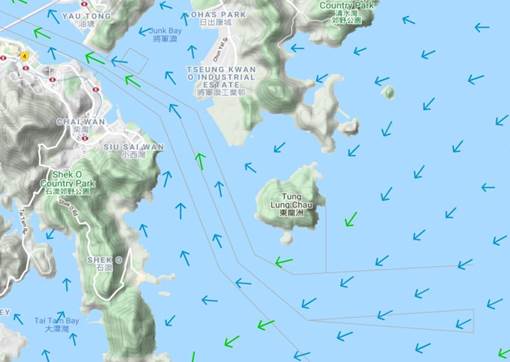
During periods when there are dredging works, impact monitoring should be undertaken at the monitoring stations as shown in Figure 3.1 and Table 3.3 three days per week during the construction phase after the commencement of marine construction works and dredging activities. Monitoring at each station would be undertaken at both mid-ebb and mid-flood tides on the same day. The tidal range selected for the baseline monitoring will be at least 0.5 m for both flood and ebb tides as far as practicable. The interval between two sets of monitoring would not be less than 36 hours. The monitoring frequency would be increased in the case of exceedances of Action/Limit Levels if considered necessary by ET. Monitoring frequency would be maintained as far as practicable.
The monitoring location/position, time, water depth, water temperature, salinity, weather conditions, sea conditions, tidal stage, special phenomena and work underway at the marine works site will be recorded.
3.1.7.
SAMPLING DEPTHS & REPLICATION
For baseline monitoring, each station will be sampled and measurements/ water samples will be taken at three depths, 1 m below the sea surface, mid-depth and 1 m above the seabed. For stations that are less than 3 m in depth, only the mid depth sample shall be taken. For stations that are less than 6 m in depth, only the surface and seabed sample shall be taken. For in situ measurements, duplicate readings shall be made at each water depth at each station. Duplicate water samples shall be collected at each water depth at each station. All observations and results were recorded in the data record sheets in Appendix L.
3.1.8.
ACTION AND LIMIT LEVELS
The Action and Limit Levels have been set based on the derivation criteria specified in the EM&A Manual, as shown in Table 3.4 below. Based on the baseline water quality monitoring data and the derivation criteria specified in Table 3.4, the Action/Limit Levels have been derived and are presented in Table 3.5.
3.2. MONITORING PROGRAMME
The ET of the Contract had conducted the baseline water monitoring between 12 May 2020 to 6 Jun 2020 at the thirteen designated monitoring stations and the six designated monitoring at waters near TKO in accordance with the EM&A Manual and Contract Specification respectively. The monitoring results was presented in Baseline Water Quality Monitoring Report separately.
The commencement of marine construction and dredging activities for the Contract have been conducted in March and April 2021 respectively.
|
Parameters |
Action |
Limit |
|
Construction Phase Impact
Monitoring |
||
|
DO in mg/L |
Surface and Middle 5%-ile of baseline data for surface and middle
layer Bottom 5%-ile of baseline data for bottom layers Tung Lung
Chau Fish Culture Zone 5.1
mgL-1 or
level at control
station (whichever the lower) |
Surface and Middle 4
mg L-1 Bottom 2
mg L-1 Tung Lung
Chau Fish Culture Zone 5.0 mgL-1 or level at control
station (whichever the lower) |
|
SS in mg/L (Depth- averaged) |
≥ 95 %-ile
of baseline data or 20% exceedance
of value at any impact station
compared with corresponding data
from control station |
≥ 99 %-ile
of baseline data or 30% exceedance
of value at any impact station
compared with corresponding data
from control station |
|
Turbidity in NTU (Depth-averaged) |
≥ 95 %-ile
of baseline data or 20% exceedance
of value at any impact station
compared with corresponding data
from control station |
≥ 99 %-ile
of baseline data or 30% exceedance
of value at any impact station
compared with corresponding data
from control station |
|
First-year Operation Phase Monitoring |
||
|
DO in mg/L |
Surface and Middle 5%-ile of baseline data for surface and middle
layer Bottom 5%-ile of baseline data for bottom layers Tung Lung
Chau Fish Culture Zone 5.1
mgL-1 or level
at control station
(whichever the lower) |
Surface and Middle 4
mg L-1 Bottom 2
mg L-1 Tung Lung
Chau Fish Culture Zone 5.0
mgL-1 or level
at control station
(whichever the lower) |
|
SS in mg/L (Depth- averaged) |
≥ 95 %-ile
of baseline data or 20% exceedance
of value at any impact station
compared with corresponding data
from control station |
≥ 99 %-ile
of baseline data or 30% exceedance
of value at any impact station
compared with corresponding data
from control station |
|
Turbidity in NTU (Depth-averaged) |
≥ 95 %-ile
of baseline data or 20% exceedance
of value at any impact station
compared with corresponding data
from control station |
≥ 99 %-ile
of baseline data or 30% exceedance
of value at any impact station
compared with corresponding data
from control station |
|
Salinity in PSU (Depth-averaged) |
109% of baseline level or 9% exceedance of value at any impact station compared with corresponding data from control station |
110% of baseline level or 10% exceedance of value at any impact station compared with corresponding data from control station |
|
Iron in mg/L (Depth-averaged) |
0.3 mgL-1 |
0.3 mgL-1 |
|
Parameters |
Action |
Limit |
|
Construction Phase Impact
Monitoring |
||
|
DO in mg/L |
Surface and Middle |
Surface and Middle |
|
|
7.30
mg L-1 |
4 mg L-1 |
|
|
Bottom |
Bottom |
|
|
7.31 mg L-1 |
2 mg L-1 |
|
|
Tung Lung
Chau Fish Culture Zone |
Tung Lung
Chau Fish Culture Zone |
|
|
5.1 mgL-1 or level at control
station |
5.0 mgL-1 or level
at control station |
|
|
(whichever the lower) |
(whichever the lower) |
|
SS in mg/L |
5.00 mg L-1 or 20% exceedance of |
6.00 mg L-1 or 30%
exceedance of |
|
(Depth-averaged) |
value at any impact station |
value at any impact station |
|
|
compared with corresponding data |
compared
with corresponding data |
|
|
from control
station |
from control
station |
|
Turbidity in NTU |
2.41 NTU or 20% exceedance of |
2.84 NTU or 30%
exceedance of |
|
(Depth-averaged) |
value at any impact station |
value at any impact station |
|
|
compared with corresponding data |
compared
with corresponding data |
|
|
from control
station |
from control
station |
|
First-year Operation Phase Monitoring iv |
||
|
DO in mg/L |
Surface and Middle |
Surface and Middle |
|
|
7.30
mg L-1 |
4 mg L-1 |
|
|
Bottom |
Bottom |
|
|
7.31 mg L-1 |
2 mg L-1 |
|
|
Tung Lung
Chau Fish Culture Zone |
Tung Lung
Chau Fish Culture Zone |
|
|
5.1 mgL-1 or level at control
station |
5.0 mgL-1 or level
at control station |
|
|
(whichever the lower) |
(whichever the lower) |
|
SS in mg/L |
5.00 mg L-1 or 20% exceedance of |
6.00 mg L-1 or 30%
exceedance of |
|
(Depth-averaged) |
valueat any impact station |
value at any impact station |
|
|
compared with corresponding data |
compared
with corresponding data |
|
|
from control
station |
from control
station |
|
Turbidity in NTU (Depth-averaged) |
2.41 NTU or 20% exceedance of value at any impact
station compared with
corresponding data from control
station |
2.84 NTU or 30% exceedance of value at any impact
station compared with corresponding data from control
station |
|
Salinity in PSU (Depth-averaged) |
34.28 PSU or 9% exceedance of value at any impact
station compared with corresponding data from control station |
34.60 PSU or 10% exceedance of value
at any impact
station compared with corresponding data from control station |
|
Iron in mg/L (Depth-averaged) |
0.3 mgL-1 |
0.3 mgL-1 |
Notes:
i.
"Depth-averaged" is calculated by taking the arithmetic means
of reading of all
three depths.
ii.
For DO, non-compliance of the water
quality limits occurs
when monitoring result is lower than the limits.
iii.
For Turbidity, SS, iron and Salinity, non-compliance of the water quality limits
occurs when monitoring result is higher than the limits.
iv.
For the Action and Limit Levels adopted during First-year Operation Phase Monitoring, further review would be made according to the EM&A
Manual during Operation Phase.
3.3. MONITORING RESULTS AND OBSERVATIONS
General water quality monitoring at the ten monitoring stations (CE, CF, WSR1, WSR2, WSR3, WSR4, WSR16, WSR33, WSR36 and WSR37) were conducted on 1, 4, 6, 8, 11, 13, 15, 18, 20, 22, 25, 27, 29 and 31 January 2022.
Fifty-two (52) of the general water quality monitoring results of suspended solids (SS) obtained had exceeded the Action Level. Thirty-three (33) of the general water quality monitoring results of SS obtained during the reporting period had exceeded the Limit Level.
Details of the exceedance are presented in Appendix O.
Investigation on the reason
of exceedance has been carried out, where the exceedances of SS on1, 4, 6, 8, 11, 15, 18, 20, 22, 25, 27, 29 and 31 January
2022 were concluded to be unrelated
to the Contract as detailed in the Incident Reports on
Action Level or Limit Level Non-compliance along with supporting materials in Appendix O.
Monitoring results of 6 key parameters: Salinity, DO, turbidity, SS, pH and temperature in this reporting, are summarized in Table 3.6 and Table 3.7, and detailed results are presented in Appendix L.
|
Locations |
Parameters |
|||||||
|
Salinity (ppt) |
Dissolved Oxygen (mg/L) |
pH |
Turbidity (NTU) |
Suspended Solids (mg/L) |
Temp.(oC) |
|||
|
Surface & Middle |
Bottom |
|||||||
|
CE |
Avg. |
32.8 |
8.8 |
8.8 |
8.2 |
3.3 |
4.1 |
21.1 |
|
Min. |
30.1 |
8.1 |
8.1 |
8.0 |
2.3 |
2.5 |
19.7 |
|
|
Max. |
35.1 |
9.6 |
9.6 |
8.5 |
4.3 |
12.0 |
23.1 |
|
|
CF |
Avg. |
32.8 |
8.7 |
8.7 |
8.3 |
3.9 |
5.4 |
21.2 |
|
Min. |
30.3 |
8.2 |
8.2 |
8.0 |
2.2 |
2.5 |
20.1 |
|
|
Max. |
34.9 |
9.0 |
9.1 |
8.5 |
5.7 |
22.0 |
22.9 |
|
|
WSR1 |
Avg. |
32.8 |
8.7 |
8.6 |
8.2 |
2.7 |
4.4 |
21.1 |
|
Min. |
30.3 |
8.2 |
8.2 |
8.0 |
1.6 |
2.5 |
19.6 |
|
|
Max. |
35.0 |
9.4 |
9.4 |
8.5 |
4.0 |
8.0 |
22.7 |
|
|
WSR2 |
Avg. |
33.0 |
9.0 |
8.9 |
8.3 |
2.3 |
5.0 |
21.2 |
|
Min. |
31.1 |
8.3 |
8.4 |
8.0 |
1.5 |
2.5 |
19.7 |
|
|
Max. |
35.0 |
9.8 |
9.9 |
8.5 |
3.4 |
21.0 |
23.2 |
|
|
WSR3 |
Avg. |
32.4 |
8.7 |
8.7 |
8.3 |
2.7 |
6.5 |
23.5 |
|
Min. |
31.1 |
7.7 |
7.7 |
8.1 |
1.6 |
2.5 |
21.9 |
|
|
Max. |
33.3 |
9.4 |
9.4 |
8.5 |
4.6 |
23.0 |
25.8 |
|
|
WSR4 |
Avg. |
32.7 |
8.8 |
8.8 |
8.2 |
2.7 |
6.4 |
21.2 |
|
Min. |
30.6 |
8.3 |
8.0 |
8.0 |
1.8 |
2.5 |
20.0 |
|
|
Max. |
35.3 |
9.6 |
9.6 |
8.4 |
3.8 |
36.0 |
22.5 |
|
|
WSR16 |
Avg. |
32.2 |
8.8 |
8.8 |
8.3 |
2.9 |
6.4 |
23.6 |
|
Min. |
31.0 |
8.1 |
8.0 |
8.1 |
1.7 |
3.0 |
22.0 |
|
|
Max. |
33.8 |
9.5 |
9.5 |
8.5 |
4.3 |
26.0 |
25.6 |
|
|
WSR33 |
Avg. |
32.7 |
8.6 |
8.6 |
8.3 |
2.9 |
4.3 |
21.1 |
|
Min. |
30.6 |
8.0 |
8.0 |
8.0 |
1.8 |
2.5 |
19.9 |
|
|
Max. |
34.3 |
9.0 |
9.1 |
8.5 |
4.3 |
8.0 |
22.6 |
|
|
WSR36 |
Avg. |
32.7 |
8.9 |
8.8 |
8.3 |
2.7 |
4.9 |
21.1 |
|
Min. |
30.9 |
8.3 |
8.2 |
8.1 |
1.3 |
2.5 |
19.9 |
|
|
Max. |
35.2 |
9.7 |
9.8 |
8.5 |
4.0 |
13.0 |
22.6 |
|
|
WSR37 |
Avg. |
32.8 |
8.8 |
8.8 |
8.3 |
2.8 |
5.3 |
21.1 |
|
Min. |
30.6 |
8.3 |
8.3 |
8.0 |
1.8 |
2.5 |
19.8 |
|
|
Max. |
35.2 |
9.8 |
9.7 |
8.5 |
4.4 |
23.0 |
22.8 |
|
Notes:
i.
"Avg", ��Min�� and ��Max�� is the average,
minimum and maximum respectively of the data from measurements conducted under mid-flood and mid-ebb tides at three water
depths, except that of DO where the data for ��Surface & Middle�� and
��Bottom�� are calculated separately.
ii.
Measurement data of Suspending Solids would be
rounding to 2.5mg/L if the value was less than 2.5mg/L to facilitate data analysing.
|
Locations |
Parameters |
|||||||
|
Salinity (ppt) |
Dissolved Oxygen (mg/L) |
pH |
Turbidity (NTU) |
Suspended Solids (mg/L) |
Temp.(oC) |
|||
|
Surface & Middle |
Bottom |
|||||||
|
CE |
Avg. |
32.8 |
8.7 |
8.7 |
8.2 |
3.9 |
4.7 |
21.2 |
|
Min. |
30.9 |
7.9 |
7.9 |
8.1 |
2.8 |
2.5 |
19.8 |
|
|
Max. |
34.8 |
9.8 |
9.7 |
8.4 |
5.2 |
11.0 |
22.8 |
|
|
CF |
Avg. |
32.6 |
8.6 |
8.6 |
8.2 |
3.3 |
5.2 |
21.2 |
|
Min. |
30.6 |
7.9 |
7.9 |
8.0 |
2.3 |
2.5 |
20.2 |
|
|
Max. |
34.4 |
9.4 |
9.4 |
8.5 |
4.7 |
17.0 |
22.9 |
|
|
WSR1 |
Avg. |
32.9 |
8.6 |
8.6 |
8.2 |
2.8 |
5.4 |
21.2 |
|
Min. |
30.1 |
8.1 |
8.1 |
7.9 |
1.6 |
2.5 |
19.8 |
|
|
Max. |
35.1 |
9.3 |
9.3 |
8.4 |
4.1 |
13.0 |
23.0 |
|
|
WSR2 |
Avg. |
32.8 |
8.7 |
8.7 |
8.3 |
2.4 |
4.5 |
21.1 |
|
Min. |
30.5 |
8.0 |
8.1 |
8.0 |
1.5 |
2.5 |
19.8 |
|
|
Max. |
34.6 |
9.2 |
9.2 |
8.5 |
3.8 |
8.0 |
22.9 |
|
|
WSR3 |
Avg. |
32.6 |
8.7 |
8.7 |
8.2 |
2.8 |
5.2 |
21.1 |
|
Min. |
29.9 |
8.2 |
8.3 |
7.9 |
1.4 |
2.5 |
20.1 |
|
|
Max. |
34.6 |
9.6 |
9.6 |
8.4 |
4.5 |
20.0 |
22.9 |
|
|
WSR4 |
Avg. |
32.7 |
8.8 |
8.8 |
8.2 |
2.8 |
5.8 |
21.2 |
|
Min. |
30.3 |
8.1 |
8.1 |
8.0 |
1.6 |
2.5 |
19.9 |
|
|
Max. |
34.8 |
9.7 |
9.7 |
8.5 |
4.4 |
28.0 |
23.5 |
|
|
WSR16 |
Avg. |
32.9 |
8.7 |
8.7 |
8.3 |
2.8 |
4.9 |
21.1 |
|
Min. |
30.0 |
7.9 |
8.0 |
7.9 |
1.8 |
2.5 |
19.8 |
|
|
Max. |
34.8 |
9.4 |
9.3 |
8.4 |
4.0 |
13.0 |
23.0 |
|
|
WSR33 |
Avg. |
32.7 |
8.6 |
8.7 |
8.2 |
2.7 |
5.5 |
21.2 |
|
Min. |
30.4 |
8.1 |
8.0 |
7.9 |
1.8 |
2.5 |
19.9 |
|
|
Max. |
34.3 |
9.4 |
9.3 |
8.4 |
4.2 |
16.0 |
23.3 |
|
|
WSR36 |
Avg. |
32.7 |
8.5 |
8.5 |
8.2 |
2.9 |
4.5 |
21.2 |
|
Min. |
29.9 |
8.1 |
8.1 |
7.9 |
1.8 |
2.5 |
19.8 |
|
|
Max. |
34.7 |
9.0 |
9.0 |
8.4 |
4.0 |
9.0 |
23.1 |
|
|
WSR37 |
Avg. |
32.7 |
8.7 |
8.7 |
8.2 |
2.9 |
5.3 |
21.2 |
|
Min. |
30.1 |
8.0 |
7.9 |
7.9 |
1.6 |
2.5 |
20.0 |
|
|
Max. |
34.3 |
9.3 |
9.3 |
8.4 |
4.0 |
27.0 |
23.4 |
|
Notes:
i.
"Avg", ��Min�� and ��Max�� is the average,
minimum and maximum respectively of the data from measurements conducted under mid-flood and mid-ebb tides at three water
depths, except that of DO where the data for ��Surface & Middle�� and
��Bottom�� are calculated separately.
ii.
Measurement data of Suspending Solids would be rounding
to 2.5mg/L if the value was less than 2.5mg/L to facilitate data analysing.
The waste generated from
this Contract includes inert construction and demolition (C&D) materials,
and non-inert C&D materials. Non- inert C&D
materials are made up of general refuse, vegetative wastes
and recyclable wastes
such as plastics
and paper/cardboard packaging
waste. Steel materials generated from the Contract are also grouped into
non-inert C&D materials as the materials were not disposed of with other inert C&D materials. With reference to relevant handling
records and trip tickets of this Contract,
the quantities of different types of
waste generated in the reporting month are summarised in Table 4.1. Details of cumulative waste management data are presented
as a waste flow table in Appendix
H.
|
Reporting Month |
Actual Quantities of Inert
C&D Materials Generated Monthly |
Actual Quantities of C&D Wastes Generated Monthly |
|||||||||
|
Total Quantity Generated |
Hard Rock
and
Large Broken Concrete |
Reused in the Contract |
Reused in other
Projects |
Disposed
as
Public Fill |
Imported Fill |
Metals |
Paper
/ cardboard packaging |
Plastics (see Note) |
Chemical Waste |
Others, e.g. general refuse |
|
|
(in
,000kg) |
(in
,000kg) |
(in
,000kg) |
(in
,000kg) |
(in
,000kg) |
(in
,000kg) |
(in
,000kg) |
(in
,000kg) |
(in
,000kg) |
(in
,000kg) |
(in
,000kg) |
|
|
January 2022* |
233.850 |
0 |
0 |
0 |
233.850 |
0 |
0 |
0.069 |
0.005 |
0 |
109.02 |
Notes: (1) Plastics
refer to plastic
bottles / containers, plastic sheets / foam from packaging material
* The data may be updated
in the next reporting month after final confirmation by the end of the month.
5.1. MONITORING REQUIREMENT
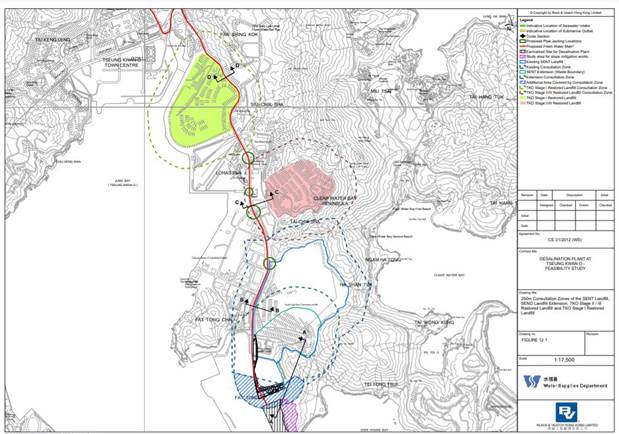
In accordance with Section 11 of the EM&A Manual, monitoring of landfill gas is required for construction works within the 250m Consultation Zone. Part of the desalination plant and the indicative area of natural slope mitigation works fall within the SENT Landfill Extension Consultation Zone; and part of the 1,200 mm diameter fresh water mains along Wan Po Road falls within the SENT Landfill and SENT Landfill Extension Consultation Zones, TKO Stage II/III Restored Landfill and TKO Stage I Restored Landfill Consultation Zones.
5.2. MONITORING LOCATION
Monitoring of oxygen, methane, carbon dioxide and barometric pressure would be performed for excavations at 1m depth or more within the consultation Zone.
During construction of works within the consultation zones, excavations of 1m depth or more was monitored:
- At the ground surface before excavation commences;
- Immediately before any worker enters the excavation;
- At the beginning of each working day for the entire period the excavation remains open; and
- Periodically through the working day whilst workers are in the excavation.
For excavations between 300mm and 1m deep, measurements should be carried out:
- Directly after the excavation has been completed; and
- Periodically whilst the excavation remains open.
5.3. MONITORING PROGRAMME
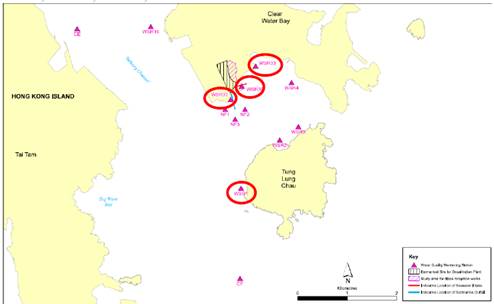
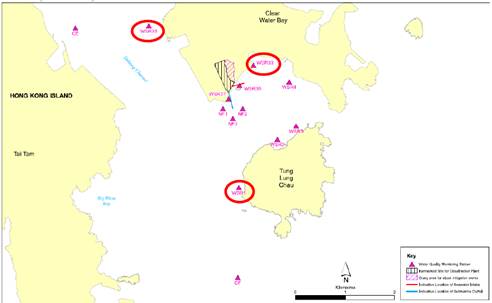
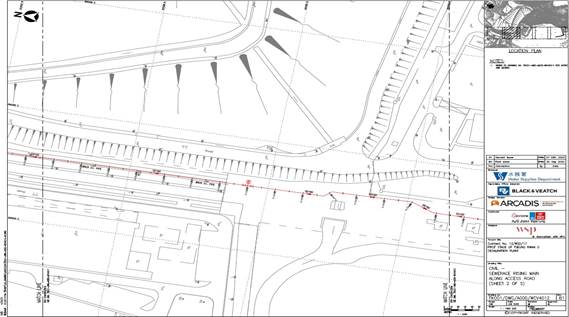
Since part of the desalination plant (Wan Po Road and MIC compound/Basketball Court) and the indicative area of natural slope mitigation works fall within the SENT Landfill Extension Consultation Zone in this contract (Figure 5.1), landfill gas monitoring would be required for Wan Po Road and MIC compound/Basketball Court (Figure 5.2) if excavations were conducted at more than 300mm deep. Although SENT Landfill Extension has commenced operation since November 2021, no excavation works were conducted at MIC compound/Basketball Court. Hence no landfill gas monitoring would be scheduled for MIC compound/Basketball Court at the current stage. In this reporting period, 47 time of landfill gas monitoring was recorded at Wan Po Road (Ch1+360 - Ch1+513). No exceedance of action and limit levels for oxygen, methane and carbon dioxide was observed. Monitoring was conducted during excavations at 1m depth or more within the consultation zone and whenever workers entered the excavation on the day.
5.4. MONITORING LOCATION
The area required to be monitored for landfill gas in the reporting period is shown in Figure 5.2.
5.5. MONITORING PARAMETERS
LFG monitoring was carried out to identify any migration between the landfill and the Contract and to ensure the safety of the construction, operation and maintenance personnel working on-site, visitors and any other person within the Contract area.
The following parameters were monitored:
- Methane
- Oxygen
- Carbon Dioxide
- Barometric Pressure
Action and Limit Level are provided in Table 5.1.
|
Parameters |
Action Level |
Limit Level |
|
Oxygen (O2) |
<19% O2 |
<19% O2 |
|
Methane (CH4) |
>10% LEL |
>80% LEL |
|
Carbon Dioxide
(CO2) |
>0.5% CO2 |
>1.5% CO2 |
5.6.
MONITORING EQUIPMENT
Landfill Gas monitoring was carried out using intrinsically-safe, portable multi-gas monitoring instruments. The gas monitoring equipment is:
- Complying with the Landfill Gas Hazard Assessment Guidance Note as intrinsically safe;
- Capable of continuous barometric pressure and gas pressure measurements;
- Normally operated in diffusion mode unless required for spot sampling, when it should be capable of operating by means of an aspirator or pump;
- Having low battery, fault and over range indication incorporated;
- Capable of storing monitoring data, and shall be capable of being downloaded directly;
- Measure in the following ranges:
|
methane |
0-100% LOWER EXPLOSION LIMIT (LEL) AND 0- 100% V/V; |
|
oxygen |
0-25% V/V; |
|
carbon dioxide |
0-5% v/v;
and |
|
barometric pressure |
mBar (absolute) |
- alarm (both audibly and visually) in the event that the concentrations of the following are exceeded:
|
methane |
>10% LEL; |
|
oxygen |
<19% |
|
carbon dioxide |
>0.5% by volume |
|
barometric pressure |
mBar (absolute) |
5.7. MONITORING RESULTS AND OBSERVATIONS
In this reporting period, 47 time of landfill gas monitoring was recorded at Wan Po Road (Ch1+360 - Ch1+513). No exceedance of action and limit levels for methane, oxygen and carbon dioxide was observed. Monitoring was conducted during excavations at 1m depth or more within the consultation zone and whenever workers entered the excavation on the day.
6.
SUMMARY OF MONITORING EXCEEDANCE, COMPLAINTS, NOTIFICATION OF SUMMONS AND PROSECUTIONS
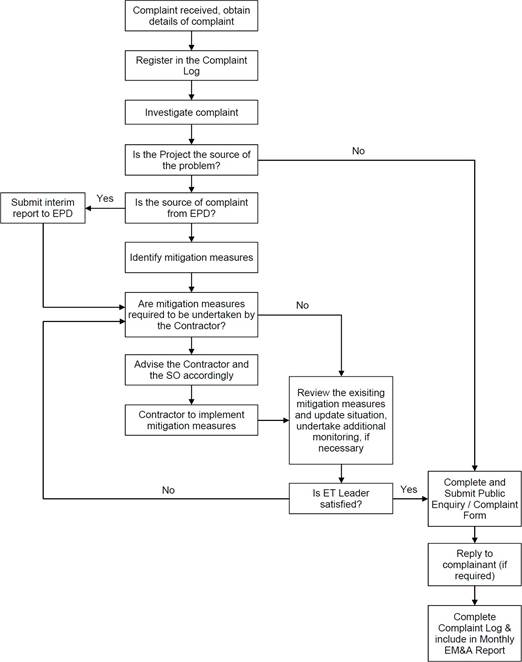
The Environmental Complaint Handling Procedure
is shown in below Figure 6.1:
No noise monitoring was conducted during the reporting period since there are no Contract-related construction activities undertaken within a radius of 300m from the monitoring locations.
General water quality monitoring at the ten monitoring stations (CE, CF, WSR1, WSR2, WSR3, WSR4, WSR16, WSR33, WSR36 and WSR37) were conducted on 1, 4, 6, 8, 11, 13, 15, 18, 20, 22, 25, 27, 29 and 31 January 2022.
Fifty-two (52) of the general water quality monitoring results of suspended solids (SS) obtained had exceeded the Action Level. Thirty-three (33) of the general water quality monitoring results of SS obtained during the reporting period had exceeded the Limit Level.
Details of the exceedance are presented in Appendix O.
Investigation on the reason
of exceedance has been carried
out, where the exceedances of SS on 1, 4, 6, 8, 11, 15, 18, 20, 22, 25, 27, 29 and 31 January
2022 were concluded to be unrelated to the Contract
as detailed in the Incident Reports on Action Level or Limit Level Non-compliance along with supporting materials in Appendix O.
In this reporting period, 47 time of landfill gas monitoring was recorded at Wan Po Road (Ch1+360 - Ch1+513). No exceedance of action and limit levels for methane, oxygen and carbon dioxide was observed. Monitoring was conducted during excavations at 1m depth or more within the consultation zone and whenever workers entered the excavation on the day.
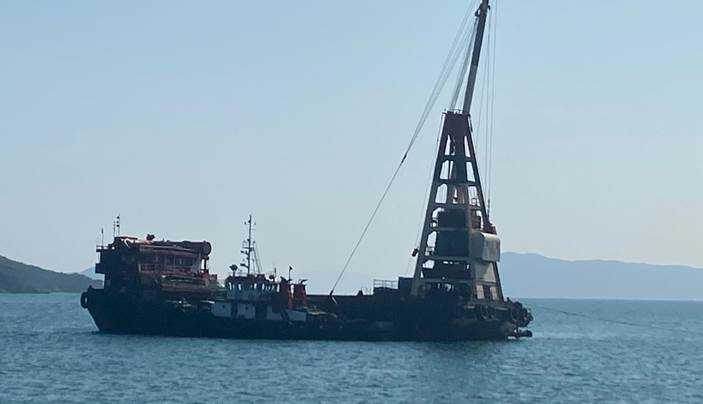
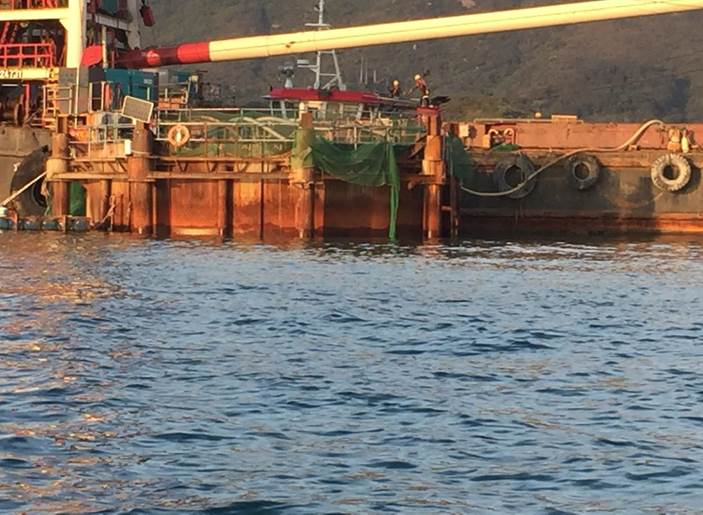
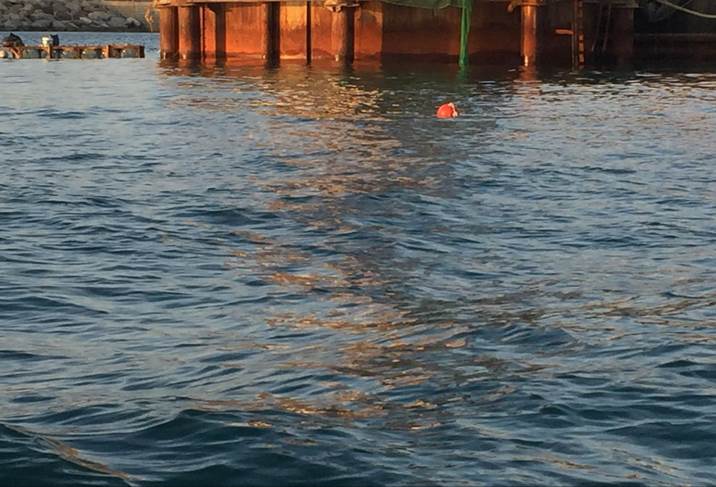
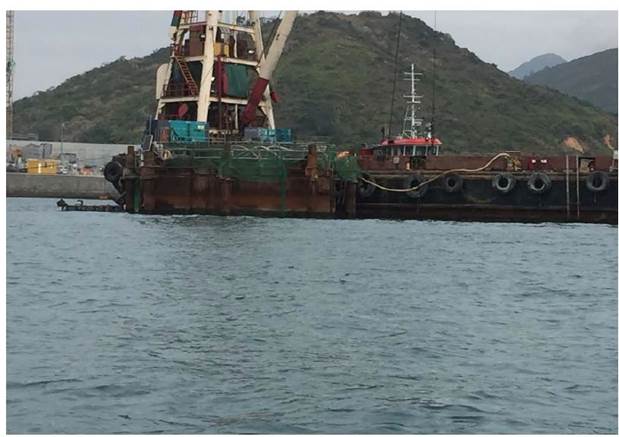
ACJCJ��s Environmental Office received a text message on 14 January 2022 from EPD inspector claiming that susceptible oil spillage at the water surface nearby to Outfall Shaft was observed during their routine drone check on 13 January 2022. The message from EPD was relayed to ET by AJCJV on 15 January 2022. Immediate investigation by AJCJV has been made after the acknowledgement of the incident, whilst implementing emergency clean up measure on any residue oil spillage. After investigation, the oil spillage was unlikely originated from the Outfall Shaft. The incident may therefore be considered as non-project related. Detail of the incident could be referring to Appendix O.
Moreover, oil stains were also observed at CEDD pier after leaving of Explosives Vessel on 28 January 2022 by Supervising Officer��s Representative (SOR) during site inspection. ET will keep closely monitoring the performance of Contractor, implementation of water quality mitigation measure and other contamination issue around the Project site, to ensure the EM&A requirement is properly implemented.
No notification of summons
and prosecution was received in the reporting period. Statistics on complaints and regulatory compliance are summarized in Appendix
J.
Site inspections were carried out on a weekly basis to monitor the implementation of proper environmental pollution control and mitigation measures under the Contract. In the reporting period, site inspections were carried out on 4, 11, 18, 26 and 31 January 2022 at the site portions listed in Table 7.1 below.
|
Date |
Inspected Site Portion |
Time |
|
4 January 2022 |
TKO
137 |
14:35
- 17:00 |
|
11
January 2022 |
TKO
137 |
14:38
- 17:00 |
|
18 January 2022 |
TKO
137 |
14:30
- 17:15 |
|
26 January 2022 |
TKO
137 |
09:00
- 12:30 |
|
31 January 2022 |
TKO
137 |
09:30
- 10:38 |
Joint site inspections with IEC were carried out on 4, 11, 18, 26 and 31 January 2022.
Environmental deficiencies were observed during weekly site inspection. Key observations during the site inspections and during the reporting period are summarized in Table 7.2.
|
Date |
Environmental Observations |
Follow-up Status |
|
4 January 2022 |
No major
observations were recorded on the reporting day. |
Nil. |
|
11 January
2022 |
No major
observations were recorded on the reporting day. |
Nil. |
|
18
January 2022 |
Observation(s) and Recommendation(s) 1. It has been observed during the site inspection on 18 January 2022 that there
is a new sources of underground seepage marine water in the outfall shaft caisson that was not by-pass through
an uncontaminated isolation system. The main contractor was urged to take immediate remediate action to ensure the seepage marine
water should be contained in an isolation system before by-pass through
a silt curtain. |
1.
The seepage water
is separated. |
|
26 January
2022 |
Observation(s) and Recommendation(s) 1.
The main contractor was reminded that
all chemical containers should be placed in drip tray (VTEC Area, Product water Storage Area and Reverse Osmosis Area) & chemical waste should be stored in appropriate chemical waste container at reverse osmosis
area. |
1. Chemical moved to proper storage area. |
|
31
January 2022 |
No major
observations were recorded on the reporting day. |
Nil |
According to the EIA Study
Report, Environmental Permit, contract documents and EM&A Manual, the mitigation measures detailed in the
documents should be implemented as much as practical during the reporting
period. An updated
Implementation Status of Environmental Mitigation Measures (EMIS) is provided in Appendix C. Site inspection proforma of the reporting period is provided
in Appendix I.
Works to be undertaken in the next reporting month are:
- Land Survey;
- Construction of solar panel supports at roof of ActiDAFF;
- Construction of Reverse Osmosis (RO) Building - staircases and internal finishing;
- Construction of sludge thickener, Post treatment building (PTB);
- Construction of On-Site Chlorine Generation (OSCG) Building and carbon dioxide (CO2) Tank area;
- Internal finishing work at Product Water Storage Tank (PWST), Electrical Building and Main Electrical (elec), Building and Central Chiller Plant Building (MECCP);
- Manhole construction and Glass Reinforced Plastic (GRP) pipe installation;
- Construction of manholes no,15 and no.16 adjacent to ActiDAFF and RO;
- Construction of 1/F to 2/F walls and columns of Administration Building;
- Construction of reinforced concrete (RC) support of Inspection Corridor;
- Construction of structural wall and Roof of Chemical Building;
- Outfall Shaft - Dewatering; Predrill, Rock cutting and excavations;
- Intake shaft - Retrieval of DN 2500 Tunnel Boring Machine (TBM) under water;
- Pipe jacking at Combined Shaft for Outfall pipelines; and
- Intake tunnel - Demobilize the jack pipe system and commencement of grouting works.
The major environmental impacts brought by the above construction works will include:
- Construction dust and noise generation from construction pipe piling driving works, breaking rock surface, excavation works and marine construction works
- Waste generation from construction activities
- Impact on water quality from marine construction works and inland construction works
The key environmental mitigation measures for the Project in the coming reporting period associated with the above construction works will include:
- Dust suppression by regular wetting and water spraying for construction works
- Reduction of noise from equipment and machinery on-site by regular checking of on-site plant/vehicle to ensure proper functioning
- Sorting and storage of general refuse and construction waste
- Deployment of temporary silt curtain in the area where marine construction works were conducted and deployment of water sedimentation tanks for treatment of wastewater at inland and marine areas before discharge
Referring to EM&A Manual Section 4.1.2, the impact noise monitoring should be carried out at all the designated monitoring stations when there are project-related construction activities undertaken within a radius of 300m from the monitoring stations.
The impact noise monitoring schedule for the next reporting month to be shown at Appendix K is not included since no impact noise monitoring will be conducted in the next reporting month.
This is the 23rd Monthly EM&A Report for the Project which summarizes the key findings of the EM&A programme during the reporting period from 1 January to 31 January 2022, in accordance with the EM&A Manual and the requirement under FEP-01/503/2015/A.
No noise monitoring was conducted in the reporting period due to the over distant monitoring station from the works location, in which construction activities were not undertaken within a radius of 300m from the monitoring locations.
The EM&A works for water quality were conducted during the reporting period in accordance with the EM&A Manual.
Fifty-two (52) of the general water quality monitoring results of suspended solids (SS) obtained had exceeded the Action Level. Thirty-three (33) of the general water quality monitoring results of SS obtained during the reporting period had exceeded the Limit Level.
Details of the exceedance are presented in Appendix O.
Investigation on the reason
of exceedance has been carried
out, where the exceedances of SS on 1, 4, 6, 8, 11, 15, 18, 20, 22, 25, 27, 29 and 31 January
2022 were concluded to be unrelated to the Contract
as detailed in the Incident Reports on Action Level or Limit Level Non-compliance along with supporting materials in Appendix O.
It was concluded that all exceedances recorded in January were unrelated to the project.
In this reporting period, 47 time of landfill gas monitoring was recorded at Wan Po Road (Ch1+360 - Ch1+513). No exceedance of action and limit levels for methane, oxygen and carbon dioxide was observed. Monitoring was conducted during excavations at 1m depth or more within the consultation zone and whenever workers entered the excavation on the day.
ACJCJ��s Environmental Office received a text message on 14 January 2022 from EPD inspector claiming that susceptible oil spillage at the water surface nearby to Outfall Shaft was observed during their routine drone check on 13 January 2022. The message from EPD was relayed to ET by AJCJV on 15 January 2022. Immediate investigation by AJCJV has been made after the acknowledgement of the incident, whilst implementing emergency clean up measure on any residue oil spillage. After investigation, the oil spillage was unlikely originated from the Outfall Shaft. The incident may therefore be considered as non-project related. Detail of the incident could be referring to Appendix O.
Moreover, oil stains were also observed at CEDD pier after leaving of Explosives Vessel on 28 January 2022 by Supervising Officer��s Representative (SOR) during site inspection. ET will keep closely monitoring the performance of Contractor, implementation of water quality mitigation measure and other contamination issue around the Project site, to ensure the EM&A requirement is properly implemented.
Weekly environmental site inspection was conducted during the reporting period. No major deficiency was observed during site inspection. The environmental performance of the project was therefore considered satisfactory.
According to the environmental site inspections performed in the reporting month, the Contractor is reminded to pay attention on maintaining proper materials storage, site hygiene and dust suppression mitigation measures.
No environmental complaint was received in the reporting period.
No notification of summons or prosecution was received since commencement of the Contract.
The ET will keep track on the construction works to confirm compliance of environmental requirements and the proper implementation of all necessary mitigation measures.
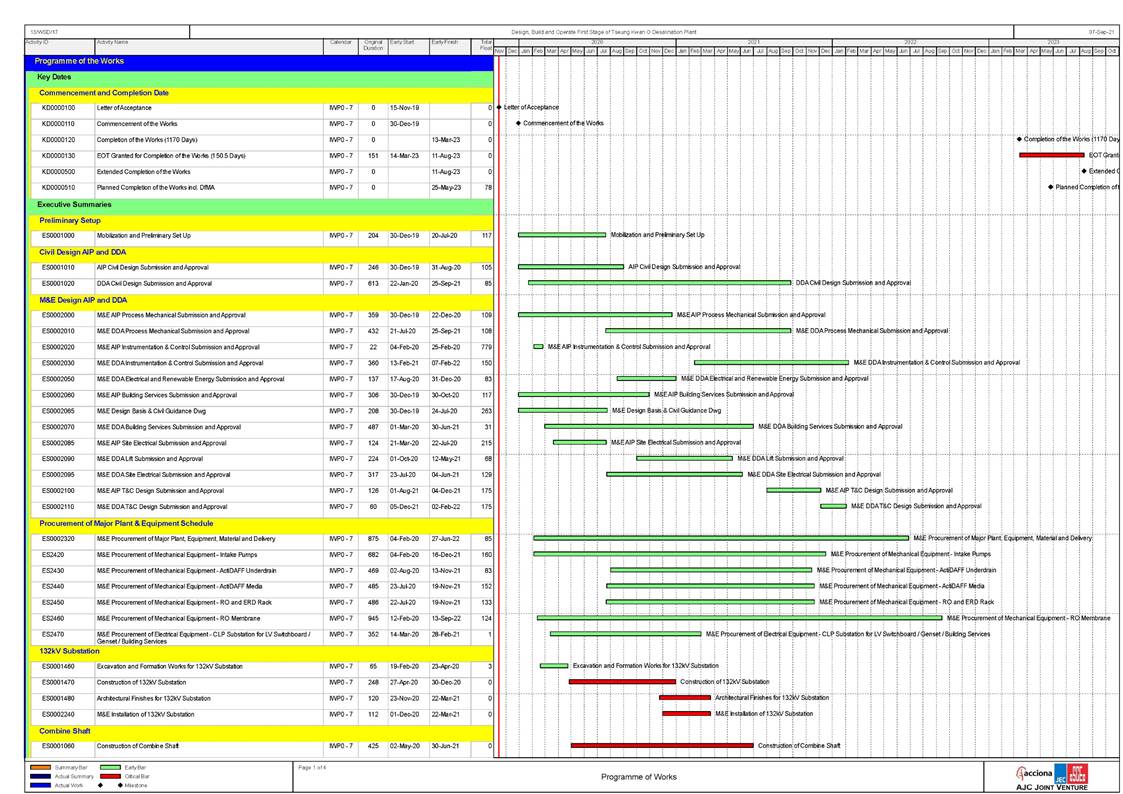
Appendix A
Master Programme
Appendix B
Overview of
Desalination Plant in Tseung Kwan O
Appendix C
Summary of
Implementation Status of Environmental Mitigation
|
EIA Reference |
Recommended Environmental Protection Measures/ Mitigation Measures |
Objectives of the recommended
measures & main
concerns to address |
Implementation Agent |
Implementation Stage |
Implementation status |
Relevant Legislation & Guidelines |
||
|
D |
C |
O |
||||||
|
Air Quality |
|
|||||||
|
S4.8.1 |
Impervious
dust screen or sheeting will be provided to
enclose scaffolding from the ground floor level of building for construction of superstructure of the new buildings. |
Land site/ During Construction |
Contractor(s) |
|
ü |
|
Implemented |
Air
Pollution Control (Construction Dust) |
|
S4.8.1 |
Impervious sheet will be provided for skip hoist for material
transport. |
Land site/ During Construction,
particularly dry
season |
Contractor(s) |
|
ü |
|
NA |
|
|
S4.8.1 |
The area where dusty work takes place should be sprayed with water or a dust suppression chemical immediately prior to, during
and immediately after
dusty activities as far as practicable. |
Land site/ During Construction |
Contractor(s) |
|
ü |
|
Implemented |
|
|
S4.8.1 |
All
dusty materials should be sprayed with water or a dust suppression chemical immediately prior to any loading, unloading or transfer operation. |
Land site/ During Construction |
Contractor(s) |
|
ü |
|
Implemented |
|
|
S4.8.1 |
Dropping
heights for excavated materials should be controlled to a practical
height to minimize the fugitive dust arising from unloading. |
Land site/ During Construction |
Contractor(s) |
|
ü |
|
Implemented |
|
|
S4.8.1 |
During transportation by truck, materials should not be loaded to a level higher than the side and
tail boards, and should be dampened or covered before
transport. |
Land site/ During Construction |
Contractor(s) |
|
ü |
|
Implemented |
|
|
S4.8.1 |
Wheel washing device should be provided at the exits of the work sites. Immediately before leaving
a construction site,
every vehicle shall be
washed to remove any dusty material
from its body and
wheels as far as practicable. |
Land site/ During Construction |
Contractor(s) |
|
ü |
|
Implemented |
|
|
S4.8.1 |
Road sections between vehicle-wash areas and vehicular entrance will be paved. |
Land site/ During Construction |
Contractor(s) |
|
ü |
|
Implemented |
|
|
S4.8.1 |
Hoarding of not less than 2.4m high from ground level
will be provided along the length
of the Project Site boundary. |
Land site/ During construction |
Contractor(s) |
ü |
ü |
|
N/A |
|
|
S4.8.1 |
Haul
roads will be kept clear of dusty materials and will be sprayed with water so as to maintain the
entire road surface wet at all times. |
Land site/ During construction |
Contractor(s) |
|
ü |
|
Implemented |
|
|
EIA Reference |
Recommended Environmental Protection Measures/ Mitigation Measures |
Objectives of the recommended
measures & main
concerns to address |
Implementation Agent |
Implementation Stage |
Implementation status |
Relevant Legislation & Guidelines |
||
|
D |
C |
O |
||||||
|
S4.8.1 |
Temporary
stockpiles of dusty materials will be either
covered entirely by impervious sheets
or sprayed with
water to maintain the entire surface wet all the
time. |
Land site/ During construction |
Contractor(s) |
|
ü |
|
Implemented |
|
|
S4.8.1 |
Stockpiles of more than 20 bags of cement, dry pulverised
fuel ash and dusty construction
materials will be covered entirely by impervious sheeting sheltered on top
and 3-sides. |
Land site/ During construction |
Contractor(s) |
|
ü |
|
N/A |
|
|
S4.8.1 |
All exposed areas
will be kept
wet always to minimise dust
emission. |
Land site/ During construction |
Contractor(s) |
|
ü |
|
Implemented |
|
|
S4.8.1 |
Ultra-low-sulphur diesel
(ULSD) will be used for
all
construction plant
on-site, as defined as diesel fuel containing
not more than 0.005% sulphur
by weight) as stipulated in Environment, Transport and Works Bureau
Technical Circular (ETWB-TC(W)) No 19/2005 on
Environmental Management on Construction Sites. |
Land site/ During construction/ During Operation |
Contractor(s) |
|
ü |
ü |
Implemented |
Environment, Transport and Works Bureau Technical Circular (ETWB-
TC(W)) No 19/2005 on Environmental Management on Construction Sites |
|
S4.8.1 |
The engine of the construction equipment during idling will be
switched off. |
Land site/ During construction |
Contractor(s) |
|
ü |
|
Implemented |
|
|
S4.8.1 |
Concrete batching
plant will be required on site. control measures recommended in the Guidance Note on a Best Practicable Means for Cement Works (Concrete Batching Plant) (BPM 3/2 (93)) will be implemented.
The control measures recommended
in the Guidance Note on a Best Practicable Means for Cement
Works (Concrete Batching Plant) (BPM 3/2
(93)) will be implemented. |
Land site/ During construction |
Contractor(s) |
|
ü |
|
N/A |
|
|
S4.8.1 |
Regular
maintenance of construction equipment deployed on-
site will be conducted
to prevent black
smoke emission. |
Land site/ During construction |
Contractor(s) |
|
ü |
|
Implemented |
|
|
S4.10 |
To ensure
proper implementation of the recommended dust mitigation
measures and good construction site practices
during the construction phase, environmental site audits on weekly basis is recommended throughout the construction period. |
Land site/ During construction |
Contractor(s)/ Environmental
Team (ET) & Independent Environmental Checker (IEC) |
|
ü |
|
Implemented |
|
Note: D -
Design stage C - Construction O - Operation
|
EIA Reference |
Recommended Environmental Protection Measures/ Mitigation Measures |
Objectives of the recommended measures & main concerns to address |
Implementation Agent |
Implementation Stage |
Implementation status |
Relevant Legislation & Guidelines |
||
|
D |
C |
O |
||||||
|
Noise |
||||||||
|
S5.7 |
Only well-maintained plant will be operated on-site and plant will be serviced regularly during the construction phase. |
All area/ During construction |
Contractor(s) |
|
ü |
|
Implemented |
A
Practical Guide for the Reduction of Noise from Construction Works, |
|
S5.7 |
Silencers or mufflers on construction equipment will be utilised and will be properly maintained during the construction phase. |
Noise control/ During construction |
Contractor(s) |
|
ü |
|
N/A |
A Practical Guide for the Reduction of Noise from
Construction Works, |
|
S5.7 |
Mobile plant, if any, will be sited as far away from NSRs as possible. |
Noise control/ During
construction |
Contractor(s) |
|
ü |
|
N/A |
A
Practical Guide for the Reduction of Noise from
Construction Works, |
|
S5.7 |
Machines
and plant (such as trucks) that may be in intermittent use will be shut down between work
periods or will be throttled down to a minimum. |
Noise control/ During
construction |
Contractor(s) |
|
ü |
|
Implemented |
A
Practical Guide for the Reduction
of Noise from Construction Works, |
|
S5.7 |
Plants known
to emit noise
strongly in one direction will,
wherever possible, be orientated so that the noise is directed away from the nearby NSRs. |
Noise control/ During
construction |
Contractor(s) |
|
ü |
|
N/A |
A
Practical Guide for the Reduction
of Noise from Construction Works, |
|
S5.7 |
Material stockpiles and other structures will be effectively utilised, wherever practicable, in screening noise from on-site construction activities. |
Noise control/ During
construction |
Contractor(s) |
|
ü |
|
N/A |
A
Practical Guide for the Reduction
of Noise from Construction Works, |
|
S5.7 |
Use of Quite Powered Mechanical Equipment (QPME). |
Noise control/ During
construction |
Contractor(s) |
|
ü |
|
Implemented |
A
Practical Guide for the Reduction
of Noise from Construction Works, |
|
S5.7 |
Movable
noise barriers of 3m in height with skid footing
should be used and located within a
few metres of stationary plant and mobile plant such that the line of sight to the NSR is blocked
by the barriers. The length of the barrier should
be at least
five times greater than its height. The noise
barrier material should have a superficial surface density of at least
7 kg m-2 and have no o or gappeningss. |
Noise control/ During
construction |
Contractor(s) |
|
ü |
|
N/A |
A
Practical Guide for the Reduction
of Noise from Construction Works, |
|
S5.7 |
The
noise insulating sheet should be deployed such that there
would be no opening or gaps on the joints. |
Noise control/ During
construction |
Contractor(s) |
|
ü |
|
N/A |
A Practical Guide for the Reduction of Noise from Construction Works, |
|
S5.7 |
Construction activities (e.g. excavation/shoring, reinstatement |
Noise control/ |
Contractor(s) |
ü |
ü |
|
Implemented |
A Practical Guide for |
|
EIA Reference |
Recommended Environmental Protection Measures/ Mitigation Measures |
Objectives of the recommended measures & main concerns to address |
Implementation Agent |
Implementation Stage |
Implementation status |
Relevant Legislation & Guidelines |
||
|
D |
C |
O |
||||||
|
|
(asphalt), and pipe jacking) will be planned
and carried out in sequence, such that items of PME proposed for these activities will not be operated simultaneously. |
During construction |
|
|
|
|
|
the Reduction of Noise from Construction Works |
|
S5.7 |
PMEs will not be used at the works areas
near educational institutions with residual impact (ie
the ��influence area�� within a radius of 40m) during
school hours in order to reduce impact
to the
educational institutions. |
Noise control / During construction |
Contractor(s) |
|
ü |
|
N/A |
A Practical Guide for
the Reduction of Noise
from Construction Works |
|
S5.7 |
Noise enclosures or acoustic sheds
would be used to cover
stationary PME such
as generators. Portable/Movable noise enclosure made of material with superficial
surface density of at least 7 kg m-2 may
be used for screening the noise from operation
of the saw/groover, concrete. |
Noise control/ Pre- construction/ During construction |
Contractor(s) |
ü |
ü |
|
N/A |
|
|
S5.9 |
Sawcutting pavement, breaking up of pavement, excavation /shoring, pipe laying, backfilling, reinstatement (concrete) and pipe jacking
shall be scheduled outside the examination period. |
Noise control/ Pre- construction/ During construction |
Contractor(s) |
ü |
ü |
|
N/A |
|
|
S5.9 |
In view the duration of noise exceedance at Creative Secondary School, PLK Laws Foundation College, TKO Kei Tak Primary School
and School of Continuing and Professional Studies-CUHK is limited to 8 weeks, the
construction work in the influence areas near the four schools shall be scheduled during long school holidays (eg summer holiday, Easter
holiday or Christmas holiday, etc) as far as practicable. Scheduling the
construction work for the four
schools. |
Noise control/ Pre- construction/
During construction |
Contractor(s) |
ü |
ü |
|
N/A |
|
|
S5.10 |
A
noise monitoring programme shall be implemented for the construction phase. |
Designated monitoring stations as defined in EM&A Manual/During construction phase |
Environmental Team (ET) |
|
ü |
|
N/A |
|
|
S5.10 |
The
effectiveness of on-site
control measures could also be evaluated through the regular site
audits. |
All facilities/ During construction |
Contractor(s)/ Environmental
Team (ET) & Independent Environmental Checker (IEC) |
|
ü |
|
Implemented |
- |
Note: D -
Design stage C - Construction O - Operation
|
EIA Reference |
Recommended
Environmental Protection Measures/ Mitigation Measures |
Objectives of the recommended measures
& main concerns to address |
Implementation Agent |
Implementation Stage |
Implementation status |
Relevant Legislation & Guidelines |
||
|
D |
C |
O |
||||||
|
Water Quality |
||||||||
|
S6.9 |
Dredged marine
sediment will be disposed of in a gazetted
marine disposal area in accordance with marine dumping permit conditions of the Dumping
at Sea Ordinance (DASO). |
Marine Dredging/ During construction |
Contractor(s) |
|
ü |
|
Implemented |
Dumping at Sea Ordinance (DASO) |
|
S6.9 |
Disposal vessels will be fitted with
tight bottom seals in order to prevent leakage
of material during
transport. |
Marine Dredging/ During construction |
Contractor(s) |
|
ü |
|
Implemented |
- |
|
S6.9 |
Barges will be filled
to a level, which ensures
that material does not spill
over during transport to the disposal site and that adequate
freeboard is maintained to ensure
that the decks are not washed
by wave action. |
Marine Dredging/ During construction |
Contractor(s) |
|
ü |
|
Implemented |
- |
|
S6.9 |
After dredging, any excess materials will be cleaned
from decks and exposed
fittings before the vessel is moved from the dredging area. |
Marine Dredging/ During construction |
Contractor(s) |
|
ü |
|
Implemented |
- |
|
S6.9 |
All vessels
should be well maintained and inspected before use to limit
any potential discharges to the marine environment. |
Marine Dredging/ During construction |
Contractor(s) |
|
ü |
|
Implemented |
- |
|
S6.9 |
All
vessels must have a clean
ballast system. |
Marine Dredging/ During construction |
Contractor(s) |
|
ü |
|
Implemented |
- |
|
S6.9 |
No discharge of sewage/grey wastewater should be allowed. Waste water from potentially contaminated area on working
vessels should be minimized and collected. These kinds of wastewater should be brought back to port and discharged at
appropriate collection and treatment system. |
Marine Dredging/ During construction |
Contractor(s) |
|
ü |
|
observation issued. Rectified after
observation |
- |
|
S6.9 |
No soil waste is
allowed to be disposed overboard. |
Marine Dredging/ During construction |
Contractor(s) |
|
ü |
|
N/A |
- |
|
EIA Reference |
Recommended
Environmental Protection Measures/ Mitigation Measures |
Objectives of the recommended measures
& main concerns to address |
Implementation Agent |
Implementation Stage |
Implementation status |
Relevant Legislation & Guidelines |
||
|
D |
C |
O |
||||||
|
S6.9 |
Silt removal facilities such as silt traps
or sedimentation facilities will be provided to remove
silt particles from runoff to meet the requirements of the TM standard under the WPCO. The design of silt removal facilities will be based on the guidelines provided in ProPECC PN 1/94.
All drainage facilities and
erosion and sediment control
structures will be inspected on a
regular basis and maintained to confirm proper
and efficient |
Land site & drainage/ During construction |
Contractor(s) |
|
ü |
|
Implemented, reminder issued. |
ProPECC PN 1/94 TM Standard under the WPCO |
|
S6.9 |
Earthworks
to form the final surfaces will be followed
up with surface
protection and drainage works to prevent
erosion caused by rainstorms. |
Land site & drainage/ During construction |
Contractor(s) |
|
ü |
|
Implemented |
- |
|
S6.9 |
Appropriate surface drainage will be designed and provided where
necessary. |
Land site & drainage/ During construction |
Contractor(s) |
|
ü |
|
Implemented |
- |
|
S6.9 |
The
precautions to be taken at any time of year when rainstorms are likely together with the actions to be taken
when a rainstorm is imminent or forecasted and
actions to be taken during
or after rainstorms are summarised in Appendix A2 of ProPECC
PN 1/94. |
Land site & drainage/ During construction |
Contractor(s) |
ü |
ü |
|
Implemented |
ProPECC PN 1/94 |
|
S6.9 |
Oil interceptors will be provided in the drainage system where necessary and regularly emptied
to prevent the release of
oil and grease into the storm water drainage system after accidental spillages. |
Land site & drainage/ During construction |
Contractor(s) |
|
ü |
|
N/A |
- |
|
S6.9 |
Temporary and permanent drainage pipes and culverts
provided to facilitate runoff discharge, if any, will be adequately designed for the controlled release of storm flows. |
Land site & drainage/ During construction |
Contractor(s) |
|
ü |
|
Implemented |
- |
|
S6.9 |
The temporary diverted drainage, if any, will be reinstated to the original condition when the construction work has finished or when the temporary diversion is no longer
required. |
Land site & drainage/ During construction |
Contractor(s) |
|
ü |
|
N/A |
- |
|
S6.9 |
Appropriate numbers
of portable toilets
shall be provided by a licensed contractor to serve
the construction workers
over the construction site to prevent
direct disposal of sewage into the water
environment. |
Land site & drainage/ During construction |
Contractor(s) |
|
ü |
|
Implemented |
- |
|
EIA Reference |
Recommended
Environmental Protection Measures/ Mitigation Measures |
Objectives of the recommended measures
& main concerns to address |
Implementation Agent |
Implementation Stage |
Implementation status |
Relevant Legislation & Guidelines |
||
|
D |
C |
O |
||||||
|
S6.9 and S6.12 |
The
sterilization water should be
dechlorinated with total residual
chlorine (TRC) level below 1 mg/L before
discharge to public sewer. In situ testing of TRC should also be conducted for the discharge of
chlorinated water for pipeline disinfection to ensure
sufficient dechlorination before discharge to public sewer. |
Sterilization of
water mains prior to commissioning |
Contractor(s) |
|
ü |
ü |
N/A |
Technical Memorandum for
Effluents Discharged into Drainage and Sewerage Systems
Inland and Coastal Waters |
|
S6.9 |
The
cleaning and flushing water should also be treated and desilted to the relevant discharge requirement stipulated in TM-DSS before
discharging. |
Sterilization of
water mains prior to commissioning |
Contractor(s) |
|
ü |
ü |
N/A |
Technical Memorandum for
Effluents Discharged into Drainage and Sewerage Systems
Inland and Coastal Waters |
|
S6.9 |
Site drainage should
be well maintained and good construction practices should be observed to ensure that oil, fuels, solvents and other chemicals are managed, stored and handled properly
and do not enter the nearby water streams. |
Land site & drainage/ During construction/
During operation |
Contractor(s) |
|
ü |
ü |
Implemented, reminder issued. |
- |
|
S6.12 |
Regular
site inspections will be carried out in order to confirm that regulatory
requirements are being met and that
contractors are implementing the
standard site practice and mitigation measures as proposed to reduce potential impacts to water
quality. |
During construction |
Contractor(s)/ Environmental Team
(ET) & Independent Environmental Checker (IEC) |
|
ü |
|
Implemented |
- |
Note: D - Design stage C - Construction O - Operation
|
EIA Reference |
Recommended
Environmental Protection Measures/ Mitigation Measures |
Objectives of the recommended
measures & main concerns to address |
Implementation Agent |
Implementation Stage |
Implementation Status |
Relevant
Legislation & Guidelines |
||
|
D |
C |
O |
||||||
|
Waste Management |
||||||||
|
S8.5 |
Nomination of approved personnel to be responsible for standard site
practices, arrangements for
collection and effective disposal to an appropriate facility of all wastes generated at the site. |
Contract mobilisation/ During construction |
Contractor(s) |
|
ü |
|
Implemented |
- |
|
S8.5 |
Training of site personnel in proper waste
management and chemical handling procedures. Training will be provided to workers on the concepts of site
cleanliness and appropriate waste management procedures, including waste
reduction, reuse and recycling at the beginning of the construction works. |
Contract mobilisation/ During construction |
Contractor(s) |
|
ü |
|
Implemented |
- |
|
S8.5 |
Provision of sufficient waste disposal points
and regular collection for disposal. |
All area/
During construction/ During operation |
Contractor(s) |
|
ü |
ü |
Implemented |
DEVB TC(W) No. 8/2010, Enhanced Specification
for Site Cleanliness and Tidiness. |
|
S8.5 |
Appropriate
measures to reduce windblown litter and dust
transportation of waste by either covering trucks or by transporting wastes in enclosed containers. |
All area/ During construction |
Contractor(s) |
|
ü |
|
Implemented |
DEVB TC(W) No. 8/2010, Enhanced Specification for
Site Cleanliness and Tidiness. |
|
S8.5 |
A waste
management plan (WMP)
as stated in the ��ETWB TC(W)
No. 19/2005, Environmental Management on Construction Sites�� for the amount of waste
generated, recycled and disposed of (including the disposal sites) will be established and implemented during the construction phase
as part of the Environmental Management Plan (EMP). The Contractor
will be required to prepare the EMP and submits it to the Architect/ Engineer under the Contract for approval prior to implementation. |
All area/ During construction |
Contractor(s) |
|
ü |
|
Implemented |
ETWB TC(W) No. 19/2005, Environmental Management on Construction Sites |
|
S8.5 |
Separation
of chemical wastes for special handling and
appropriate treatment at the Chemical Waste Treatment Centre
at Tsing Yi. |
All area/ During construction |
Contractor(s) |
|
ü |
|
Implemented, reminder issued. |
Chapters 2 & 3 Code of Practice on the Packaging, Labelling & Storage of Chemical
Wastes published under the Waste Disposal Ordinance (Cap 354), Section 35 |
|
S8.5 |
Regular cleaning and maintenance programme for drainage systems, sumps and oil interceptors. |
Land site/ During construction |
Contractor(s) |
|
ü |
|
Implemented, Reminder Issued. |
Waste Disposal Ordinance (Cap 354) |
|
EIA Reference |
Recommended
Environmental Protection Measures/ Mitigation Measures |
Objectives of the recommended
measures & main concerns to address |
Implementation Agent |
Implementation Stage |
Implementation Status |
Relevant
Legislation & Guidelines |
||
|
D |
C |
O |
||||||
|
S8.5 |
A recording system for the amount of wastes generated/ recycled and disposal sites. The trip- ticket system will be
included as one of the
contractual requirements and
implemented by the contractor(s). |
Land site/ During construction |
Contractor(s) |
|
ü |
|
Implemented |
DEVB TC(W) No. 6/2010, Trip Ticket System for Disposal of Construction & Demolition Materials |
|
S8.5 |
Segregation and storage
of different types
of waste in different containers, skips or stockpiles to enhance reuse or recycling of material and their proper disposal. |
Land site/ During construction/ During operation |
Contractor(s) |
|
ü |
|
Implemented, reminder issued. |
WBTC 32/92, The Use of
Tropical Hard Wood
on Construction Site |
|
S8.5 |
Encourage collection of aluminium cans and waste
paper by individual
collectors during construction with separate labelled bins provided to segregate these
wastes from other
general refuse by the workforce. |
Land site/ During construction |
Contractor(s) |
|
ü |
|
Implemented |
ETWB TCW
No. 33/2002, Management of Construction and Demolition
Material Including Rock |
|
S8.5 |
Any
unused chemicals and those with remaining functional capacity will be recycled as far as possible. |
Land site/ During construction |
Contractor(s) |
|
ü |
|
N/A |
- |
|
S8.5 |
Use of reusable non-timber formwork to reduce the
amount of C&D materials. |
All areas/ During construction |
Contractor(s) |
|
ü |
|
Implemented |
WBTC 32/92, The Use of
Tropical Hard Wood on Construction Site |
|
S8.5 |
Prior to disposal of
construction waste, wood,
steel and other metals will be separated to the extent practical, for re-use and/or recycling to reduce the quantity of waste to
be disposed of to landfill. |
All areas/ During construction |
Contractor(s) |
|
ü |
|
Implemented |
DEVB TC(W) No. 6/2010, Trip
Ticket System for Disposal of Construction &
Demolition Materials |
|
S8.5 |
Proper storage and site practices to reduce the potential for damage or contamination of
construction materials. |
All areas/ During construction |
Contractor(s) |
|
ü |
|
Implemented, reminder issued. |
- |
|
S8.5 |
Plan and stock construction materials carefully to reduce amount
of waste generated and avoid unnecessary generation of waste. |
All areas/ During construction |
Contractor(s) |
|
ü |
|
Implemented |
- |
|
S8.5 |
A Sediment Quality Report (SQR)
for sampling and chemical
testing of the sediment will be prepared and
submitted to the EPD for
approval. The approved detailed sampling and chemical testing
will be carried out prior to the commencement of the dredging activities to confirm the sediment disposal method. |
Marine works/ During construction |
Contractor(s) |
|
ü |
|
N/A |
ETWB TC(W) No. 34/2002 and
Dumping at Sea
Ordinance (DASO) |
|
S8.5 |
The
management of dredged/ excavated sediment management requirement from ETWB TC(W)
No. 34/2002 will
be incorporated in the
Specification of the Contract Documents. |
Marine works/ During construction |
WSD/ Contractor(s) |
|
ü |
|
Implemented |
ETWB TC(W) No. 34/2002 and Dumping at Sea Ordinance (DASO) |
|
S8.5 |
The contractor will open a billing account
with EPD in accordance with the Waste Disposal (Charges for Disposal of Construction Waste)
Regulation for the |
Contract mobilisation/ During
construction |
Contractor(s) |
|
ü |
|
Implemented |
Cap 354N Waste Disposal (Charges for Disposal of |
|
EIA Reference |
Recommended
Environmental Protection Measures/ Mitigation Measures |
Objectives of the recommended
measures & main concerns to address |
Implementation Agent |
Implementation Stage |
Implementation Status |
Relevant
Legislation & Guidelines |
||
|
D |
C |
O |
||||||
|
|
payment of disposal charges. |
|
|
|
|
|
|
Construction Waste) Regulation |
|
S8.5 |
A
trip-ticket system will be established in accordance with DEVB TC(W) No. 6/2010 to monitor the reuse of surplus
excavated materials off-site and disposal of construction waste
and general refuse
at transfer facilities/ landfills, and to control fly-tipping. |
Contract mobilisation/ During construction |
Contractor(s) |
|
ü |
|
Implemented |
DEVB TC(W) No. 6/2010, Trip Ticket System for Disposal
of Construction &
Demolition Materials |
|
S8.5 |
The project
proponent will also conduct regular
inspection of the waste management measures implemented on site as described in the Waste
Management Plan. |
All area/ During construction |
Contractor(s)/ Environmental Team
(ET) & Independent Environmental Checker (IEC) |
|
ü |
|
Implemented |
ETWB TC(W) No. 19/2005, Environmental Management on Construction Sites |
|
S8.5 |
A recording system (similar to summary table as shown
in Annex 5 and Annex 6 of Appendix G of ETWB TC(W) No. 19/2005) for the amount
of waste generated, recycled and disposed of (including the disposal sites) will be established during the construction phase. |
All area/ During construction |
Contractor(s) |
|
ü |
|
Implemented |
Annex 5
and Annex 6 of Appendix G of ETWB TC(W) No. 19/2005 |
|
S8.5 |
Inert C&D materials (public
fill) will be reused within the
Project as far
as practicable. |
All area/ During construction |
Contractor(s) |
|
ü |
|
Implemented |
- |
|
S8.5 |
Public fill and construction waste shall be segregated and stored
in different containers or skips to facilitate reuse or recycling of materials and their proper disposal. |
All area/ During construction |
Contractor(s) |
|
ü |
|
Implemented |
- |
|
S8.5 |
Specific areas of the work site
will be designated for such segregation and storage if immediate use
is not practicable. |
All area/ During construction |
Contractor(s) |
|
ü |
|
Implemented |
- |
|
S8.5 |
To
reduce the potential dust and water quality impacts of site formation works, C&D materials will be wetted as quickly as possible to the extent
practice after filling. |
All area/ During construction |
Contractor(s) |
|
ü |
|
Implemented |
Air Pollution Control (Construction Dust) Regulation
(Cap 311R); WPCO (Cap 358) |
|
S8.5 |
Open stockpiles of excavated/ fill materials or construction wastes
on-site should be covered with tarpaulin or similar fabric. |
Land site/ During Construction,
particularly dry
season |
Contractor(s) |
|
ü |
|
Implemented |
Air Pollution Control (Construction Dust) Regulation (Cap 311R) |
|
S8.5 |
Chemical waste container shall be suitable for the substance they are holding, resistant to corrosion, maintained in a good condition, and securely closed. |
All area/
During construction/ During operation |
Contractor(s)/ WSD |
|
ü |
ü |
Implemented |
Waste
Disposal (Chemical Waste) (General) Regulation; Code of |
|
EIA Reference |
Recommended
Environmental Protection Measures/ Mitigation Measures |
Objectives of the recommended
measures & main concerns to address |
Implementation Agent |
Implementation Stage |
Implementation Status |
Relevant
Legislation & Guidelines |
||
|
D |
C |
O |
||||||
|
|
|
|
|
|
|
|
|
Practice on the Packaging, Handling and Storage of Chemical Wastes |
|
S8.5 |
Chemical
waste container shall have a capacity of less than 450 L unless the specifications have been approved by
the EPD. |
All area/ During construction/ During operation |
Contractor(s)/ WSD |
|
ü |
ü |
Implemented |
Waste Disposal
(Chemical
Waste) (General) Regulation; Code
of Practice on the Packaging, Handling and Storage of Chemical Wastes |
|
S8.5 |
A label
in English and Chinese shall
be displayed on the chemical container in accordance with instructions prescribed in Schedule 2 of the Regulations. |
All area/ During construction/ During operation |
Contractor(s)/ WSD |
|
ü |
ü |
Implemented |
Waste Disposal
(Chemical
Waste) (General) Regulation; Code
of Practice on the Packaging, Handling and Storage of Chemical Wastes |
|
S8.5 |
Storage areas for chemical waste shall be enclosed on at
least 3 sides. |
All area/ During construction/ During operation |
Contractor(s)/ WSD |
|
ü |
ü |
Implemented |
Waste Disposal
(Chemical
Waste) (General) Regulation; Code
of Practice on the Packaging, Handling and Storage of Chemical Wastes |
|
S8.5 |
Storage areas
for chemical waste
shall have an impermeable floor
and bunding, of capacity to accommodate 110% of the volume of the largest
container or 20% by volume
of the chemical waste stored in that area,
whichever is the
greatest. |
All area/ During construction/ During operation |
Contractor(s)/ WSD |
|
ü |
ü |
Implemented |
Waste Disposal
(Chemical
Waste) (General) Regulation; Code
of Practice on the Packaging, Handling and
Storage of Chemical Wastes |
|
S8.5 |
Storage areas for chemical waste shall have adequate ventilation. |
All area/ During construction/ During operation |
Contractor(s)/ WSD |
|
ü |
ü |
Implemented |
Waste Disposal
(Chemical
Waste) (General) Regulation; Code
of Practice on the Packaging, Handling and Storage of Chemical Wastes |
|
S8.5 |
Storage
areas for chemical waste shall be covered to
prevent rainfall entering (water
collected within the bund must
be tested and disposed of as chemical waste, if necessary). |
All area/
During construction/ During operation |
Contractor(s)/ WSD |
|
ü |
ü |
Implemented |
Waste Disposal
(Chemical
Waste) (General) Regulation; Code
of Practice on the Packaging, Handling and Storage of Chemical Wastes |
|
S8.5 |
Storage areas for chemical waste shall be arranged so |
All area/ During construction/ |
Contractor(s)/ |
|
ü |
ü |
Implemented |
Waste Disposal (Chemical |
|
EIA Reference |
Recommended
Environmental Protection Measures/ Mitigation Measures |
Objectives of the recommended
measures & main concerns to address |
Implementation Agent |
Implementation Stage |
Implementation Status |
Relevant
Legislation & Guidelines |
||
|
D |
C |
O |
||||||
|
|
that incompatible materials are appropriately separated. |
During operation |
WSD |
|
|
|
|
Waste) (General) Regulation; Code of Practice on the Packaging, Handling and Storage of Chemical Wastes |
|
S8.5 |
General refuse
will be stored
in enclosed bins or compaction units separately from construction and chemical wastes. |
All area/ During construction/ During operation |
Contractor(s)/ WSD |
|
ü |
ü |
Implemented, reminder issued. |
Waste Disposal
(Chemical
Waste) (General) Regulation; Code
of Practice on the Packaging, Handling and
Storage of Chemical Wastes |
|
S8.5 |
Adequate number of waste containers will be provided to avoid over-spillage of waste. |
All area/ During construction/ During operation |
Contractor(s)/ WSD |
|
ü |
ü |
Implemented |
DEVB TC(W) No. 8/2010 Enhanced Specification for Site Cleanliness and Tidiness. |
|
S8.5 |
A
reputable waste collector will be employed by the Contractor to remove
general refuse from the site,
separately from construction and chemical wastes,
on a daily basis to minimise odour, pest and litter impacts. |
All area/ During construction/ During operation |
Contractor(s)/ WSD |
|
ü |
ü |
Implemented |
- |
|
S8.5 |
Recycling
bins will be provided at strategic locations
within the Site to facilitate recovery of recyclable materials (including aluminium can, waste paper, glass
bottles and plastic
bottles) from the Site. Materials recovered will be sold for recycling. |
All area/
During construction/ During operation |
Contractor(s)/ WSD |
|
ü |
ü |
Implemented |
- |
|
S8.5 |
To
avoid any odour and litter
impact, accurate number of portable toilets will be provided for workers on-site. |
All area/ During construction |
Contractor(s) |
|
ü |
|
Implemented |
- |
|
S8.5 |
The burning of refuse on construction sites is prohibited by
law. |
All area/ During construction |
Contractor(s) |
|
ü |
|
Implemented |
Air Pollution Control Ordinance (Cap 311) |
|
S8.7 |
To facilitate monitoring and control over the contractors�� performance on waste management, a waste inspection and audit programme will be implemented throughout the construction phase. |
All facilities/ During construction |
ET/
IEC |
|
ü |
|
Implemented |
- |
Note: D - Design stage C - Construction O - Operation
|
|
Recommended
Environmental Protection Measures/ Mitigation Measures |
Objectives of the recommended
measures & main concerns to address |
Implementation Agent |
Implementation Stage |
Implementation Status |
Relevant
Legislation & Guidelines |
||
|
D |
C |
O |
||||||
|
|
Ecology |
|||||||
|
S9.7 |
For slope
mitigation works within
the Clear Water
Bay Country Park, to avoid tree felling
and damages to trees,
the exact locations of the flexible barrier foundation
plates, soil nails and rock dowels can be adjusted during detailed design, and a setback distance from existing trees is recommended to
be maintained as far as practical. A detailed specification describing the
exact locations of the flexible
barrier foundation plates, soil
nails and rock dowels will be
prepared to illustrate how the setback distance from existing trees would be implemented for tree avoidance. |
Slope
mitigation works area/ During detailed design/ During
construction |
Contractor(s) |
ü |
ü |
|
Implemented |
- |
|
S9.7 |
Pruning of tree canopies along the alignment of the flexible barriers shall be limited
to a minimum. |
Slope mitigation works area/ During construction |
Contractor(s) |
|
ü |
|
Implemented |
|
|
S9.7 |
The alignment of flexible barriers shall be optimized to preserve all species of conservation interest and minimize the impact to the existing vegetation as far as practicable. All individuals of Marsdenia
lachnostoma within the slope
mitigation areas shall be retained in- situ, by positioning the alignment
of flexible barrier at a minimum
1.5m in a radius away from these individuals. |
Slope
mitigation works area/ During detailed design/ During
construction |
Contractor(s) |
ü |
ü |
|
Implemented |
- |
|
S9.7 and 9.10 |
At the detailed design
stage prior to the commencement of the slope
mitigation works, a vegetation survey
shall be carried
out at the slope mitigation areas within the Clear
Water Bay Country Park to assess
the condition and identify the location of
each individual of Marsdenia
lachnostoma and other flora species
of conservation interest
that may be directly affected by the construction works. |
Slope
mitigation works area/ During detailed design/ During
construction |
Contractor(s) |
ü |
ü |
|
Implemented |
- |
|
S9.7 |
Temporary
fencing will be installed to fence off the
concerned species either
in groups of individually within the works area and in the close
proximity to prevent from being damaged
and disturbed during
construction. A sign identifying the site shall
be attached to the fence and flagging tape shall be attached to the individuals to visualize their
locations. |
Slope
mitigation works area/ During
construction |
Contractor(s) |
|
ü |
|
Implemented |
- |
|
S9.7 and S9.10 |
A specification
for fencing and demarcating individuals of
Marsdenai lachnostoma (or other
flora species of conservation interest, if found) adjacent to the |
Slope
mitigation works area/ During
construction |
Contractor(s) |
|
ü |
|
Implemented |
- |
|
|
Recommended
Environmental Protection Measures/ Mitigation Measures |
Objectives of the recommended
measures & main concerns to address |
Implementation Agent |
Implementation Stage |
Implementation Status |
Relevant
Legislation & Guidelines |
||
|
D |
C |
O |
||||||
|
|
proposed alignment of the flexible barriers will be prepared to protect the species. |
|
|
|
|
|
|
|
|
S9.7 |
Induction training shall also be provided to all
site personnel in order to brief them on this flora of conservation interest including the locations and their importance. |
Slope
mitigation works area/ During
construction |
Contractor(s) |
|
ü |
|
Implemented |
- |
|
S9.7 |
The resident site supervisory staff will closely monitor the
conditions of concerned individuals during construction of flexible barriers in the close
proximity. |
Slope
mitigation works area/ During
construction |
Contractor(s) |
|
ü |
|
Implemented |
- |
|
S9.7 |
Erect
fences along the boundary of the
works area before the commencement of works to prevent vehicle movements and encroachment of personnel onto adjacent areas. |
All area/ During construction |
Contractor(s) |
|
ü |
|
Implemented |
- |
|
S9.7 |
Regularly check the work site
boundaries to ensure that they are
not breached and that damage does not occur to surrounding areas. |
All area/ During construction |
Contractor(s)/ Environmental Team (ET) |
|
ü |
|
Implemented. |
- |
|
S9.7 |
Avoid any damage and disturbance,
particularly those caused by filling and illegal dumping, to the surrounding habitats through proper management of waste disposal. |
All area/ During construction |
Contractor(s) |
|
ü |
|
Implemented |
- |
|
S9.7 |
Reinstate
temporarily affected areas, particularly the
habitats of plantation and shrubland-grassland immediately after completion of
construction works, through on-site
tree/shrub planting. The tree/shrub species
will be chosen
with reference to those in the surrounding area. |
All area/ During construction |
Contractor(s) |
|
ü |
|
N/A |
- |
|
S9.7 |
Affected
habitats within the Clear Water Bay Country
Bay shall be reinstated by hydro-seeding and planting of climbers and native shrub
seedlings where practical upon completion of the slope mitigation works. |
All area/ During construction |
Contractor(s) |
|
ü |
|
N/A |
- |
Note: D - Design stage C - Construction O - Operation
|
EIA Reference |
Recommended Environmental Protection Measures/ Mitigation Measures |
Objectives of the recommended measures & main concerns to address |
Implementation Agent |
Implementation Stage |
Implementation Status |
Relevant Legislation & Guidelines |
||
|
D |
C |
O |
||||||
|
|
Landscape & Visual |
|||||||
|
S11.10 & 11.11 |
The construction area and area allowed
for temporary structures, such as
the contractor��s office, will be minimized
to a practical minimum. (MM1) |
All area/ Detailed design/
During construction/ During operation |
WSD/ Contractor(s) |
ü |
ü |
ü |
Implemented |
- |
|
S11.10 & 11.11 |
At
the detailed design stage, the design team will seek to minimize the landscape
footprint of the Project and above
ground facilities, while satisfying all other requirements. (MM2) |
All area/ Detailed design/
During construction/ During operation |
WSD/ Contractor(s) |
ü |
ü |
ü |
Implemented |
- |
|
S11.10 & 11.11 |
Design principles will be adopted
to take into account the surrounding area, particularly Clear
Water Bay Country
Park behind and
the nearby waterfront, with due consideration given to: - green
roofs where practical (ie without equipment on the roof); - roadside
planting; - aesthetic treatment of all structures; - vertical
greening; - screen
planting along application site; and - landscape enhancement with amenity
planting where practical including planting along the edge (site boundary) fence with native
shrubs where feasible, to reduce their visual impact and blend them into the
surrounding landscape. (MM3) |
All area/ Detailed design/
During construction/ During operation |
WSD/ Contractor(s) |
ü |
ü |
ü |
Implemented |
- |
|
S11.10 & 11.11 |
All trees
within the Project
Site or the potential slope
mitigation works area will be carefully protected
during construction according to DEVB TCW No.
10/2013 - Tree
Preservation (MM4) |
All area/ Detailed design/
During construction/ During operation |
WSD/ Contractor(s) |
ü |
ü |
ü |
Implemented |
ETWB TCW No. 3/2006
- Tree Preservation. |
|
S11.10 & 11.11 |
No
tree within the Country Park will be felled. Trees within the Site unavoidably affected by the works
will be transplanted where necessary and
practical. For trees that need to be felled, compensatory planting will be provided to the satisfaction of relevant Government departments. A compensatory tree planting
proposal including locations of tree compensation will be submitted to seek relevant government department��s approval, in accordance with DEVB
TC(W) No. 10/2013. (MM5) |
All area/ Detailed design/
During construction/ During operation |
WSD/ Contractor(s) |
ü |
ü |
ü |
Implemented |
DEVB TC(W) No. 10/2013 |
|
S11.10 & 11.11 |
Any slope
mitigation works necessary to address natural
terrain hazards, will be
minimized to minimize any potential
environmental impact to the Country
Park e.g. soil nailing and rock stabilization will aim
to avoid existing trees e.g. should
any restoration of vegetation be |
All area/ Detailed design/
During construction/ During operation |
WSD/ Contractor(s) |
ü |
ü |
ü |
N/A |
|
|
EIA Reference |
Recommended Environmental Protection Measures/ Mitigation Measures |
Objectives of the recommended measures & main concerns to address |
Implementation Agent |
Implementation Stage |
Implementation Status |
Relevant Legislation & Guidelines |
||
|
D |
C |
O |
||||||
|
|
necessary, the best planting matrix with native species
will be established, with the aim of resembling the existing vegetation. (MM6) |
|
|
|
|
|
|
|
|
S11.10 & 11.11 |
Dredging works for the installation of intake
structures and outfall diffusers should be minimized to avoid
or reduce any potential environmental impacts to as low as reasonably practicable (ALARP). The intake and outfall structures (e.g.
intake openings and diffuser heads)
will be prefabricated and transferred to site for installation. (MM7) |
All area/ Detailed design/
During construction/ During operation |
WSD/ Contractor(s) |
ü |
ü |
ü |
Implemented |
|
|
S11.10 & 11.11 |
All night-time lighting will be
reduced to a practical minimum both in terms of number of level and will be
hooded and directional. (MM8) units
and lux level
and will be hooded and directional. (MM8) |
All area/ Detailed design/
During construction/ During operation |
WSD/ Contractor(s) |
ü |
ü |
ü |
Implemented |
- |
Note: D - Design stage C - Construction O -
Operation
|
EIA Reference |
Recommended Environmental Protection Measures/ Mitigation Measures |
Objectives of the recommended measures & main concerns to address |
Implementation Agent |
Implementation Stage |
Implementation Status |
Relevant Legislation & Guidelines |
||
|
D |
C |
O |
||||||
|
|
Landfill Gas Hazard |
|||||||
|
S12.7 |
During
all works, safety procedures should be implemented to minimise the risks of fires and explosions, asphyxiation of workers and
toxicity effects resulting from contact with contaminated soil and groundwater. |
All area/ Detailed design/ During construction/ During
operation |
Contractor(s) |
ü |
ü |
ü |
Implemented |
- |
|
S12.7 |
During trenching and excavation as well as creation of
confined spaces
at near to or below ground level, precautions should be clearly laid down and rigidly Gas detection equipment and appropriate breathing apparatus should be available and used when entering confined spaces or trenches deeper
than 1 metre. |
All area/ Detailed design/ During construction/ During
operation |
Contractor(s) |
ü |
ü |
ü |
Implemented |
|
|
S12.7 |
The
Contractor should make the workers are aware of potential hazards of
working in confined spaces (any chamber, manhole or culvert which is large enough to permit access to personnel). Such work in confined spaces
is controlled by the Factories and Industrial Undertakings (Confined Spaces) Regulations of the Factories and Industrial Undertakings Ordinance. Following the Safety Guide
to Working in Confined Spaces ensures compliance with
the above regulations. |
All area/ Detailed design/ During construction/ During
operation |
Contractor(s) |
ü |
ü |
ü |
Implemented |
|
|
S12.7 |
Safety officers, specifically trained with regard to landfill gas and leachate related hazards and the appropriate actions
to take in adverse circumstances, should be present on the site throughout the works, in particular, when works are undertaken below
grade. |
All area/ Detailed design/ During construction/ During
operation |
Contractor(s) |
ü |
ü |
ü |
Implemented |
|
|
S12.7 |
All personnel who work on site and all visitors to the site should be
made aware of the
possibility of ignition of gas in the vicinity of the works, the possible
presence of contaminated water and
the need to avoid physical contact with
it. |
All area/ Detailed design/ During construction/ During
operation |
Contractor(s) |
ü |
ü |
ü |
Implemented |
|
|
S12.7 |
Monitoring for landfill
gas should be undertaken in all excavations, manholes, chambers
(particularly during pipe jacking)
and any confined spaces through
the use of an intrinsically safe portable instrument, appropriately calibrated and capable of measuring the concentrations of methane. carbon dioxide and
oxygen. |
All area/ Detailed design/ During construction/ During
operation |
Contractor(s) |
ü |
ü |
ü |
Implemented |
|
|
S12.7 |
Monitoring
frequency and areas to be monitored should
be specified prior
to commencement of groundwork, either by the Safety Officer, or by an
appropriately qualified person. All
measurements should be recorded and documented. |
All area/ Detailed design/ During construction/ During
operation |
Contractor(s) |
ü |
ü |
ü |
Implemented |
|
|
EIA Reference |
Recommended Environmental Protection Measures/ Mitigation Measures |
Objectives of the recommended measures & main concerns to address |
Implementation Agent |
Implementation Stage |
Implementation Status |
Relevant Legislation & Guidelines |
||
|
D |
C |
O |
||||||
|
S12.7 |
Proceed drilling with adequate care and precautions against the potential hazards which may be encountered. |
All area/ Detailed design/ During construction/ During
operation |
Contractor(s) |
ü |
ü |
ü |
Implemented |
|
|
S12.7 |
Prior
to the commencement of the site works, the
drilling contractor should
devise a 'method-of- working' statement covering all normal and emergency procedures (including but not limited
to number of operatives,
experience and special skills of operatives,
normal method of operations, emergency procedures, supervisors responsibilities, storage and use of safety
equipment, safety procedures and signs, barriers and guarding). The
site supervisor and all operatives must be familiar with this statement. |
All area/ During construction/ During operation |
Contractor(s) |
ü |
ü |
ü |
Implemented |
|
|
S12.7 |
Where below ground service
entries are necessary to the Incoming Switchgear Room, 132 kV Substation and Chlorine Store (I) and (II), the entry point should be
sealed to prevent gas entry. In
addition, any below grade cable trenches entering the Incoming Switchgear Room
and 132 kV Substation can become the pathway for landfill gas and hence grilled metal covers
should be used. |
All area/ Detailed design/ During construction/ During
operation |
Contractor(s) |
ü |
ü |
ü |
N/A |
|
|
S12.7 |
It is recommended regular landfill gas monitoring should be carried out at the Incoming Switchgear Room, 132 kV Substation and Chlorine Store (I) and (II). The monitoring frequency will be monthly for the first year
of operation. If the monitoring results show no sign of landfill gas
migration, reduce the monitoring frequency to once every
six months. |
All area/ Detailed design/ During construction/ During
operation |
Contractor(s) |
ü |
ü |
ü |
N/A |
|
|
S12.7 |
The manholes and utility pits within the Project Site and along
the fresh water mains. Each manhole/ utility pit should be monitored with two measurements (at mid depth and base).
Each measurement should be monitored for a minimum of 10 minutes. A steady reading and peak reading
should be recorded at each manhole/ utility pit and for each measurement. The need for venting the manhole/ utility pit and further monitoring will be reviewed after the initial monitoring. |
All area/ Detailed design/ During construction/ During
operation |
Contractor(s) |
ü |
ü |
ü |
Implemented |
|
|
S12.7 |
All construction, operation and maintenance personnel working on-site as well as visitors should be made aware of
the hazards of landfill gas and its
possible presence on-site. This should be achieved
through a combination of posting
warning signs in prominent places and also by access to detailed information on landfill gas hazards and the designs and procedural means by
which these hazards are being minimized on-site. |
All area/ Detailed design/ During construction/ During
operation |
Contractor(s) |
ü |
ü |
ü |
Implemented |
|
Note: D - Design stage C - Construction O -
Operation
Appendix D
Impact Monitoring Schedule of the Reporting Month
|
Contract No. 13/WSD/17
Design, Build and Operate First
Stage of Tseung Kwan O
Desalination Plant EM&A Water
Quality Monitoring Schedule |
||||||
|
Jan |
||||||
|
Sun |
Mon |
Tue |
Wed |
Thu |
Fri |
Sat |
|
|
|
|
|
|
|
1 |
|
|
|
|
|
|
|
Impact Water Quality
monitoring for CE, CF, WSR1,
WSR2, WSR3, WSR4,
WSR16, WSR33, WSR36,
WSR37 Tidal Period: Ebb Tide: 09:19-13:00 Flood Tide: 13:00-19:39 Monitoring Time: Mid-ebb: 09:24-12:54 Mid-flood: 14:34-18:04 |
|
2 |
3 |
4 |
5 |
6 |
7 |
8 |
|
|
|
Impact Water Quality
monitoring for CE, CF, WSR1,
WSR2, WSR3, WSR4,
WSR16, WSR33, WSR36,
WSR37 Tidal Period: Ebb Tide: 11:55-15:07 Flood Tide: 04:43-11:55 Monitoring Time: Mid-ebb: 11:46-15:16 Mid-flood: 08:00-10:04*$# |
|
Impact Water Quality monitoring for CE, CF, WSR1,
WSR2, WSR3, WSR4,
WSR16, WSR33, WSR36,
WSR37 Tidal Period: Ebb Tide: 13:27-17:00 Flood Tide: 06:14-13:27 Monitoring Time: Mid-ebb: 13:28-16:58 Mid-flood: 08:05-11:35 |
|
Impact Water Quality
monitoring for CE, CF, WSR1,
WSR2, WSR3, WSR4,
WSR16, WSR33, WSR36,
WSR37 Tidal Period: Ebb Tide: 15:00-19:00 Flood Tide: 07:32-15:00 Monitoring Time: Mid-ebb: 15:15-18:45 Mid-flood: 09:31-13:01 |
|
9 |
10 |
11 |
12 |
13 |
14 |
15 |
|
|
|
Impact Water Quality
monitoring for CE, CF, WSR1,
WSR2, WSR3, WSR4,
WSR16, WSR33, WSR36,
WSR37 Tidal Period: Ebb Tide: 09:14-17:38 Flood Tide: 17:38-23:00 Monitoring Time: Mid-ebb: 11:41-15:11 Mid-flood: 17:40-19:00&$# |
|
Impact Water Quality monitoring for CE, CF, WSR1,
WSR2, WSR3, WSR4,
WSR16, WSR33, WSR36,
WSR37 Tidal Period: Ebb Tide: 07:31-10:16 Flood Tide: 10:16-18:49 Monitoring Time: Mid-ebb:
08:00-10:38*$# Mid-flood: 12:47-16:17 |
|
Impact Water Quality
monitoring for CE, CF, WSR1,
WSR2, WSR3, WSR4,
WSR16, WSR33, WSR36,
WSR37 Tidal Period: Ebb Tide: 10:00-12:00 Flood Tide: 12:00-19:40 Monitoring Time: Mid-ebb: 09:15-12:45 Mid-flood: 14:05-17:35 |
|
16 |
17 |
18 |
19 |
20 |
21 |
22 |
|
|
|
Impact Water Quality
monitoring for CE, CF, WSR1,
WSR2, WSR3, WSR4,
WSR16, WSR33, WSR36,
WSR37 Tidal Period: Ebb Tide: 11:06-14:00 Flood Tide: 04:18-11:06 Monitoring Time: Mid-ebb: 10:48-14:18 Mid-flood:08:00-10:45*$# |
|
Impact Water Quality monitoring for CE, CF, WSR1,
WSR2, WSR3, WSR4,
WSR16, WSR33, WSR36,
WSR37 Tidal Period: Ebb Tide: 12:02-15:24 Flood Tide: 05:19-12:02 Monitoring Time: Mid-ebb: 11:58-15:28 Mid-flood: 08:00-10:25*$# |
|
Impact Water Quality
monitoring for CE, CF, WSR1,
WSR2, WSR3, WSR4,
WSR16, WSR33, WSR36,
WSR37 Tidal Period: Ebb Tide: 13:13-17:05 Flood Tide: 06:21-13:13 Monitoring Time: Mid-ebb: 13:24-16:54 Mid-flood: 08:02-11:32 |
|
23 |
24 |
25 |
26 |
27 |
28 |
29 |
|
|
|
Impact Water Quality
monitoring for CE, CF, WSR1,
WSR2, WSR3, WSR4,
WSR16, WSR33, WSR36,
WSR37 Tidal Period: Ebb Tide: 15:28-20:28 Flood Tide: 08:00-15:28 Monitoring Time: Mid-ebb: 15:43-19:00&$# Mid-flood:09:59-13:29 |
|
Impact Water Quality monitoring for CE, CF, WSR1,
WSR2, WSR3, WSR4,
WSR16, WSR33, WSR36,
WSR37 Tidal Period: Ebb Tide: 05:21-09:25 Flood Tide: 09:25-16:58 Monitoring Time: Mid-ebb:08:00-09:12*$# Mid-flood:11:26-14:56 |
|
Impact Water Quality
monitoring for CE, CF, WSR1,
WSR2, WSR3, WSR4,
WSR16, WSR33, WSR36,
WSR37 Tidal Period: Ebb Tide: 08:38-11:20 Flood Tide: 11:20-18:31 Monitoring Time: Mid-ebb: 08:14-11:44 Mid-flood: 13:10-16:40 |
|
30 |
31 |
|
||||
|
|
Impact Water Quality monitoring for CE, CF, WSR1,
WSR2, WSR3, WSR4,
WSR16, WSR33, WSR36,
WSR37 Tidal Period: Ebb Tide: 10:17-13:25 Flood Tide: 13:25-20:20 Monitoring Time: Mid-ebb: 10:06-13:36 Mid-flood: 15:07-18:37 |
|||||
|
Remarks: Monitoring Parameters: Dissolved oxygen, Temperature, pH, Turbidity, Salinity, Suspended Solids Note: * - Due to safety
concern of vessel
transportation earlier than
0700, Water Quality
Monitoring would start
at 0800. $ - Since
predicted tide is shorter than
3.5 hours, method
of 90% tidal
period as monitoring time is adopted. & - Due to safety
concern for sampling event in night-time, method of 90% tidal period
as monitoring time
is approached and end at 1900. # - Prioritized routing: Mid-Ebb: CE��WSR16��WSR37��WSR36��WSR33��Remaining stations and Mid-Flood: CF��WSR1��WSR2��WSR3��WSR4��Remaining stations |
||||||
Appendix E
Event/Action Plan for Noise Exceedance
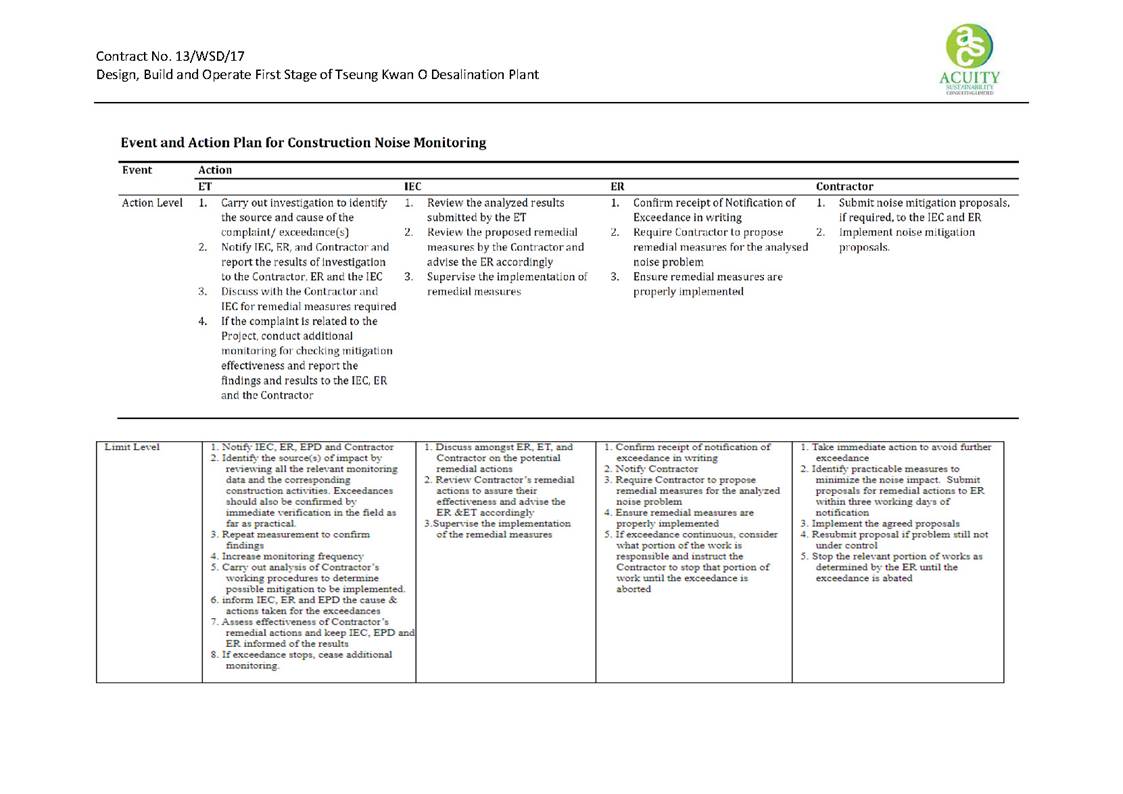
Appendix F
Noise Monitoring Equipment Calibration Certificate (BLANK)
(BLANK)
Appendix G
Event/Action Plan for Water Quality Exceedance
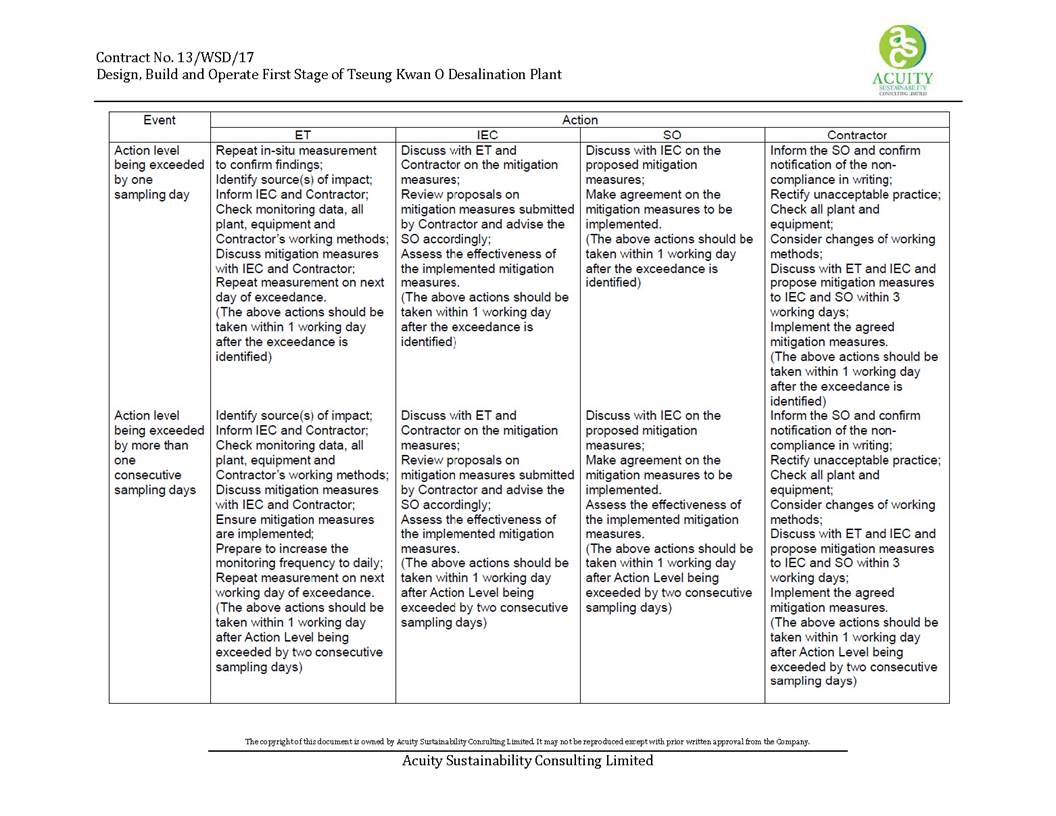
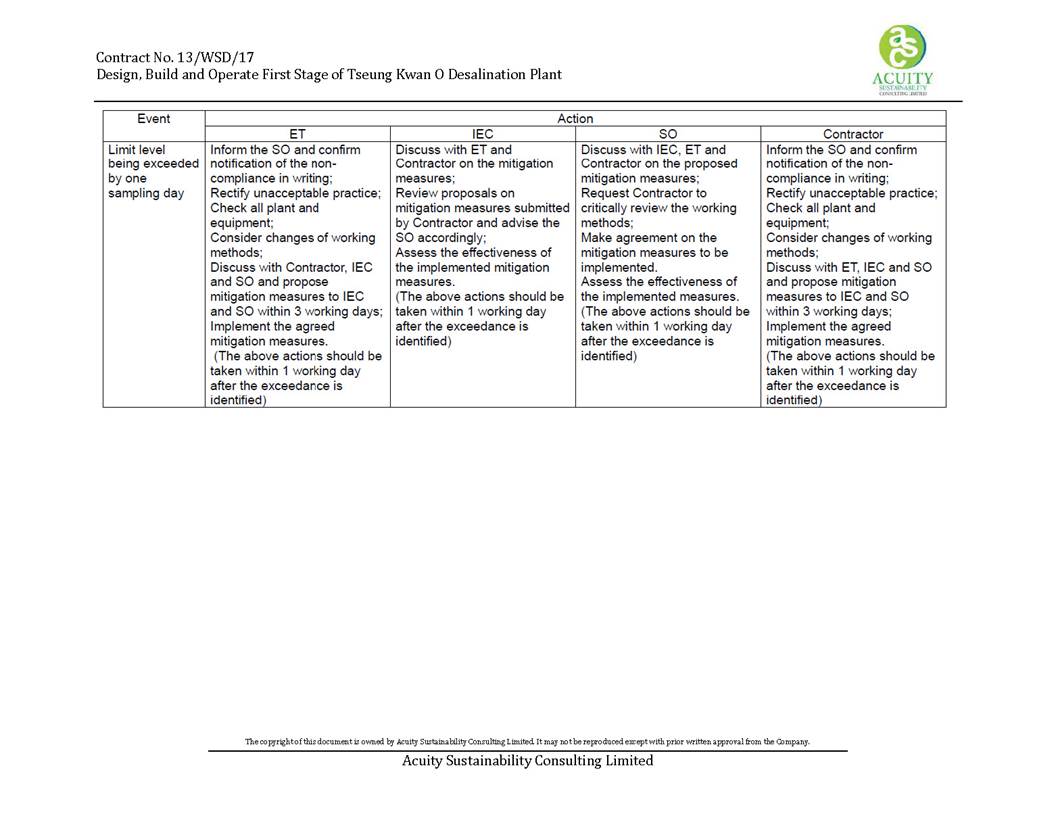
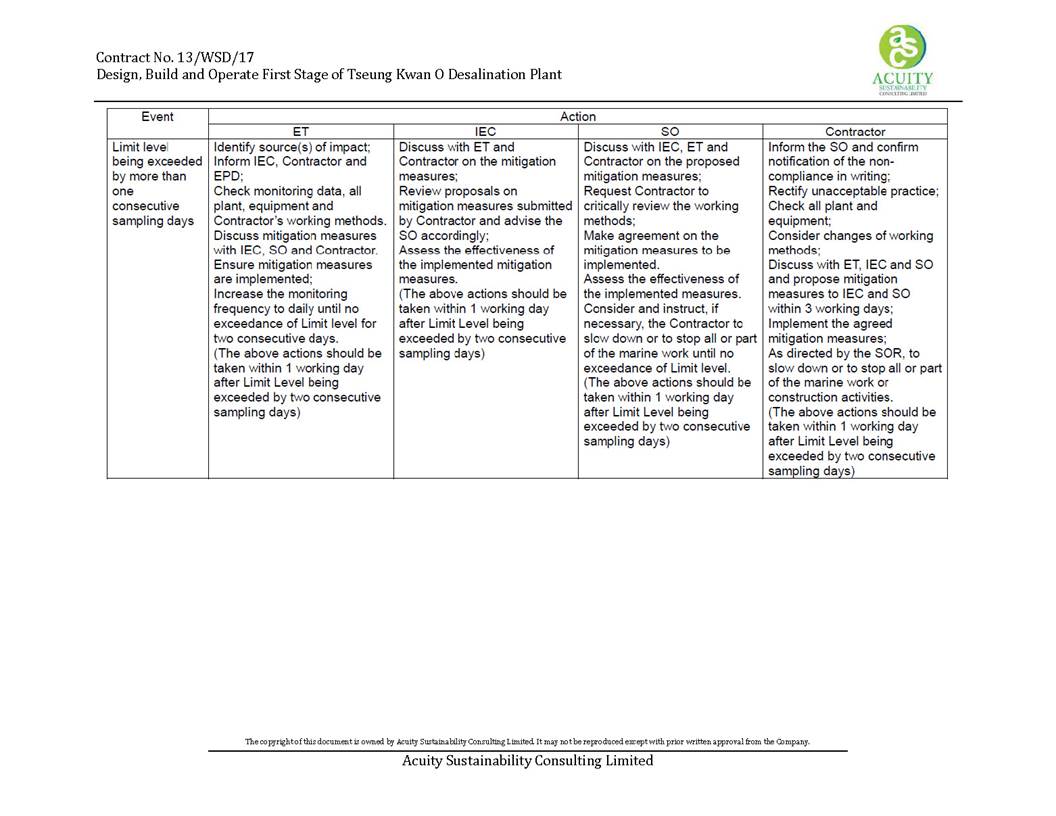
Appendix H
Waste Flow Table
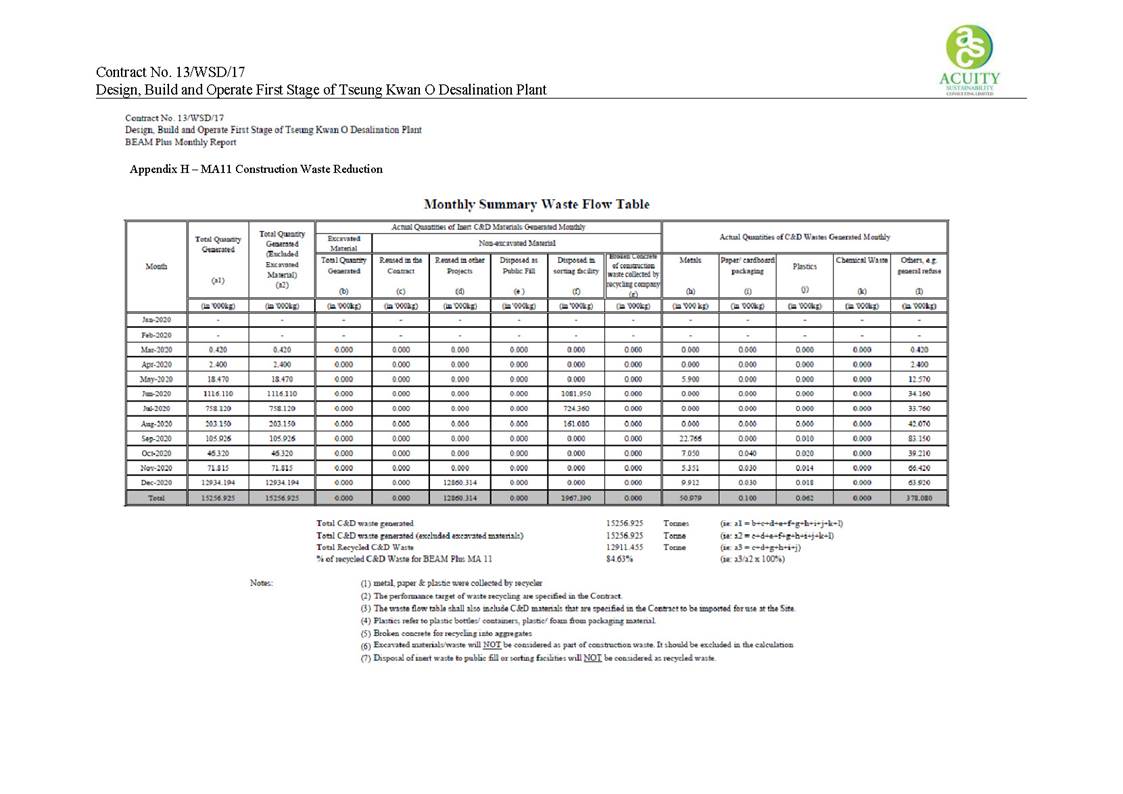
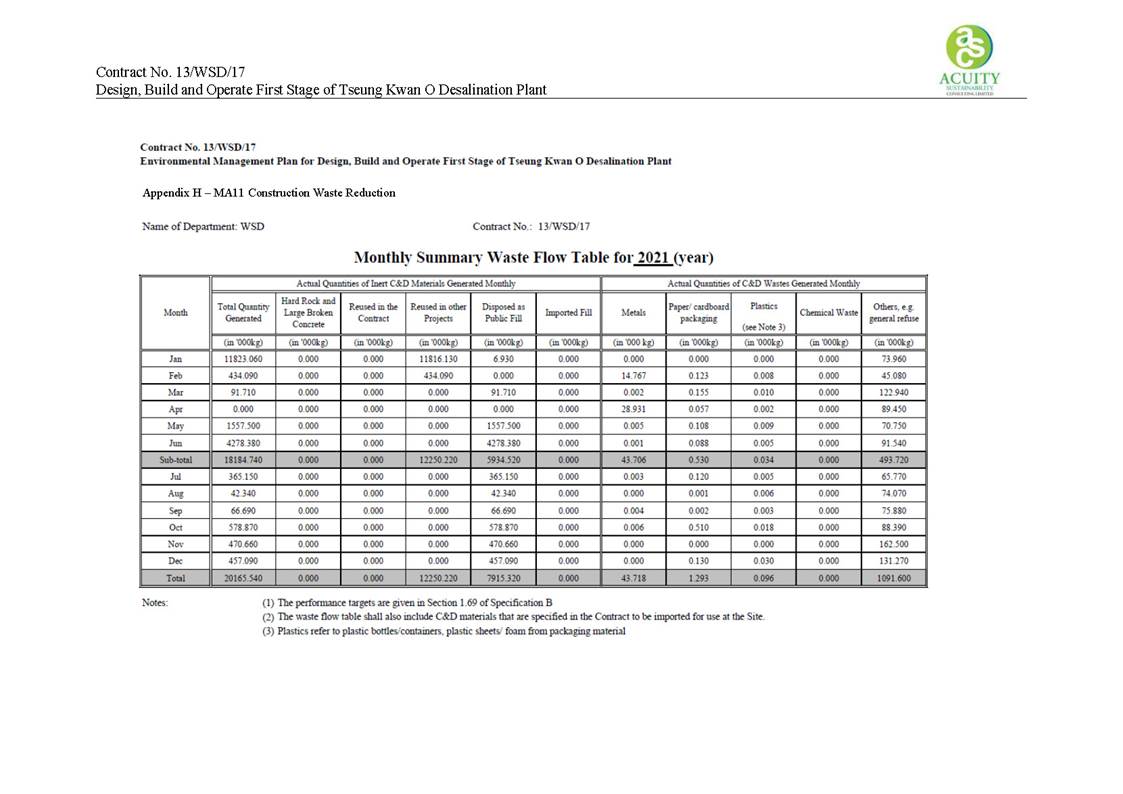
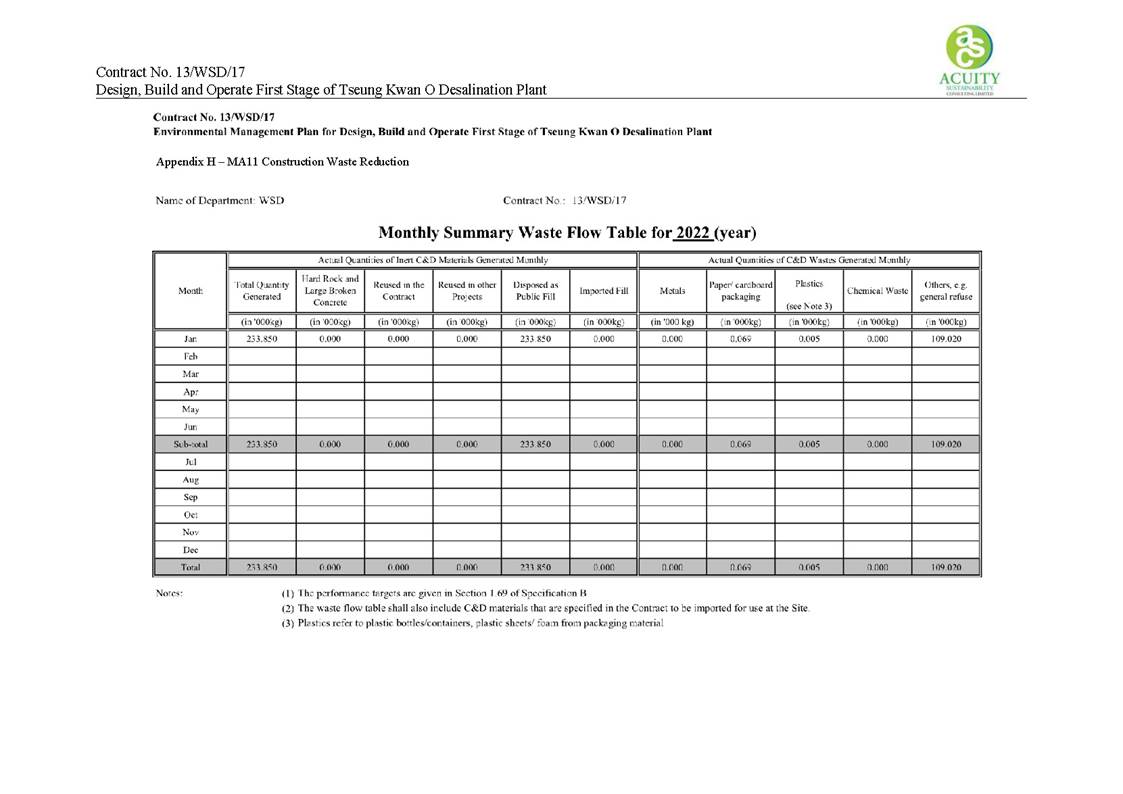
Appendix I
Site Inspection Proforma
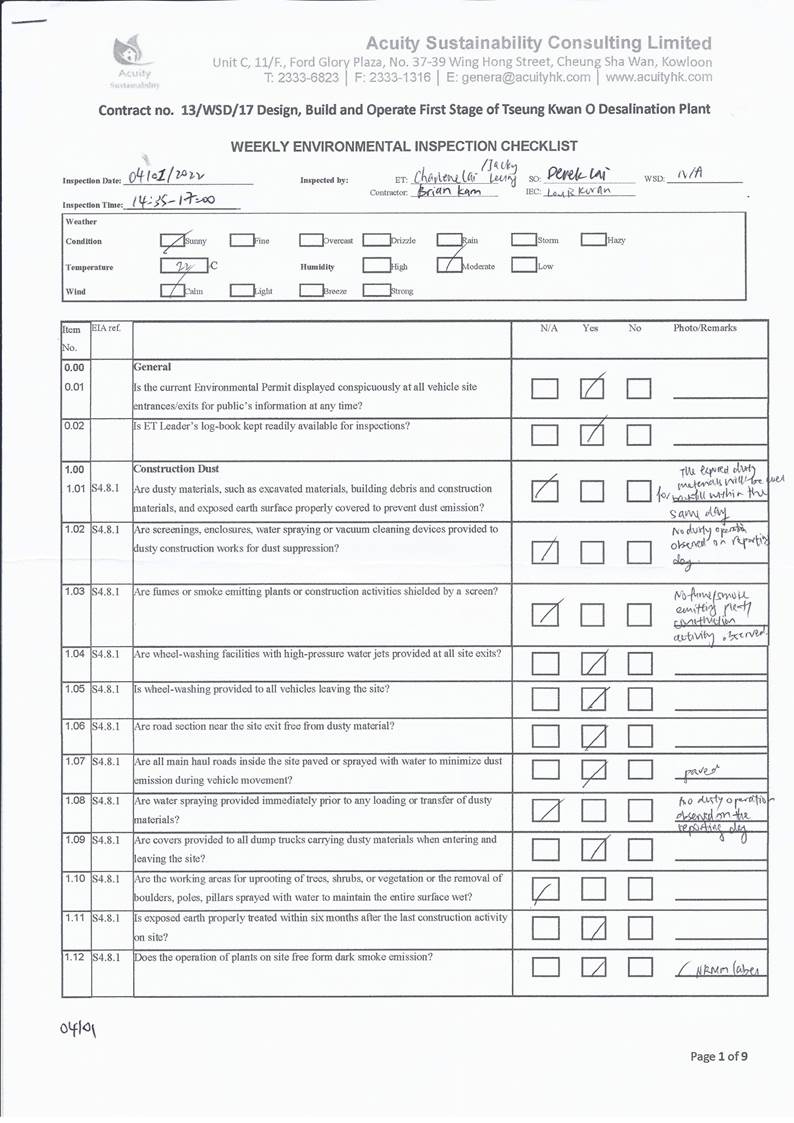
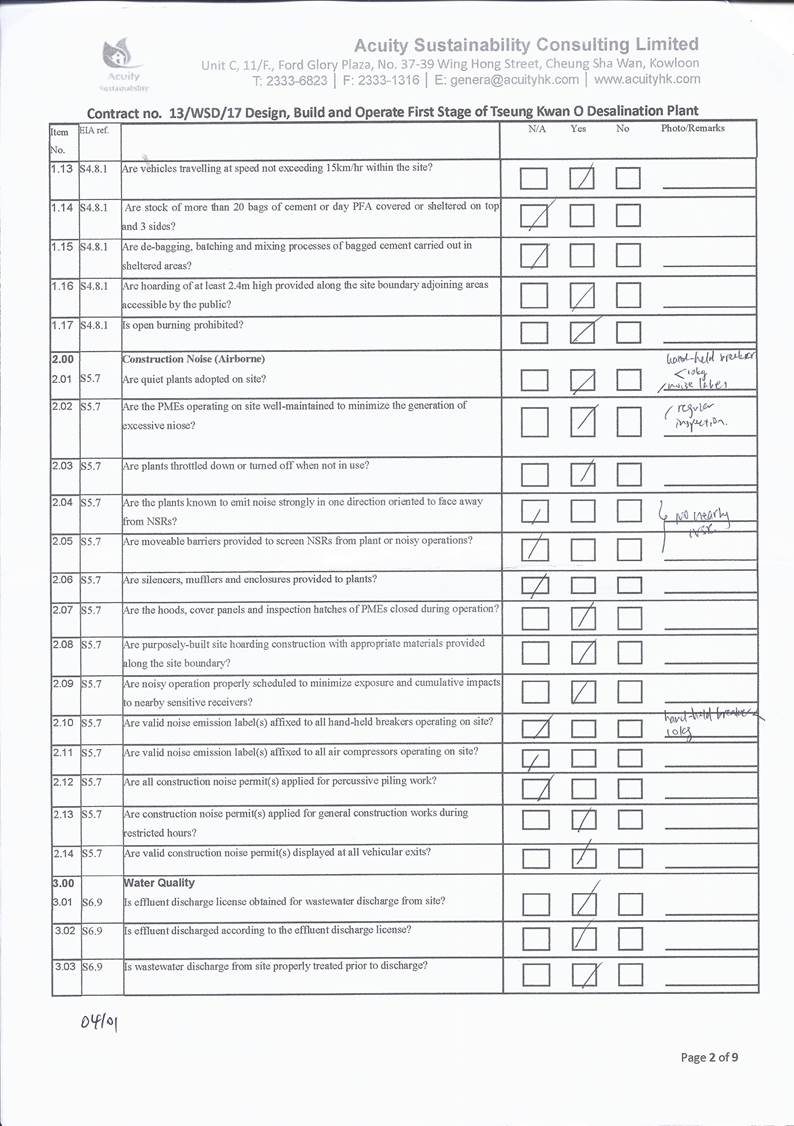
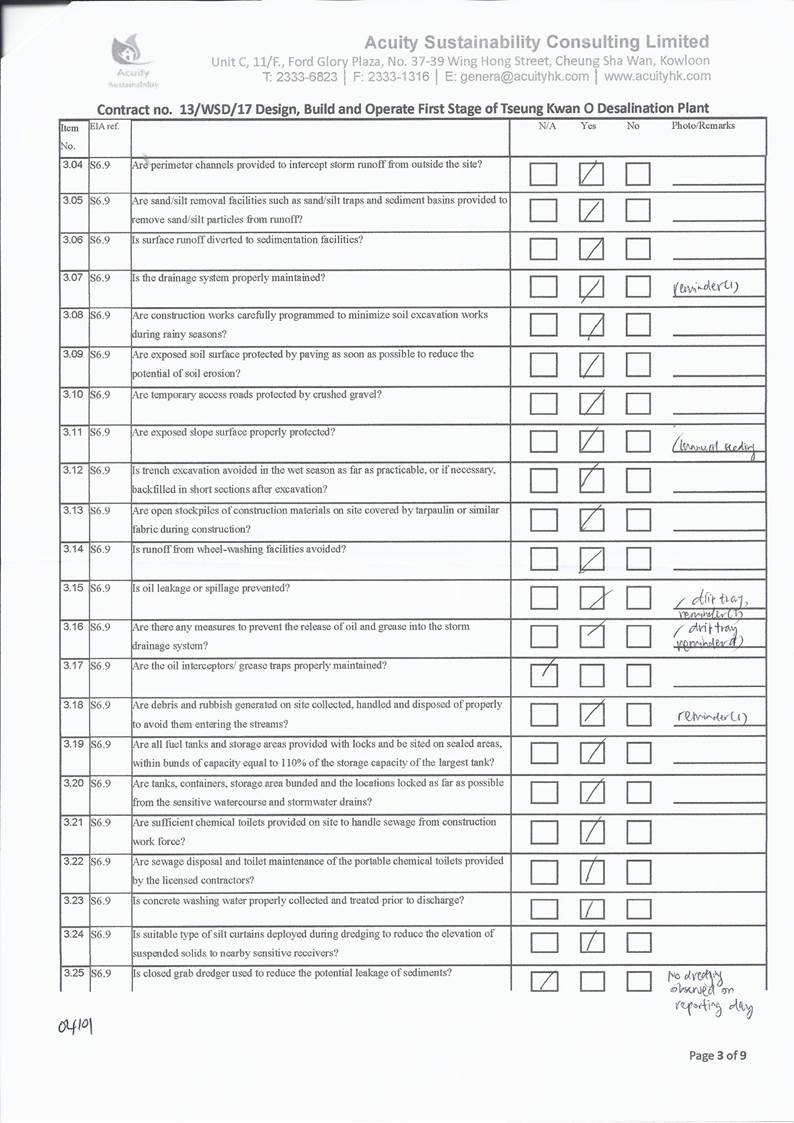
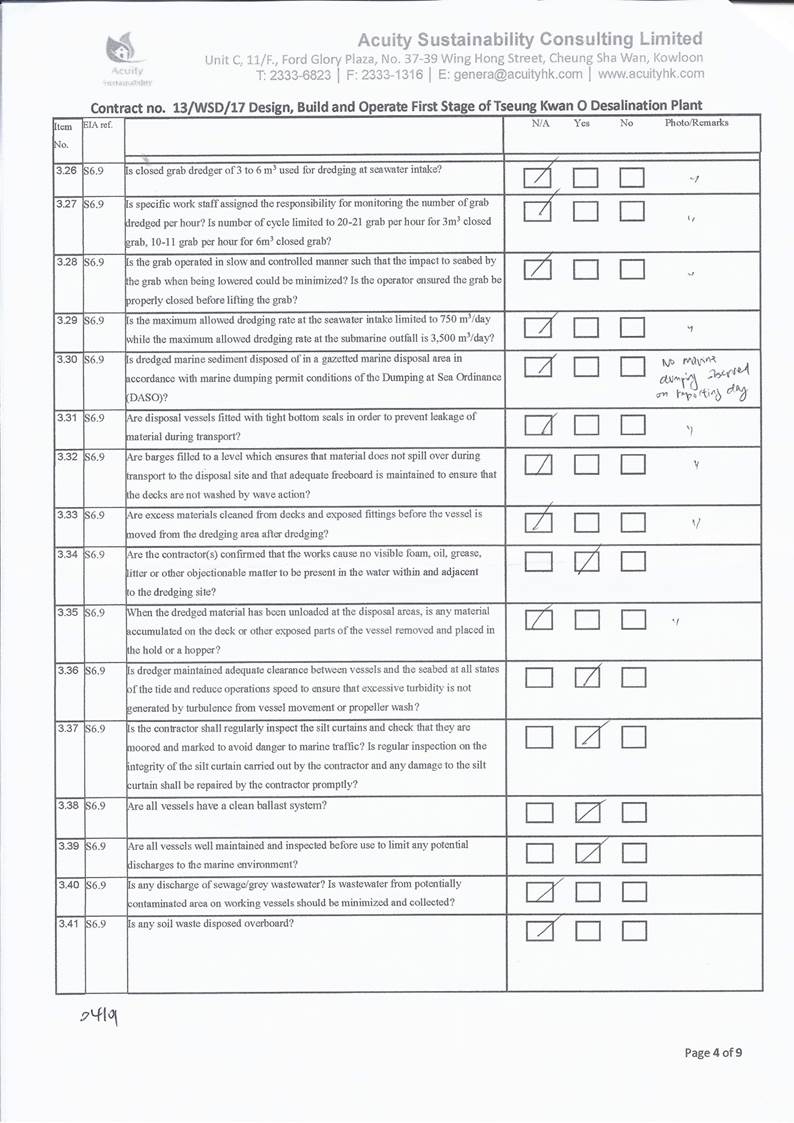
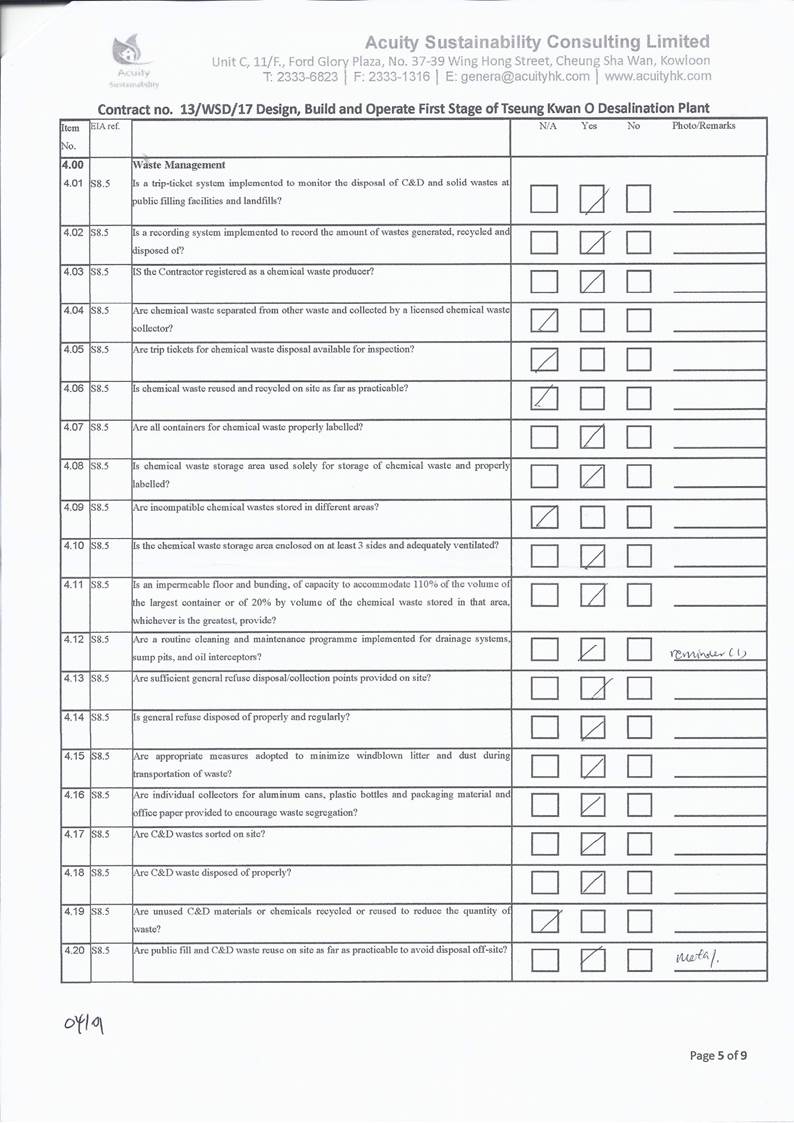
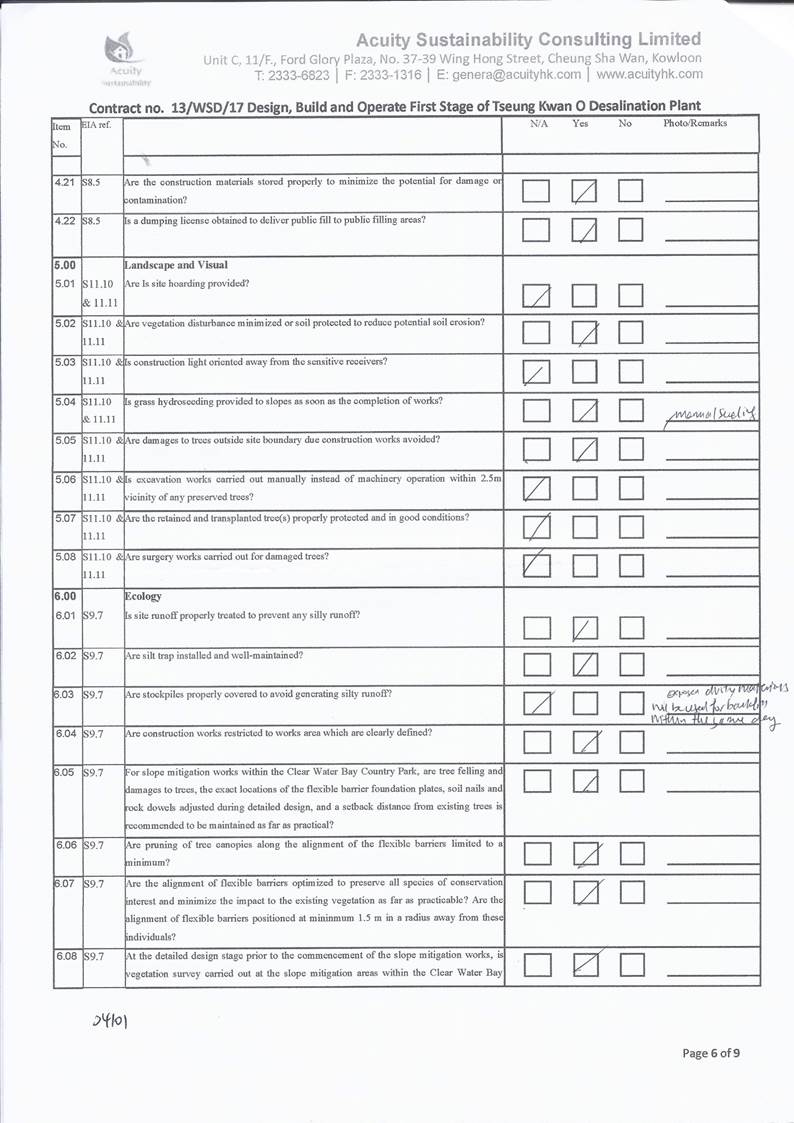
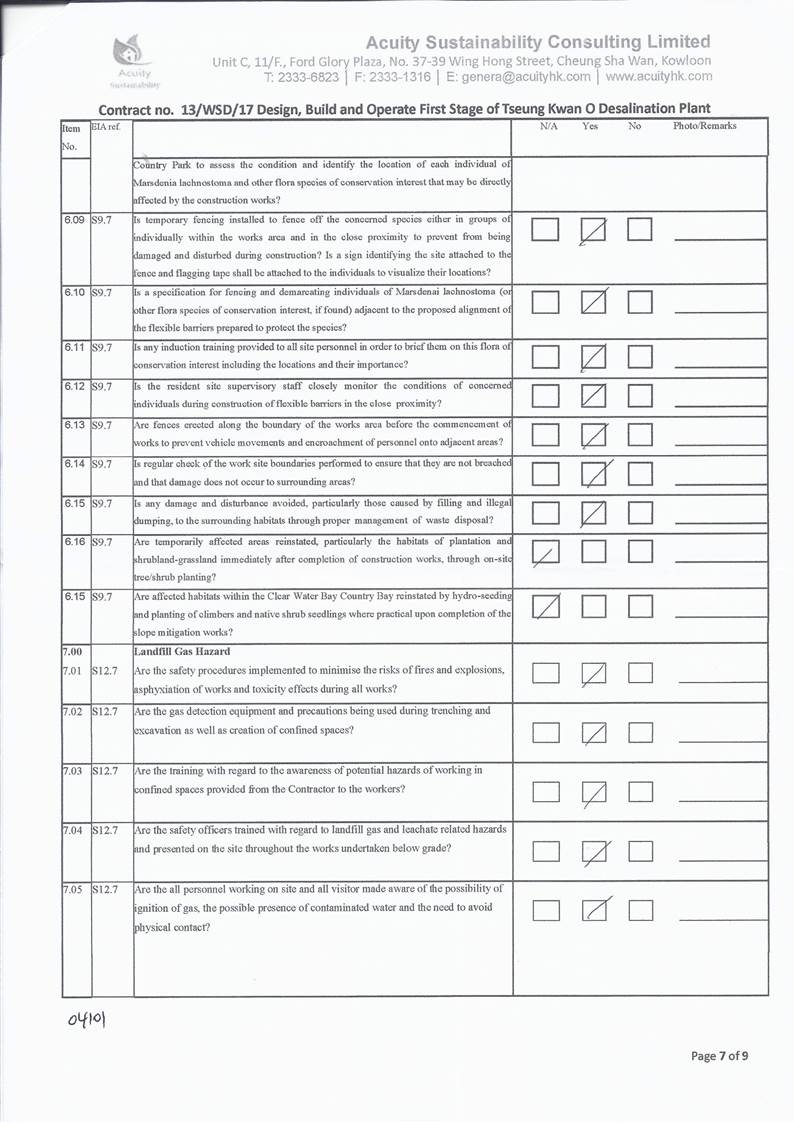
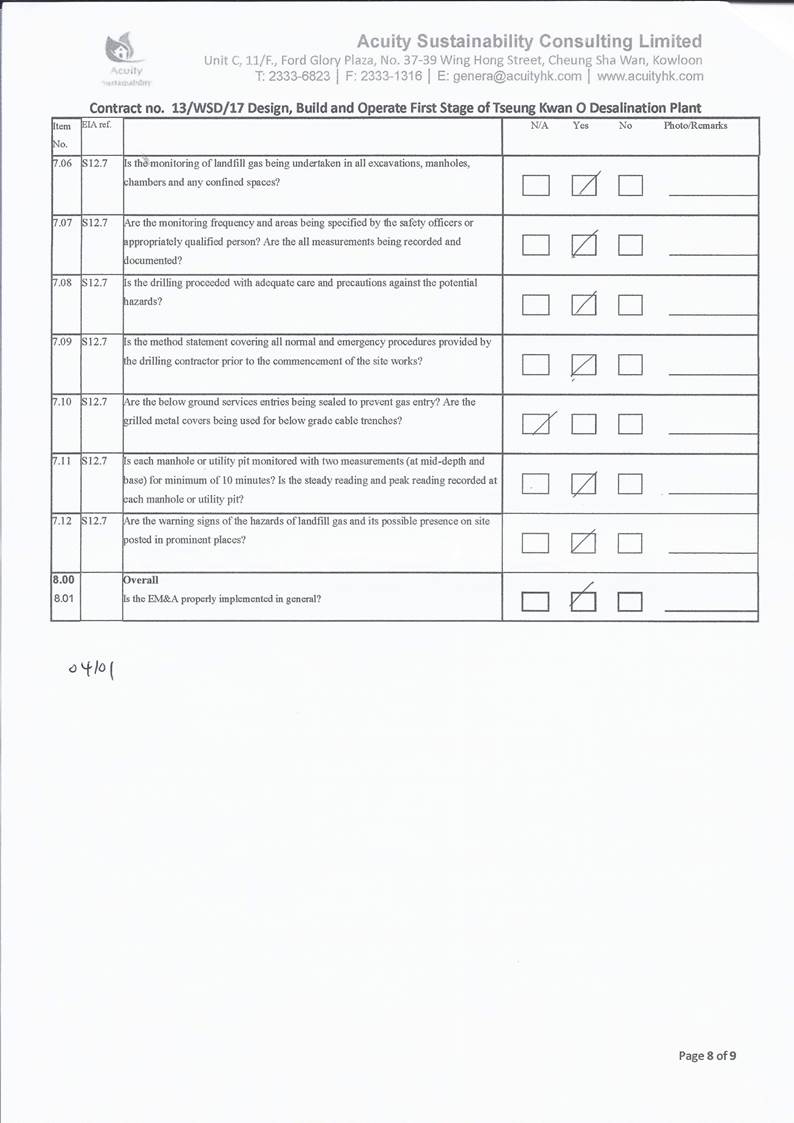
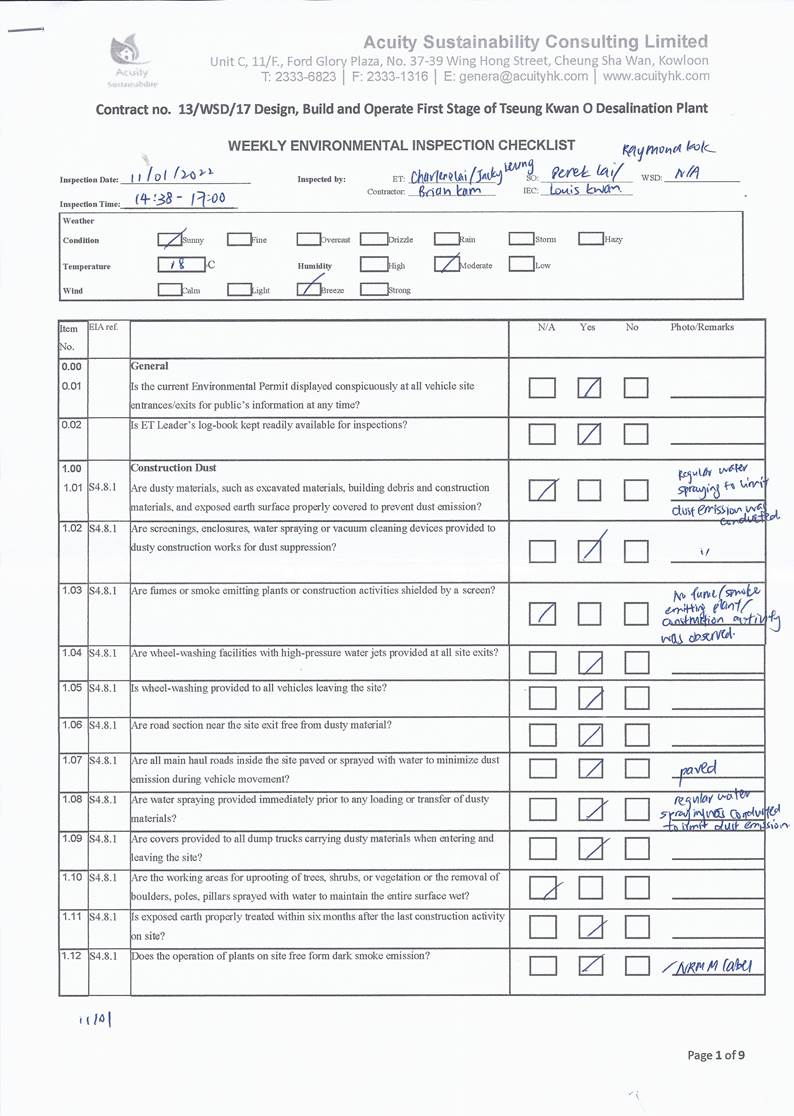
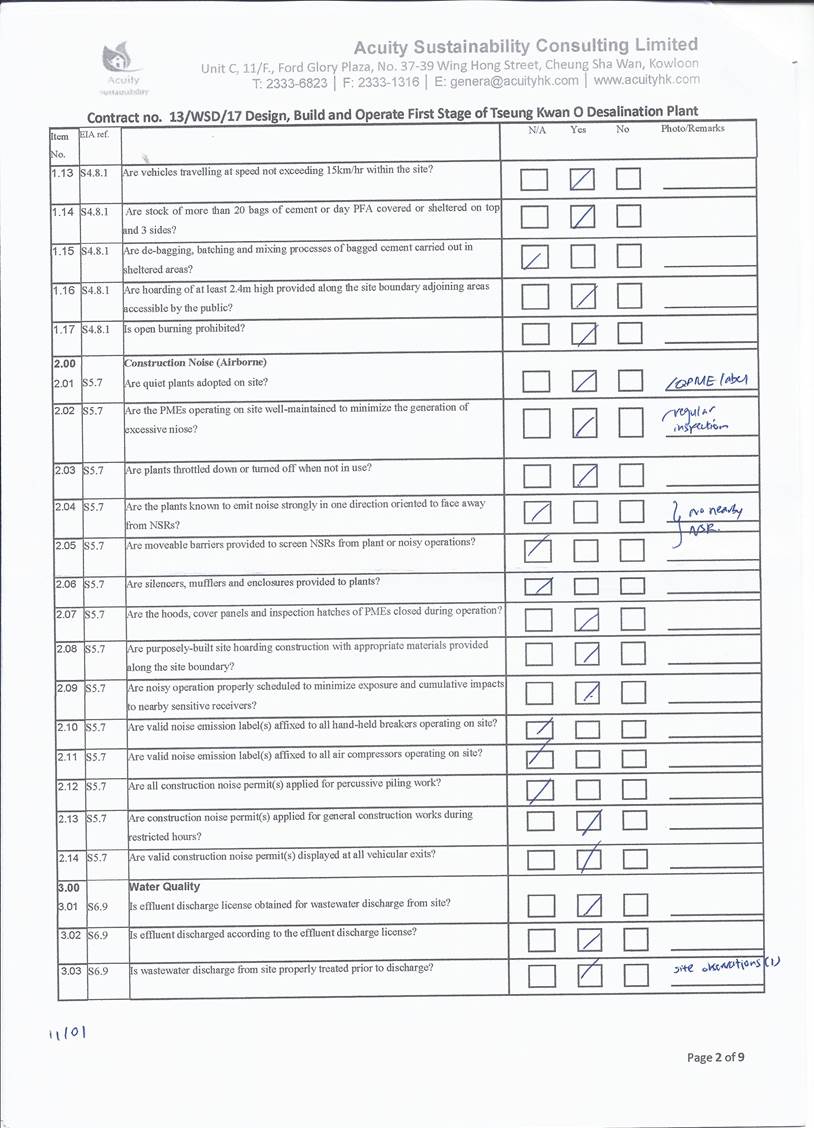
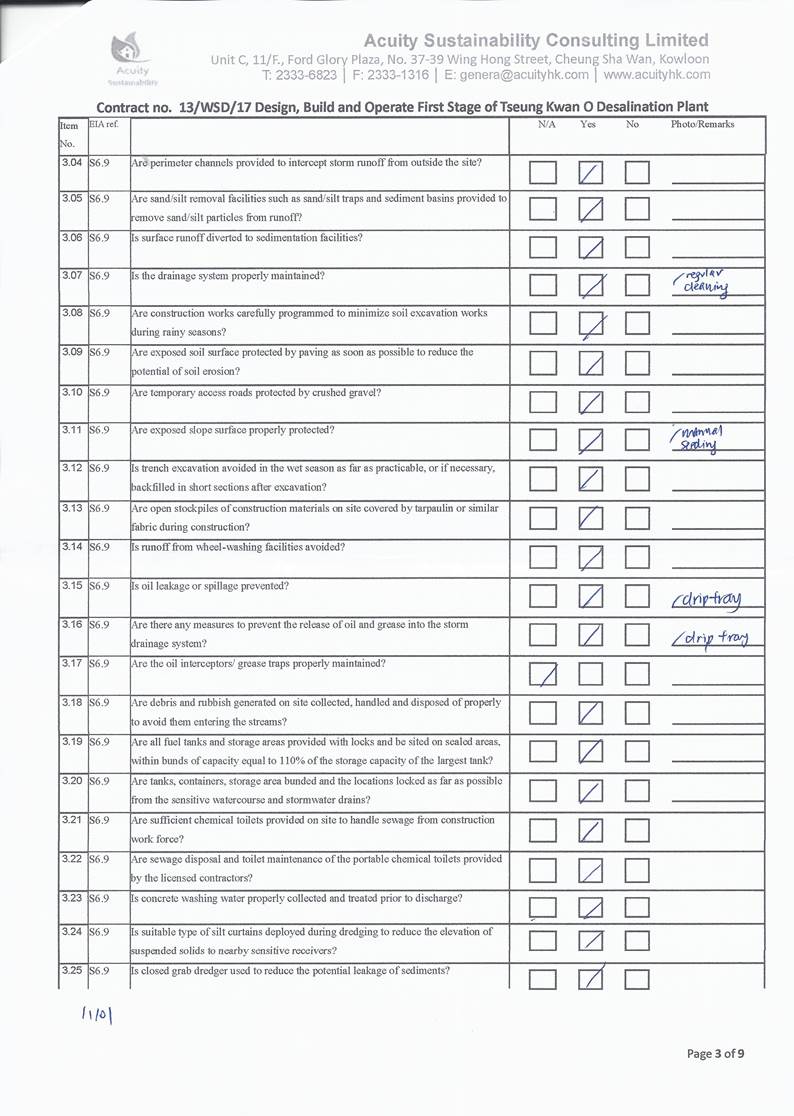
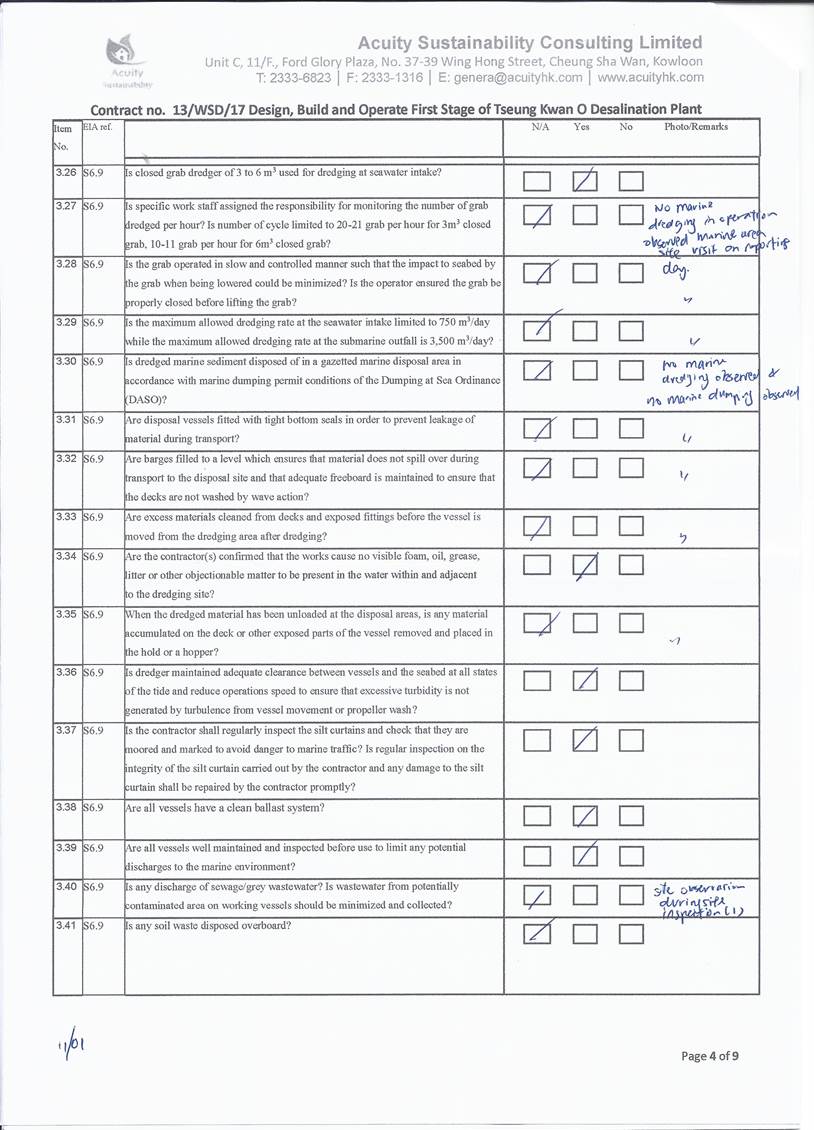
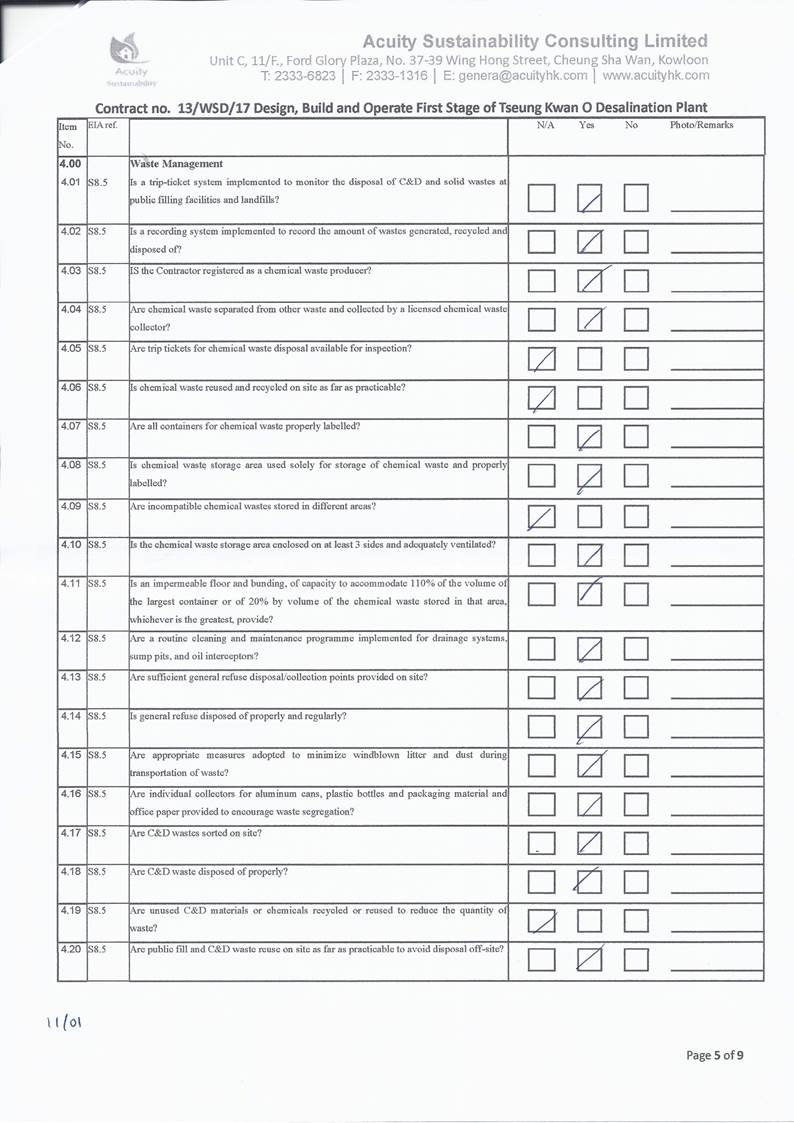
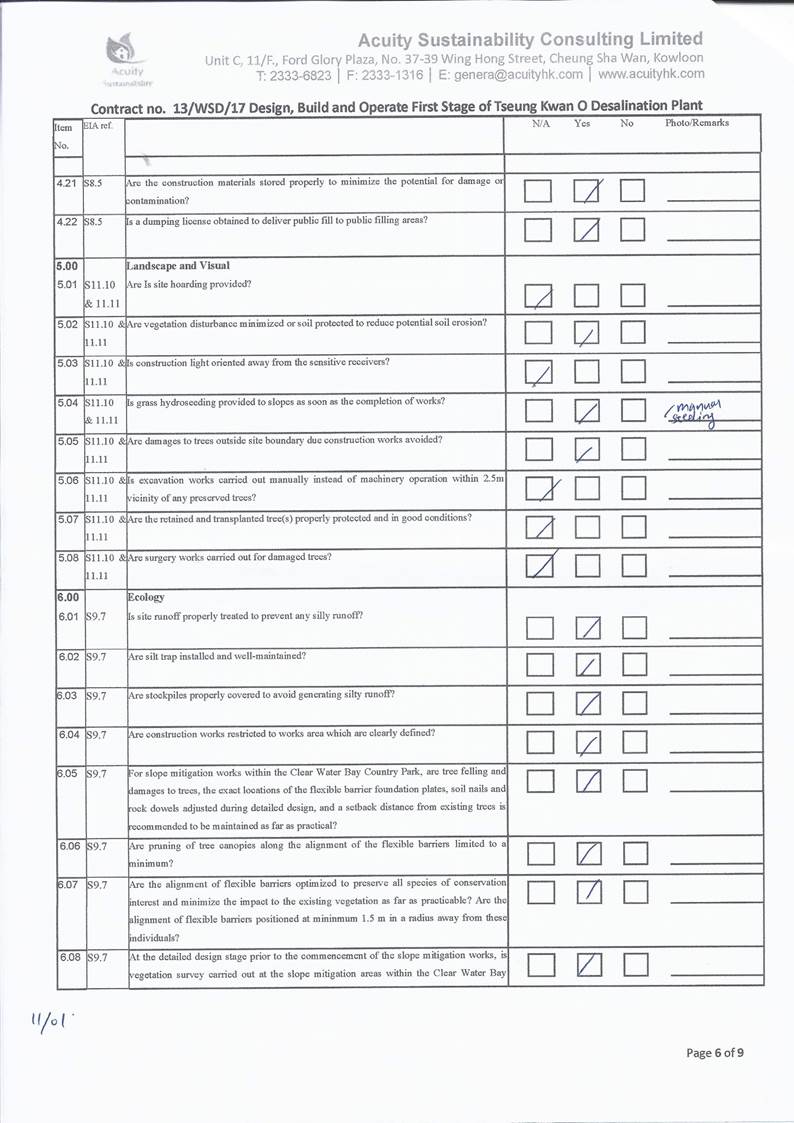
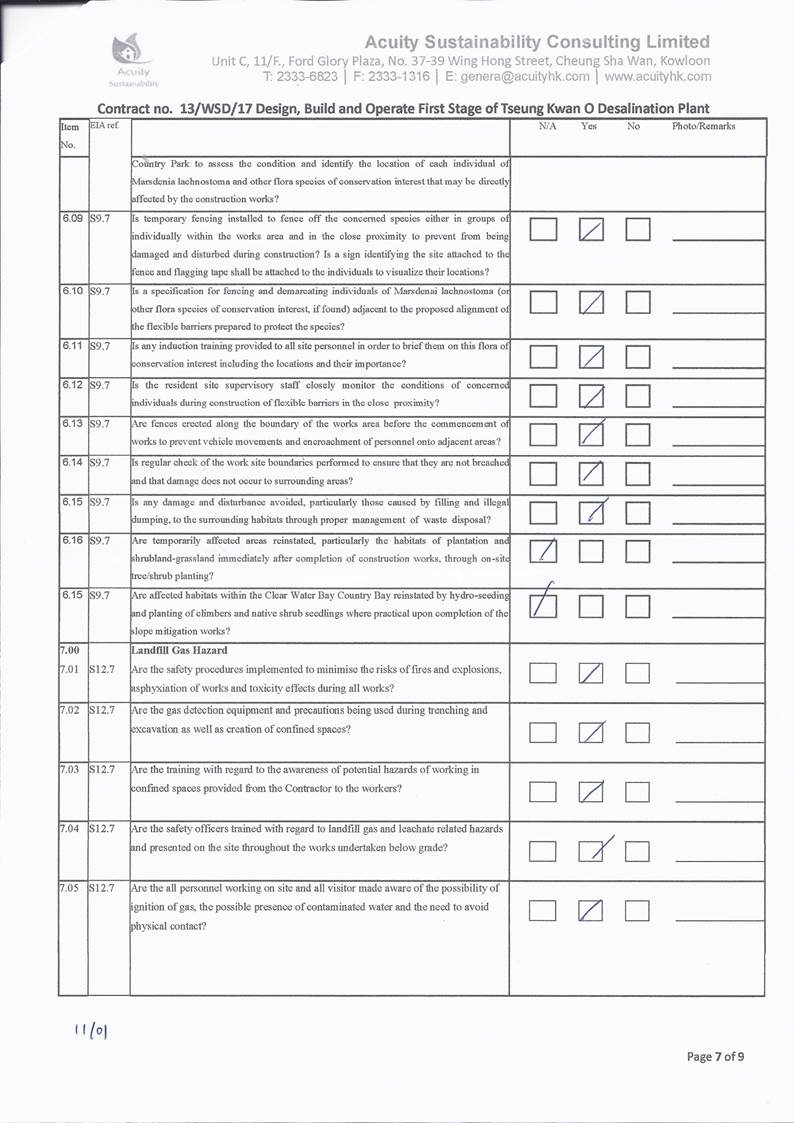
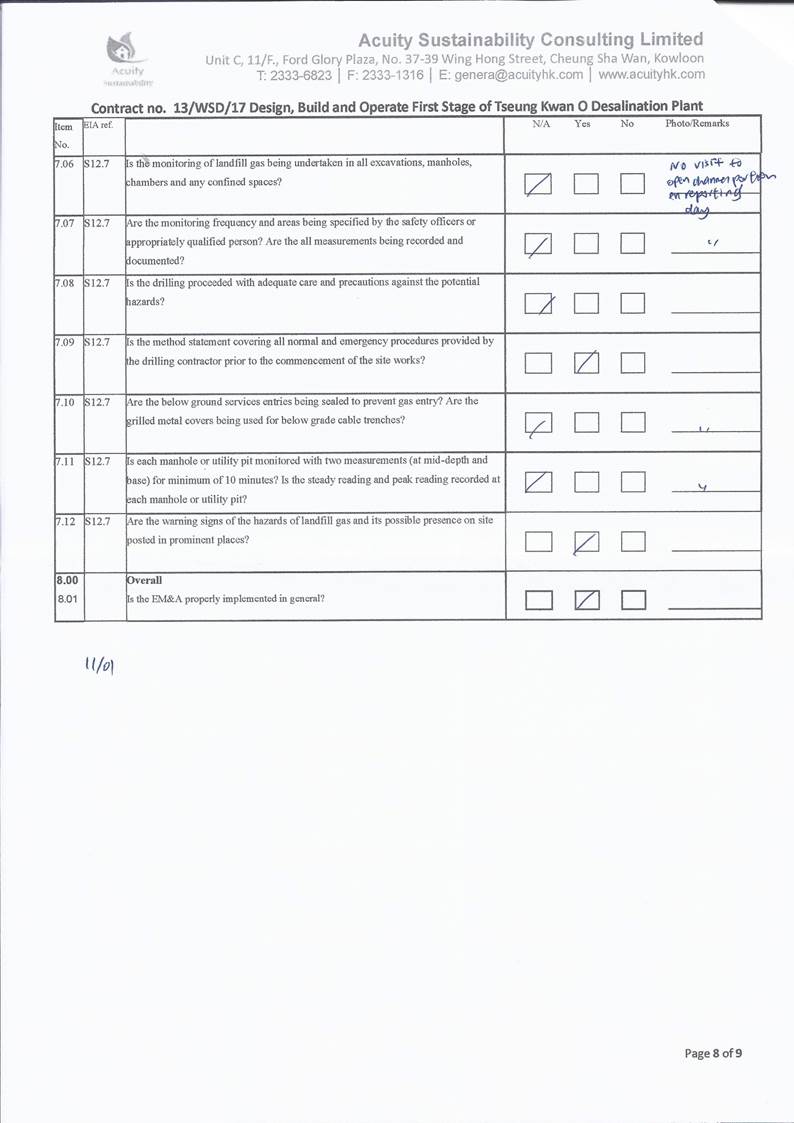
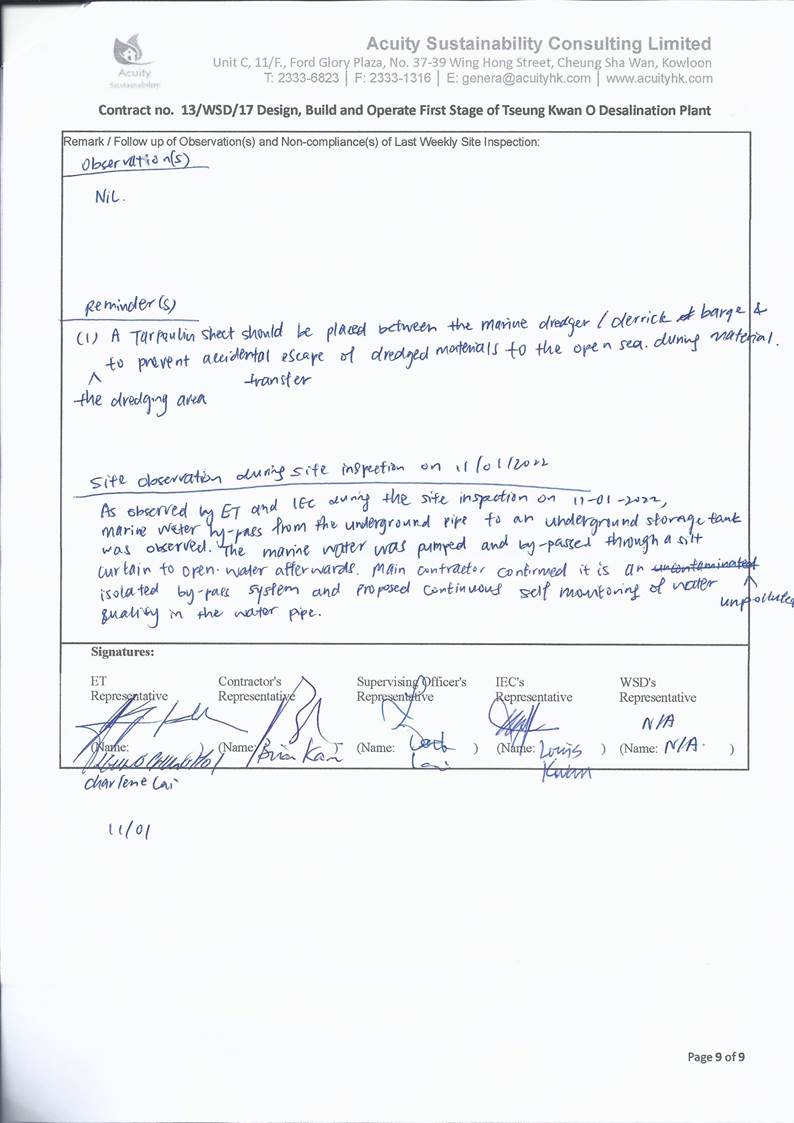
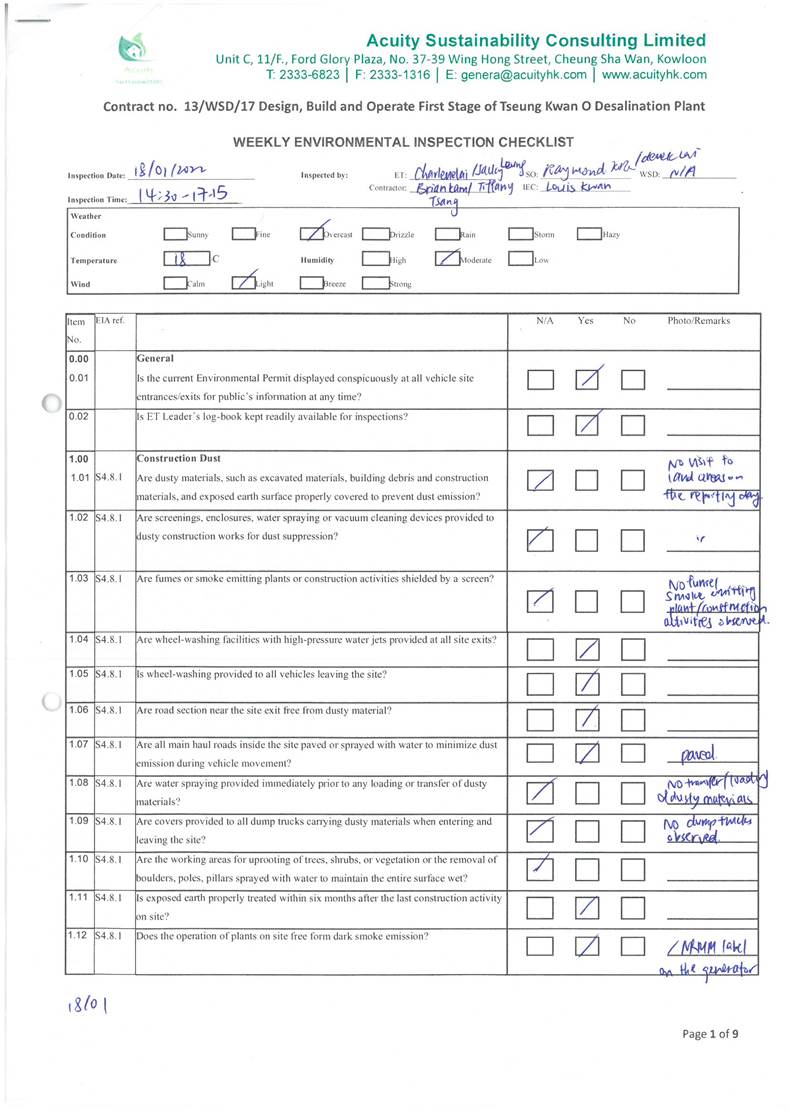
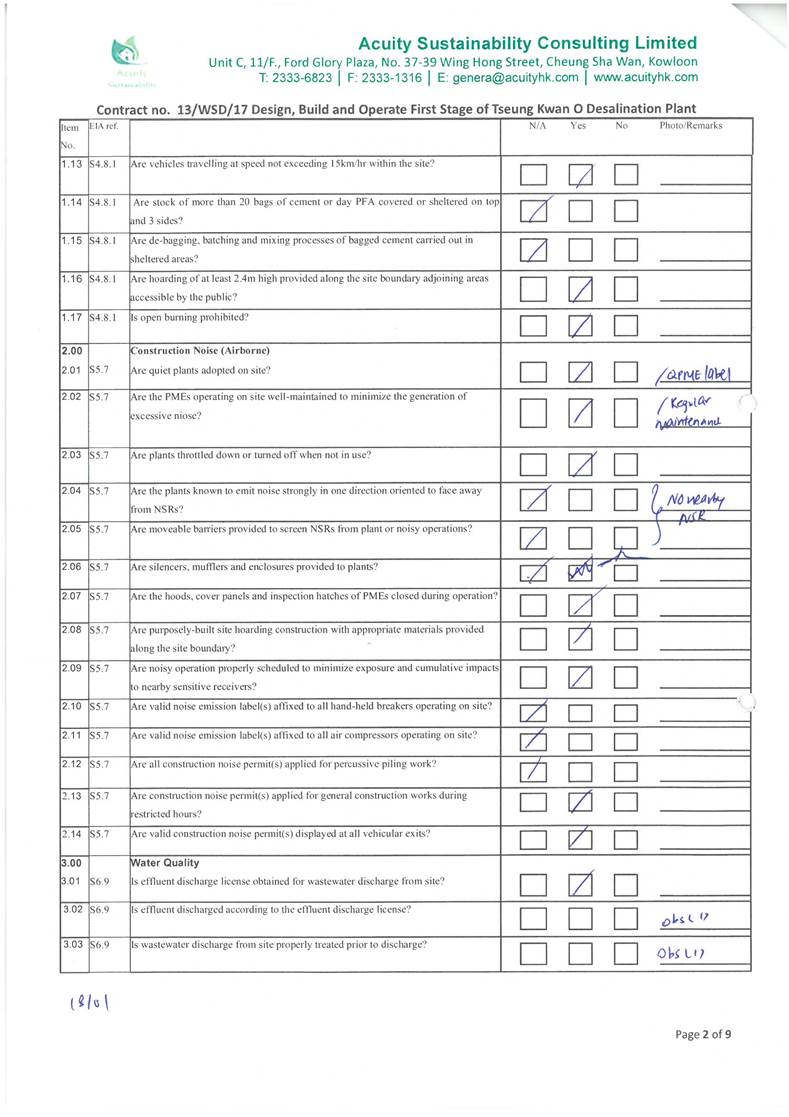
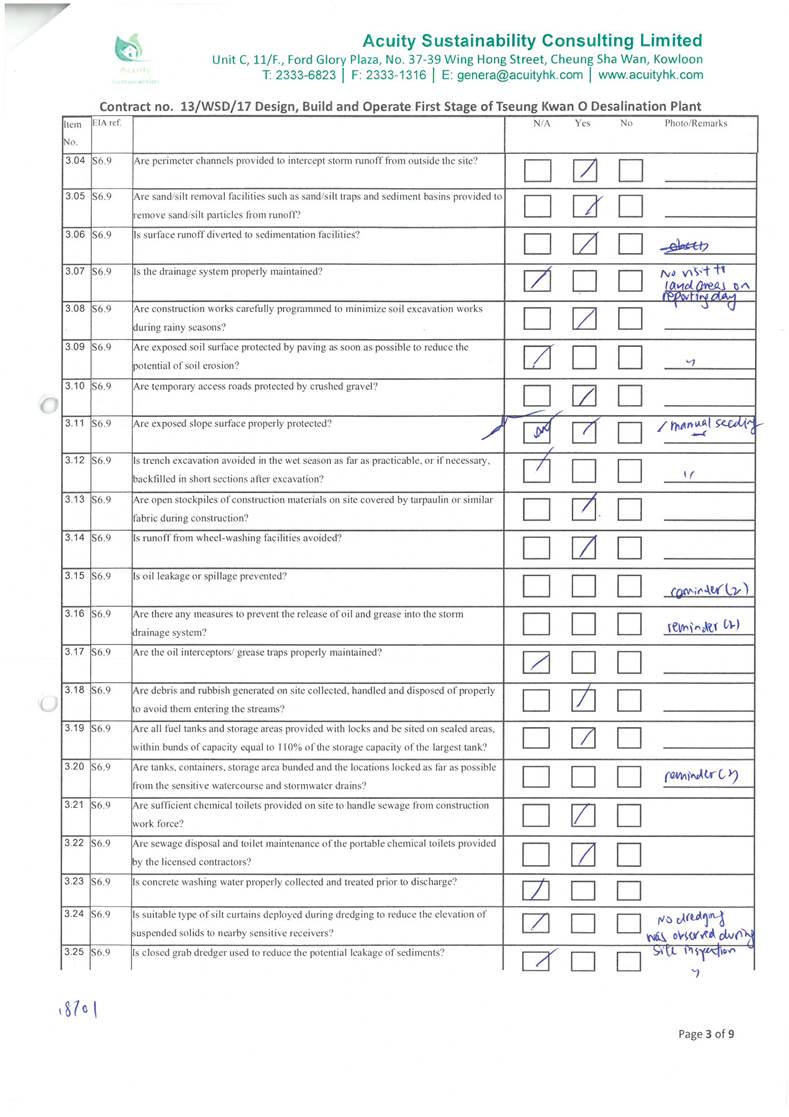
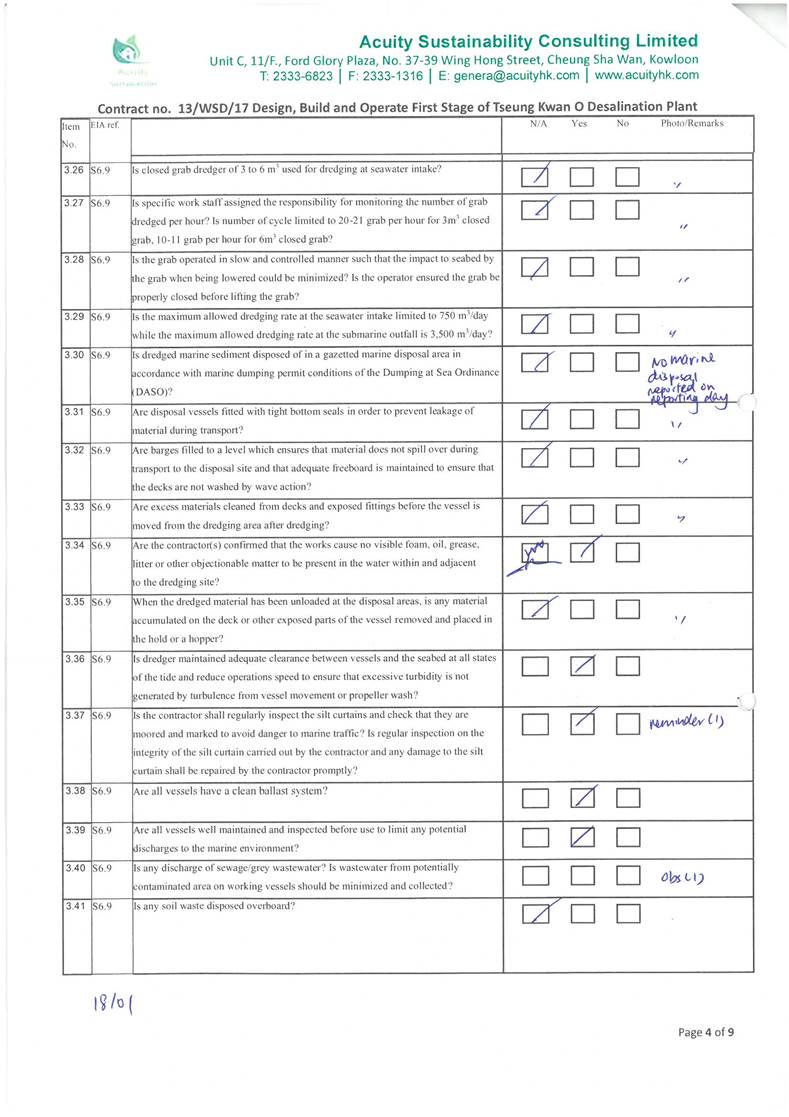
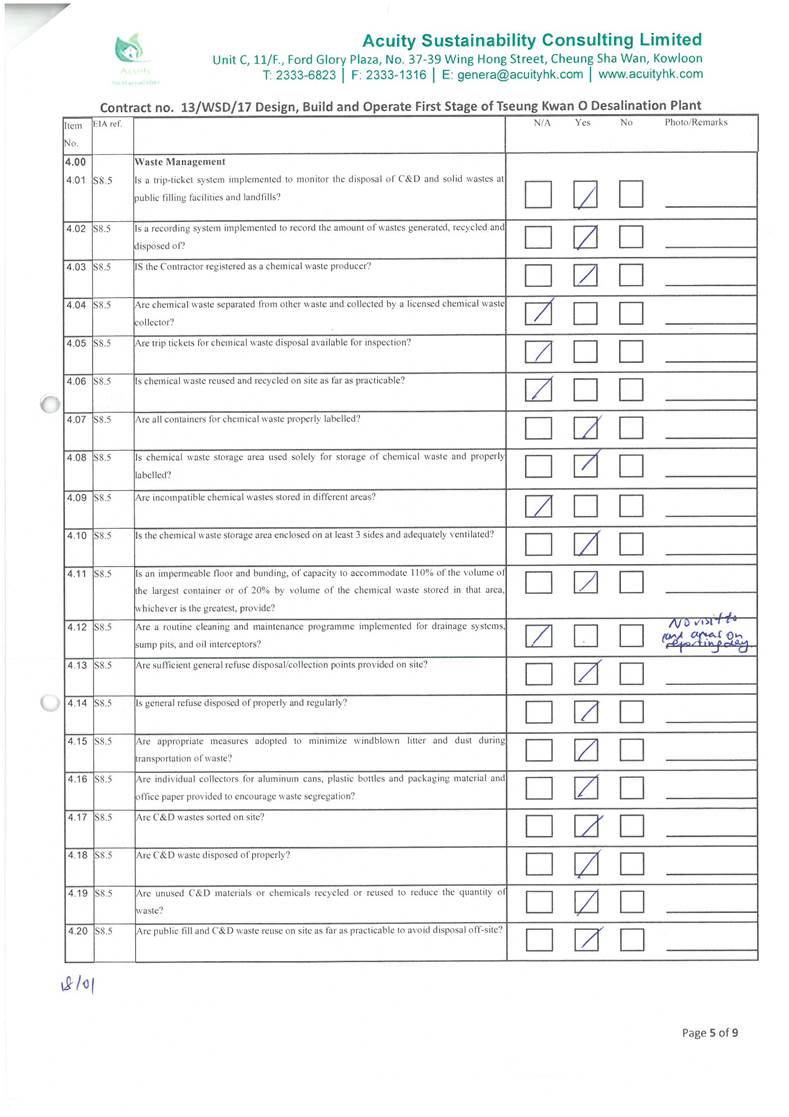
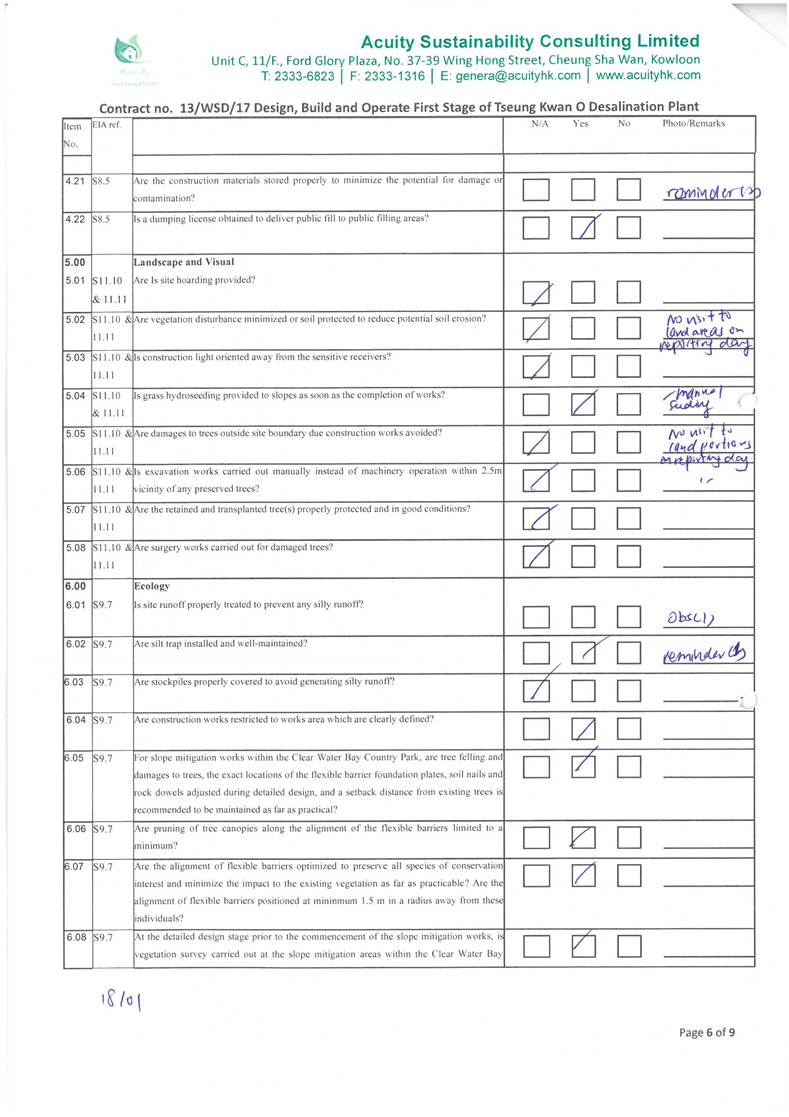
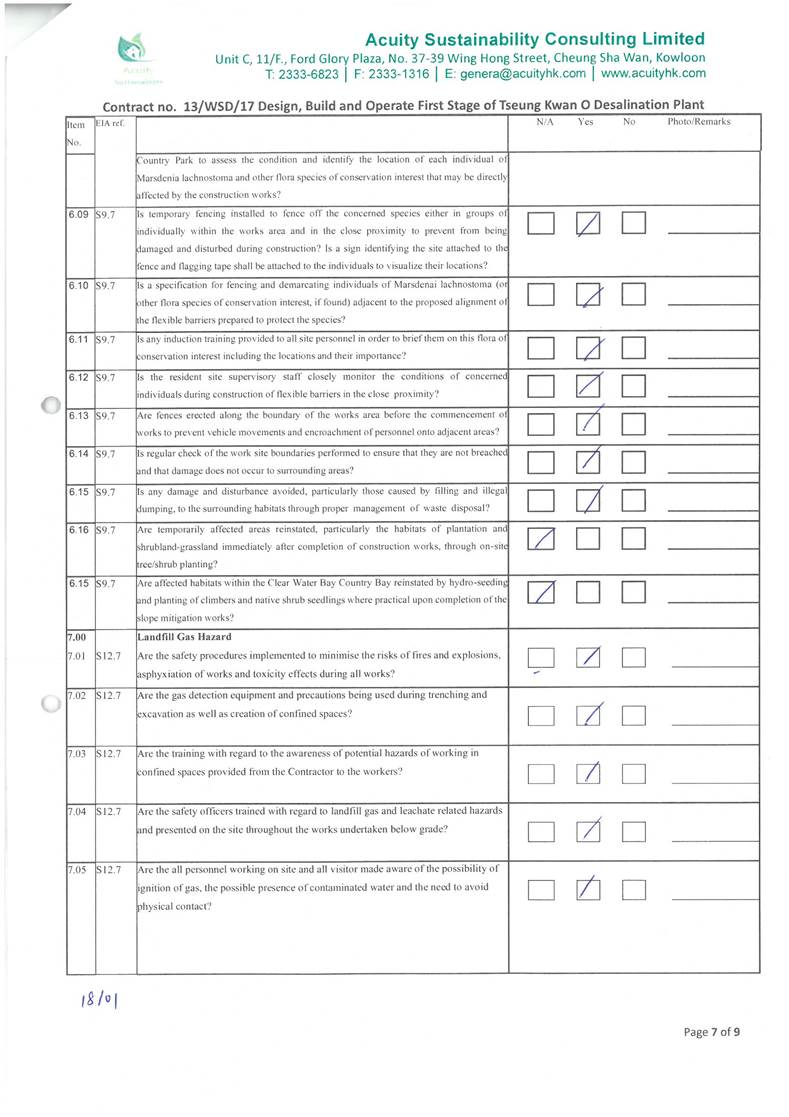
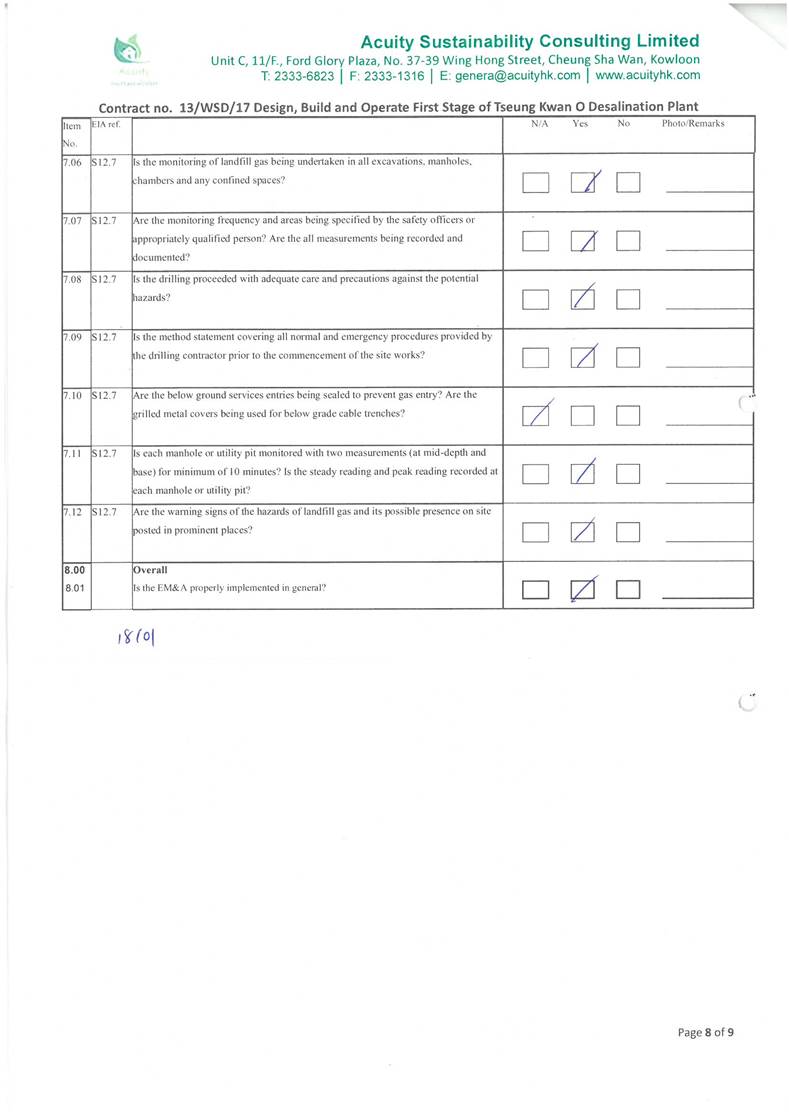
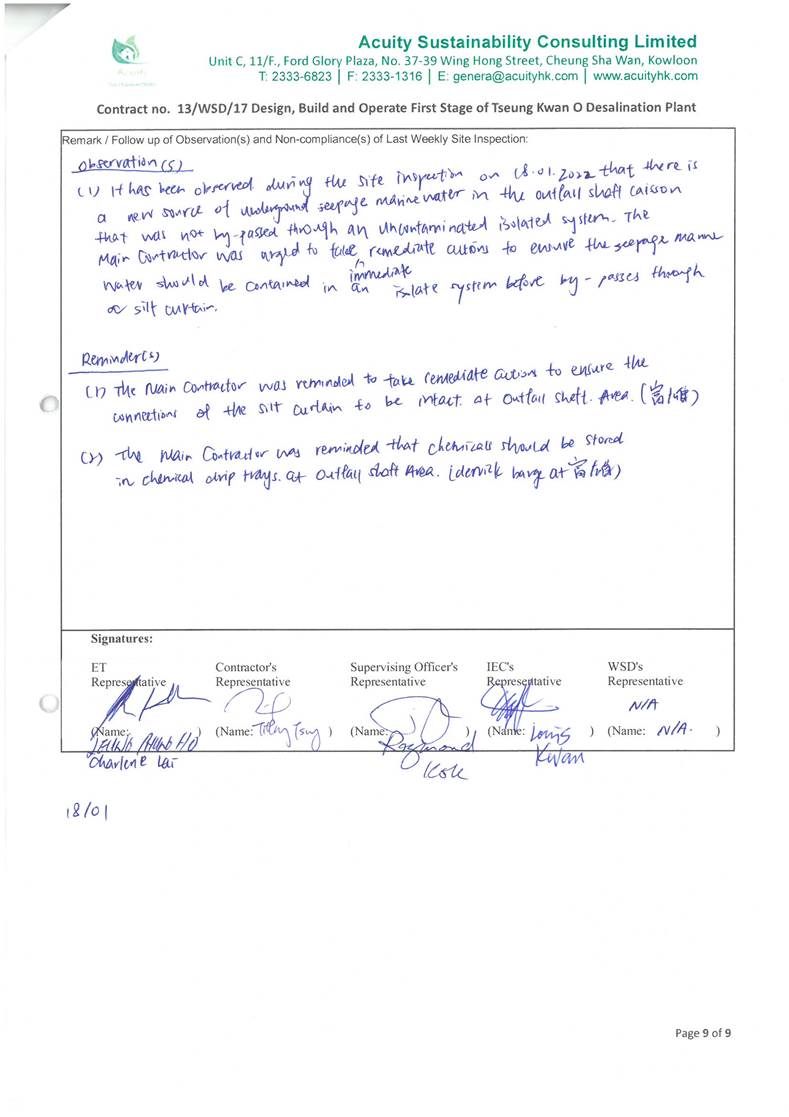
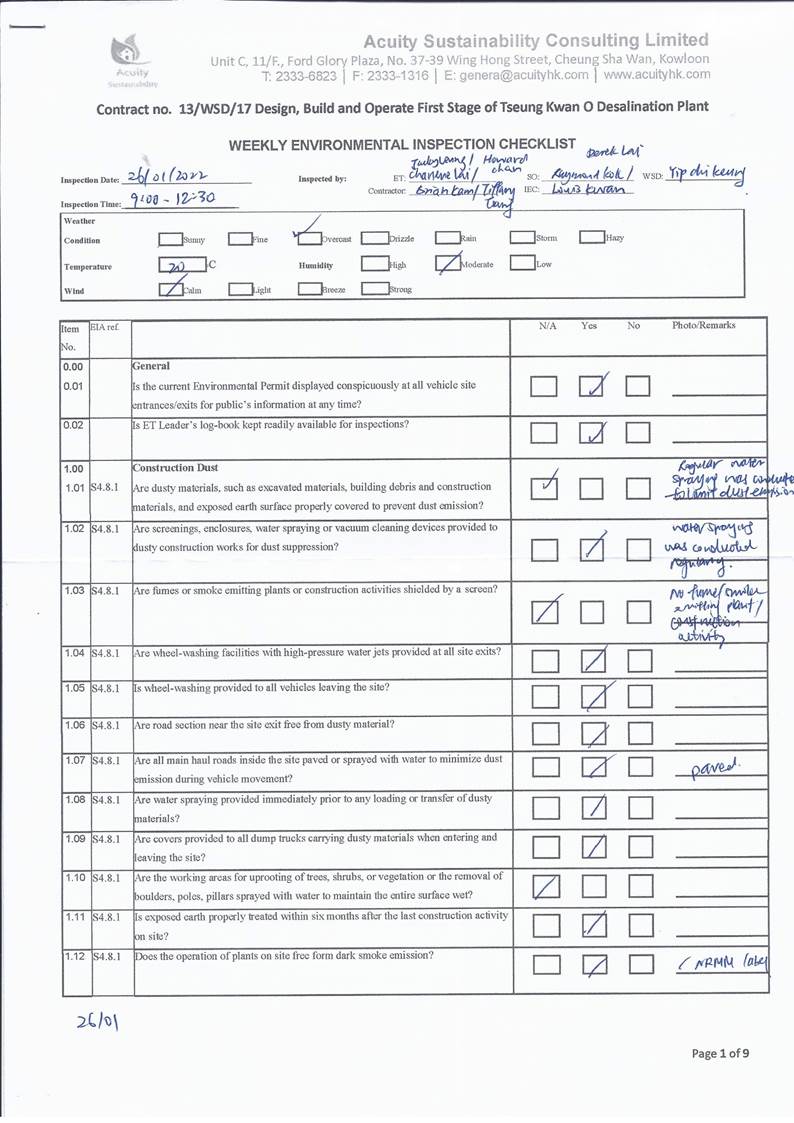
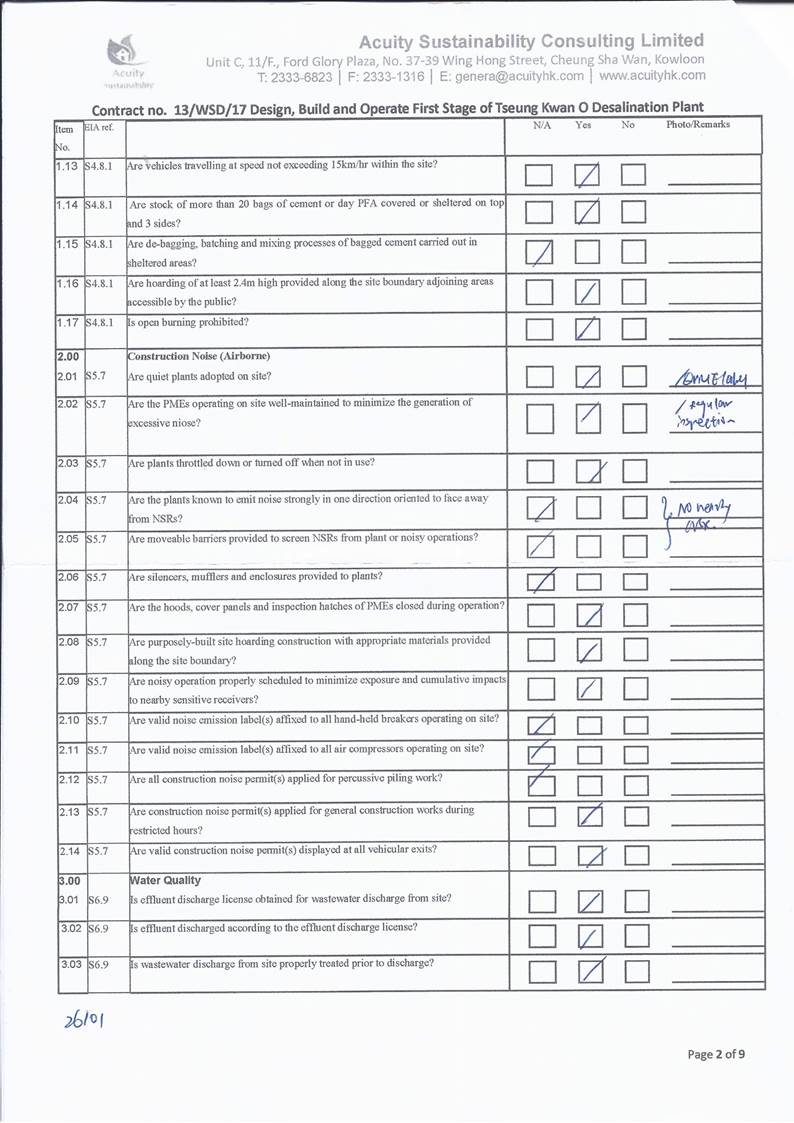
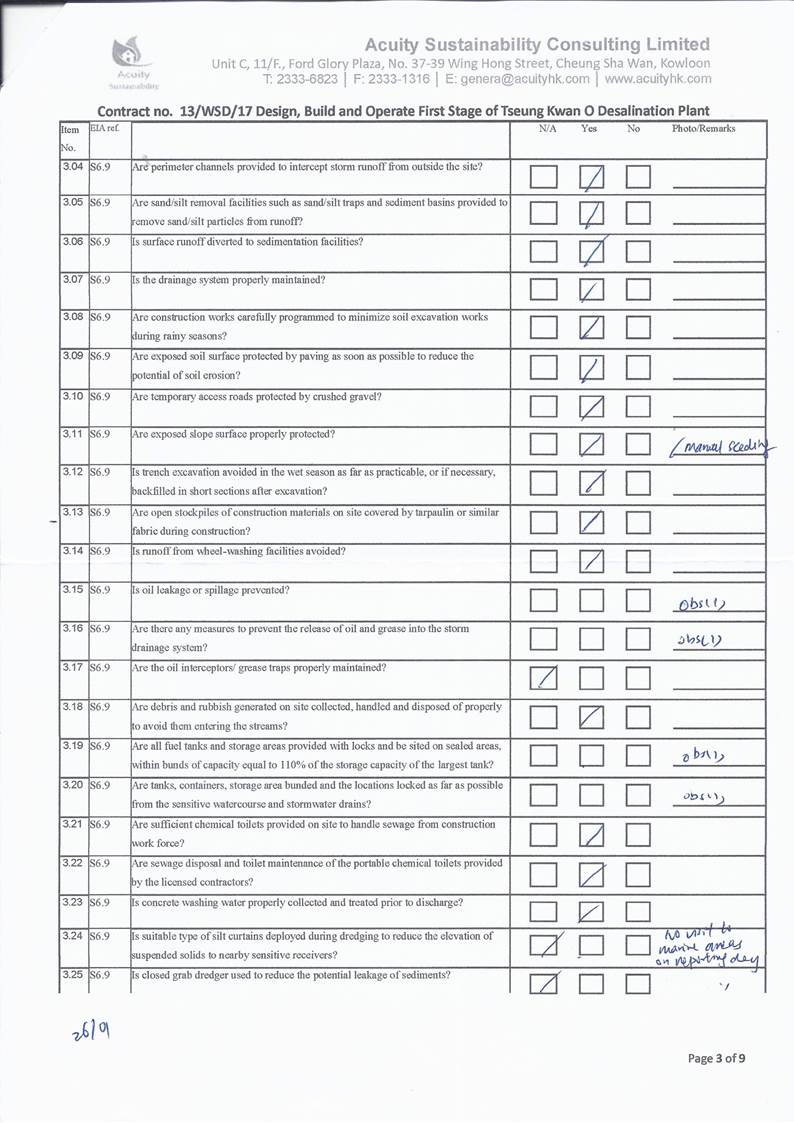
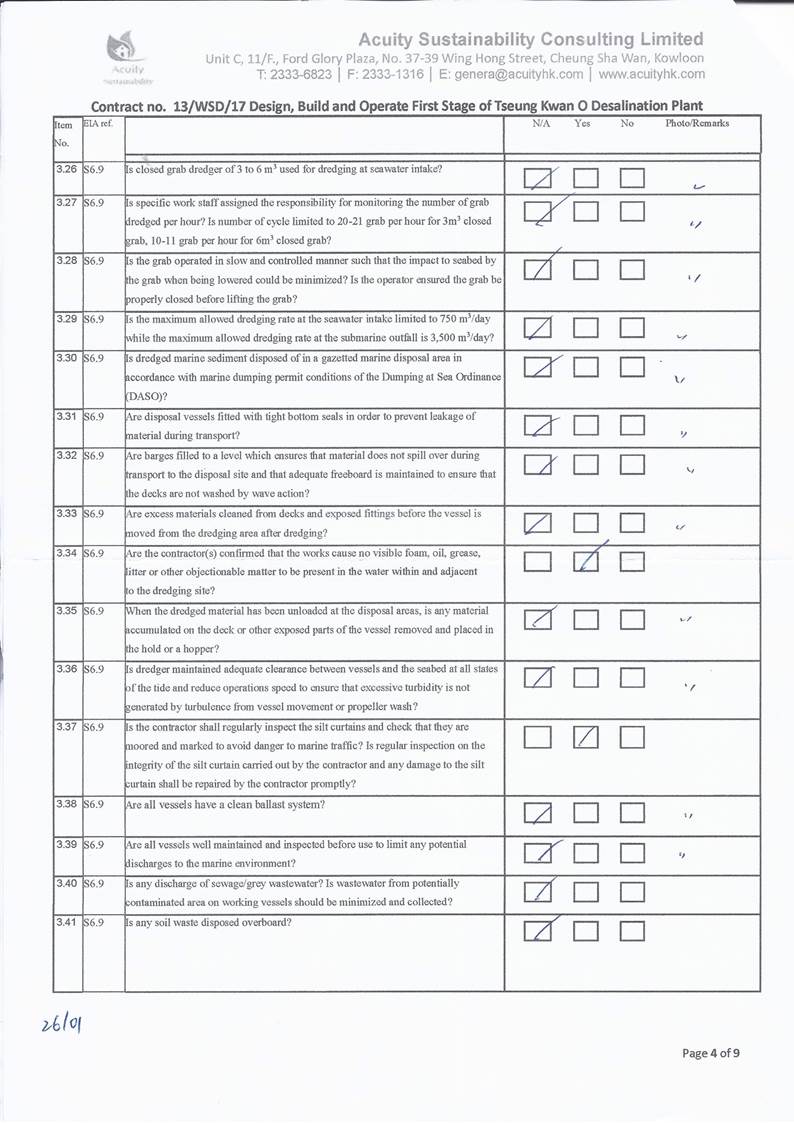
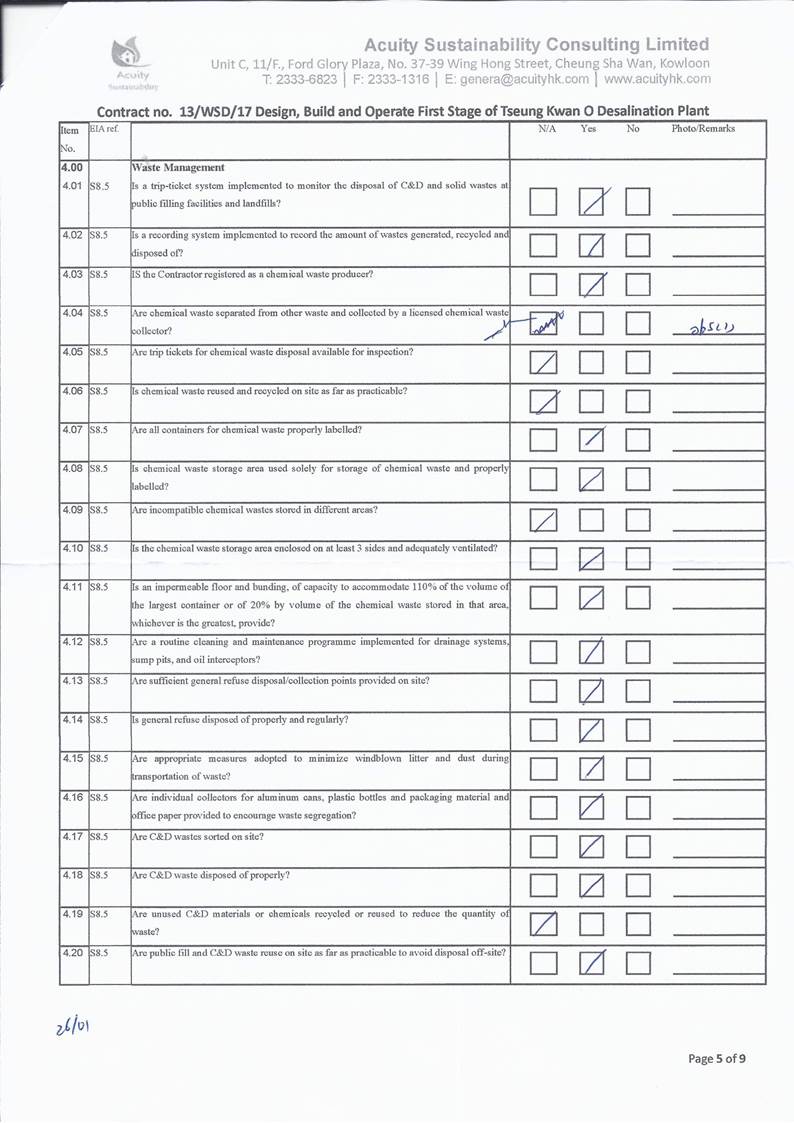
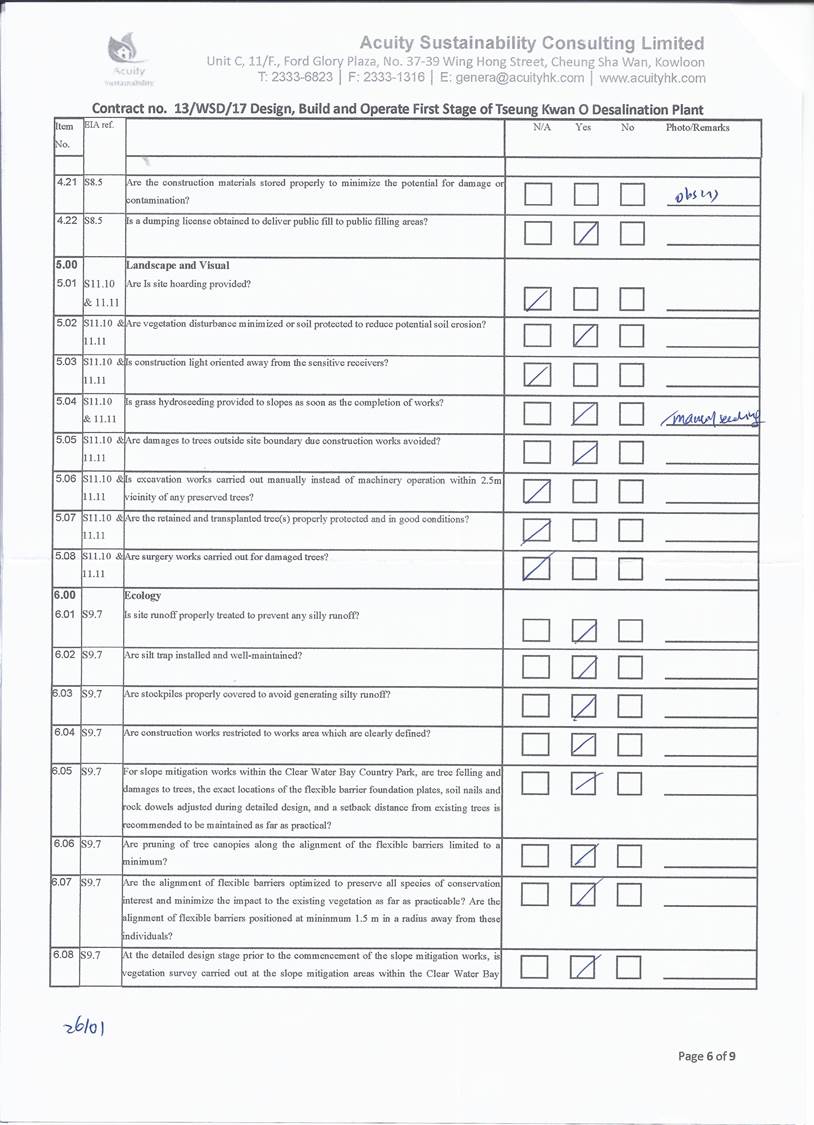
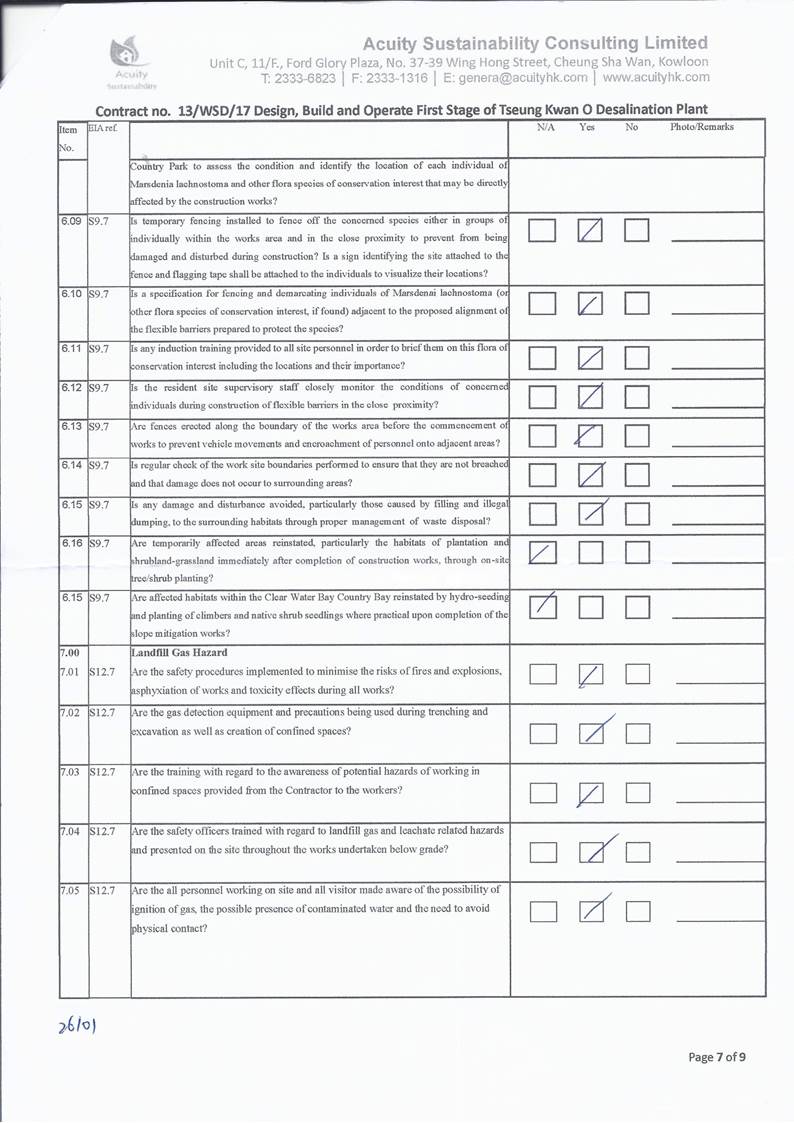
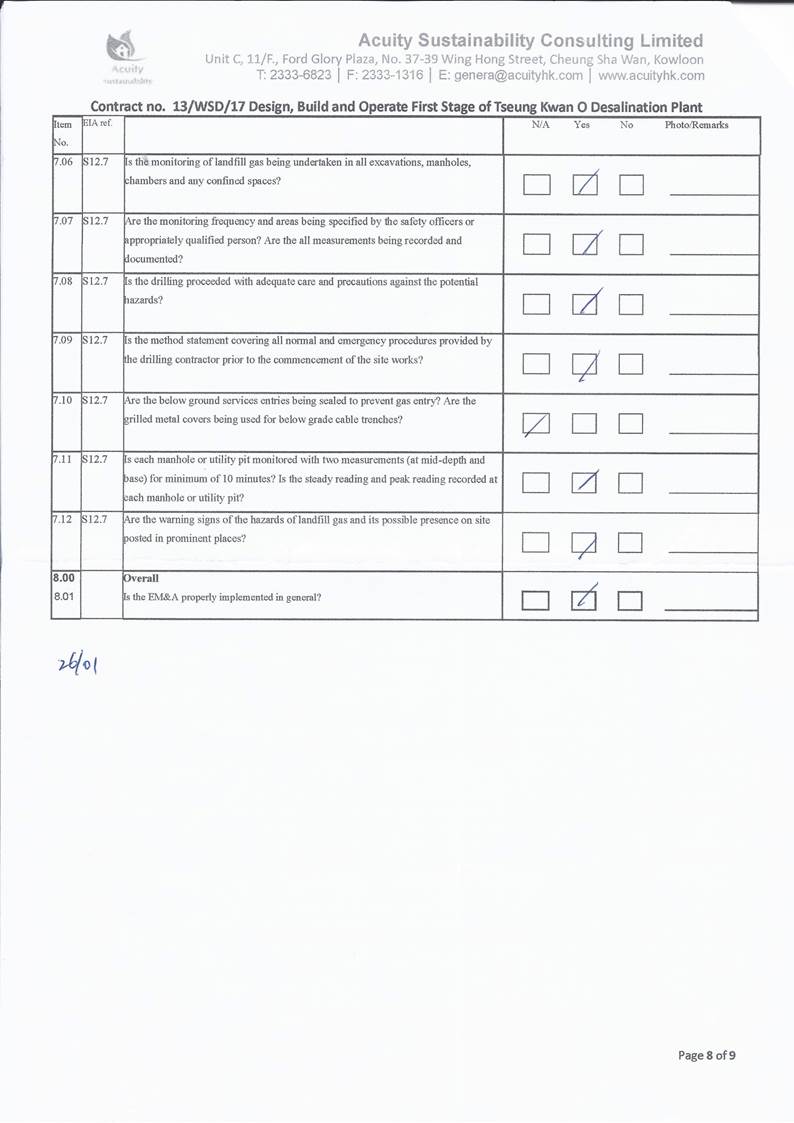
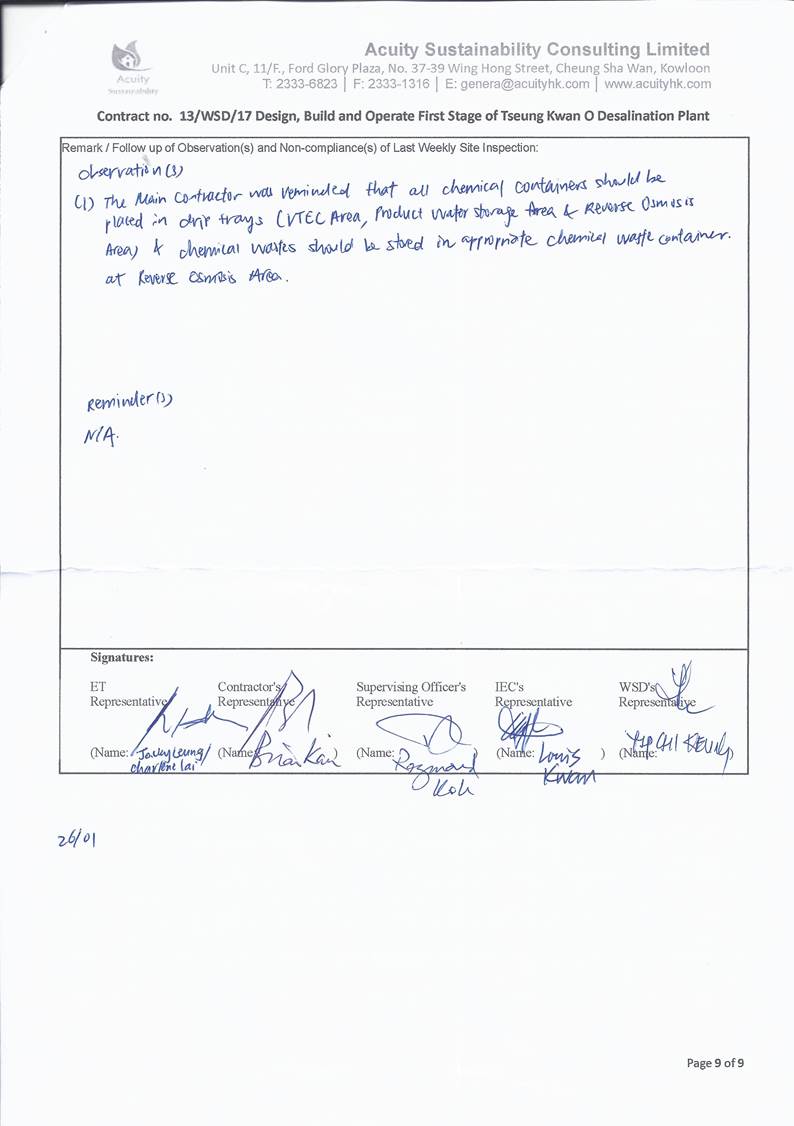
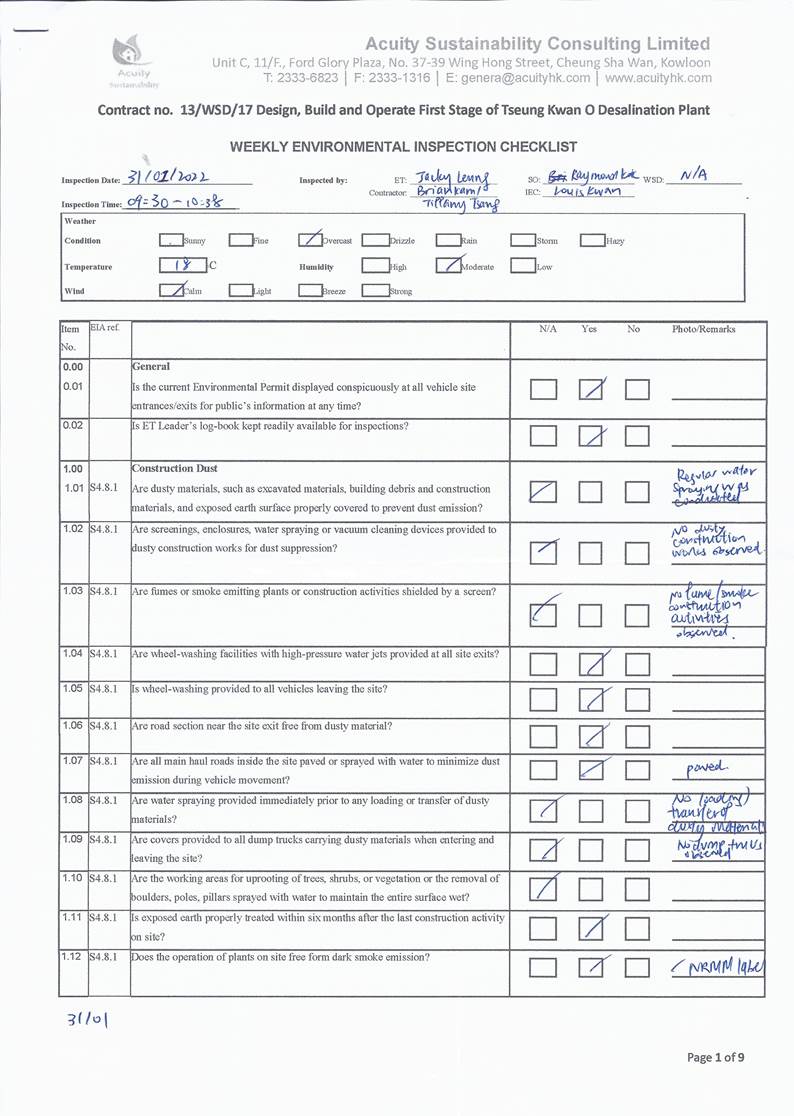
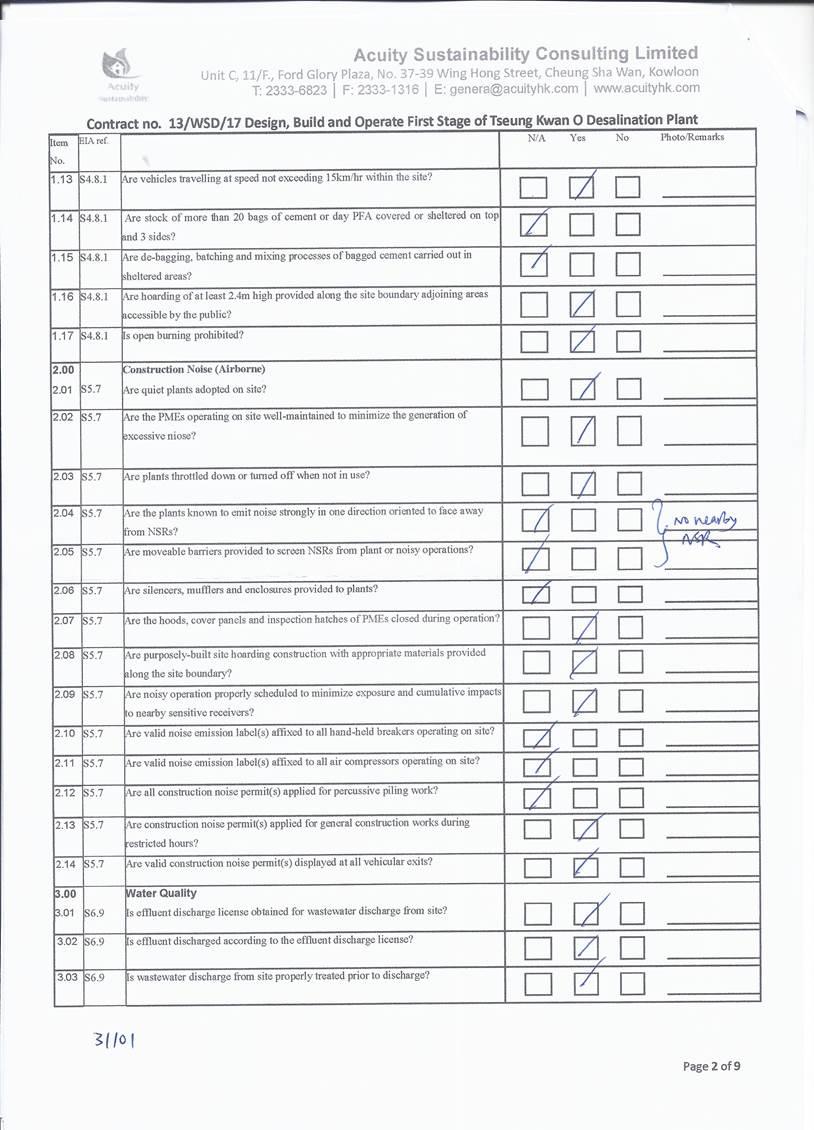
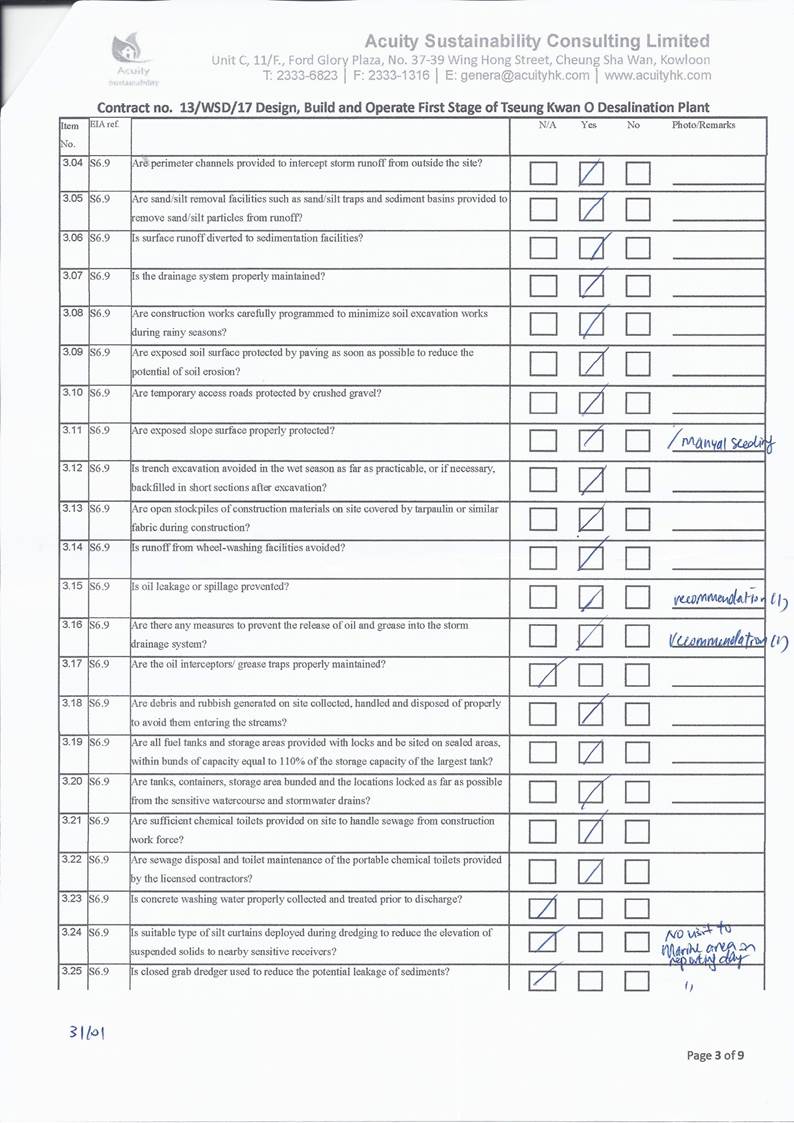
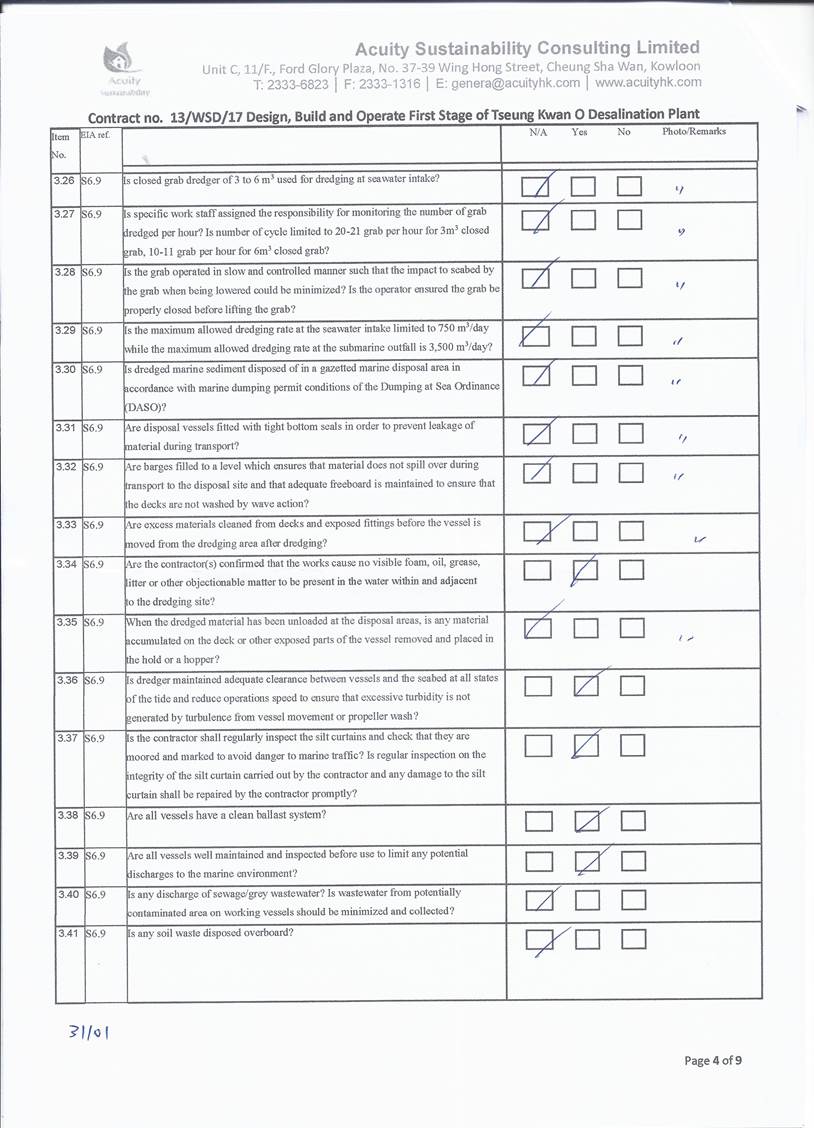
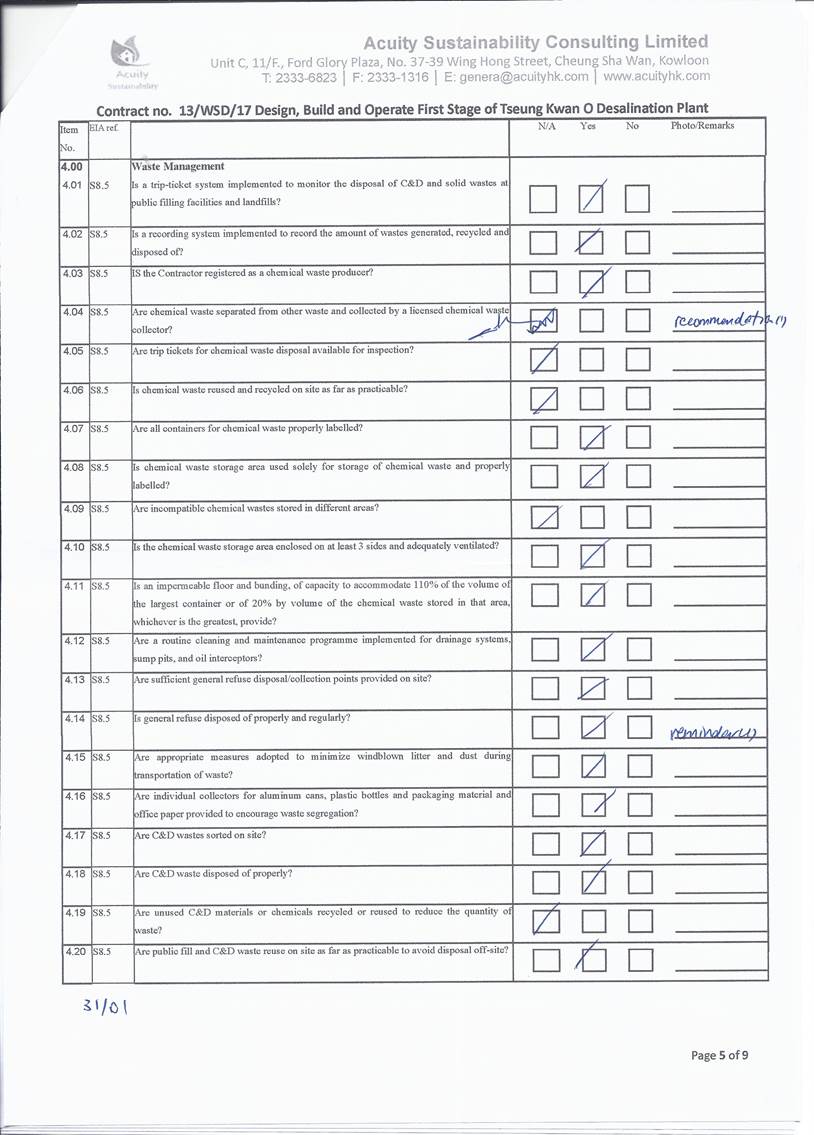
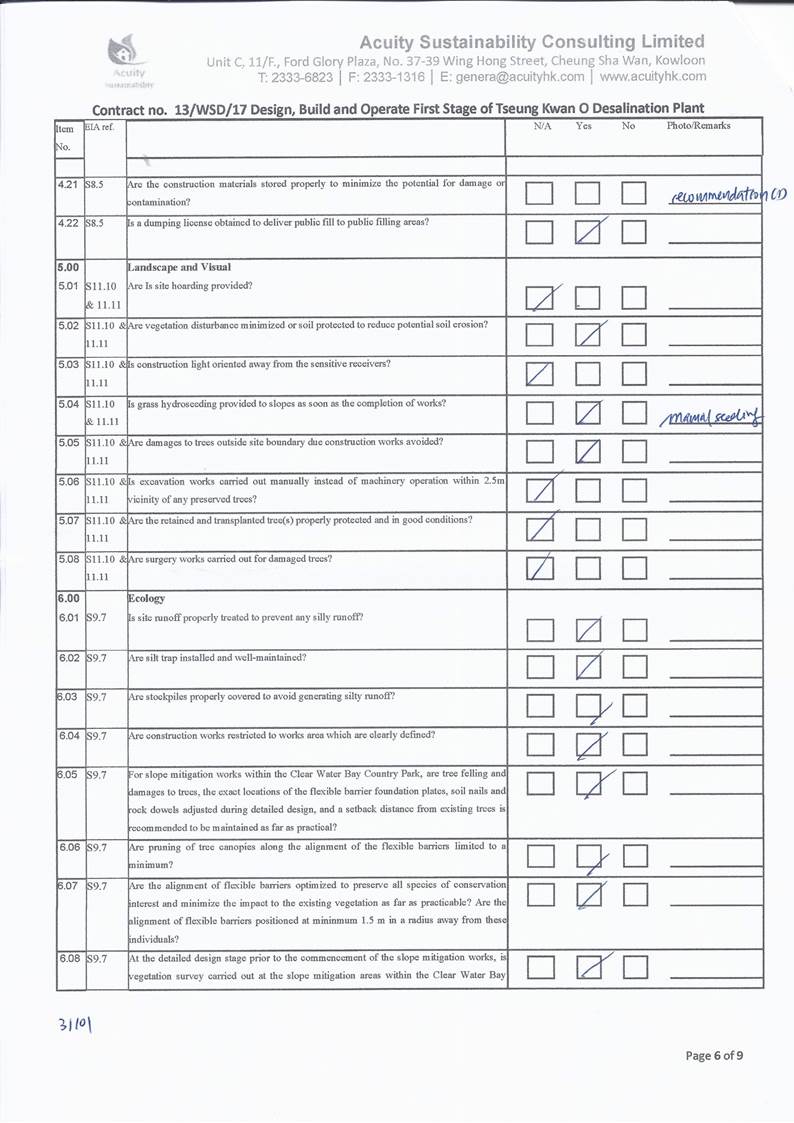
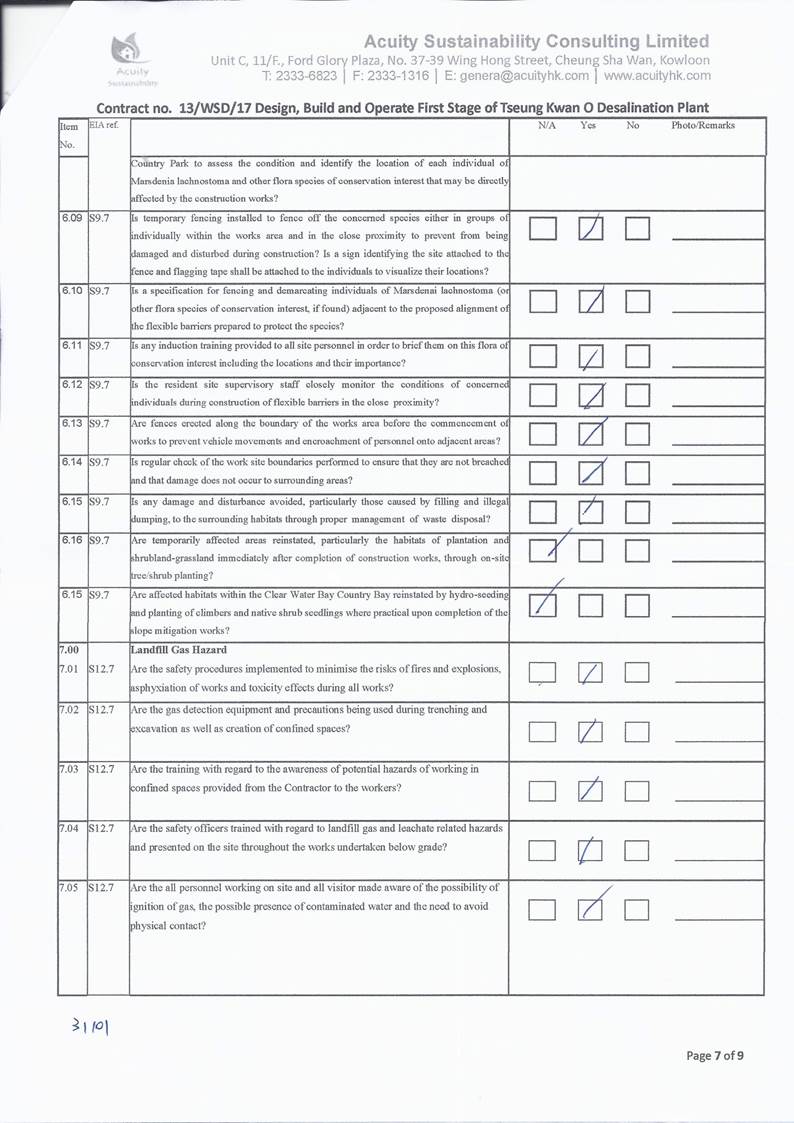
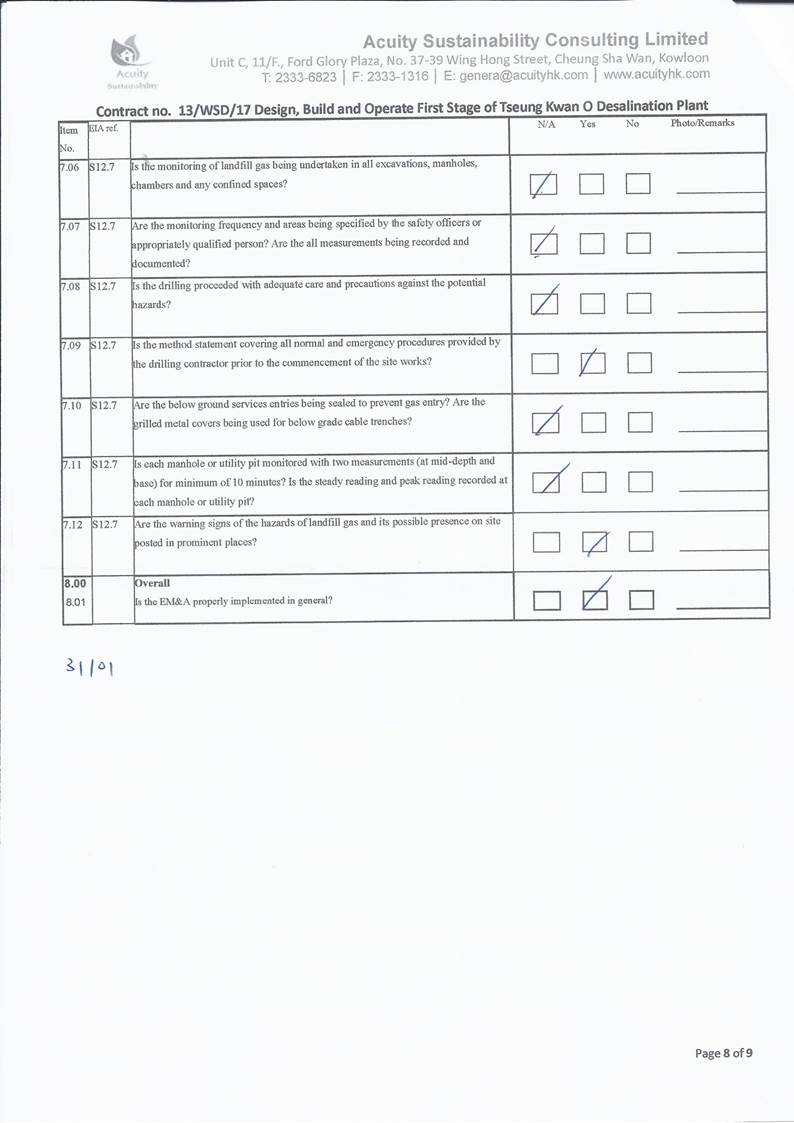
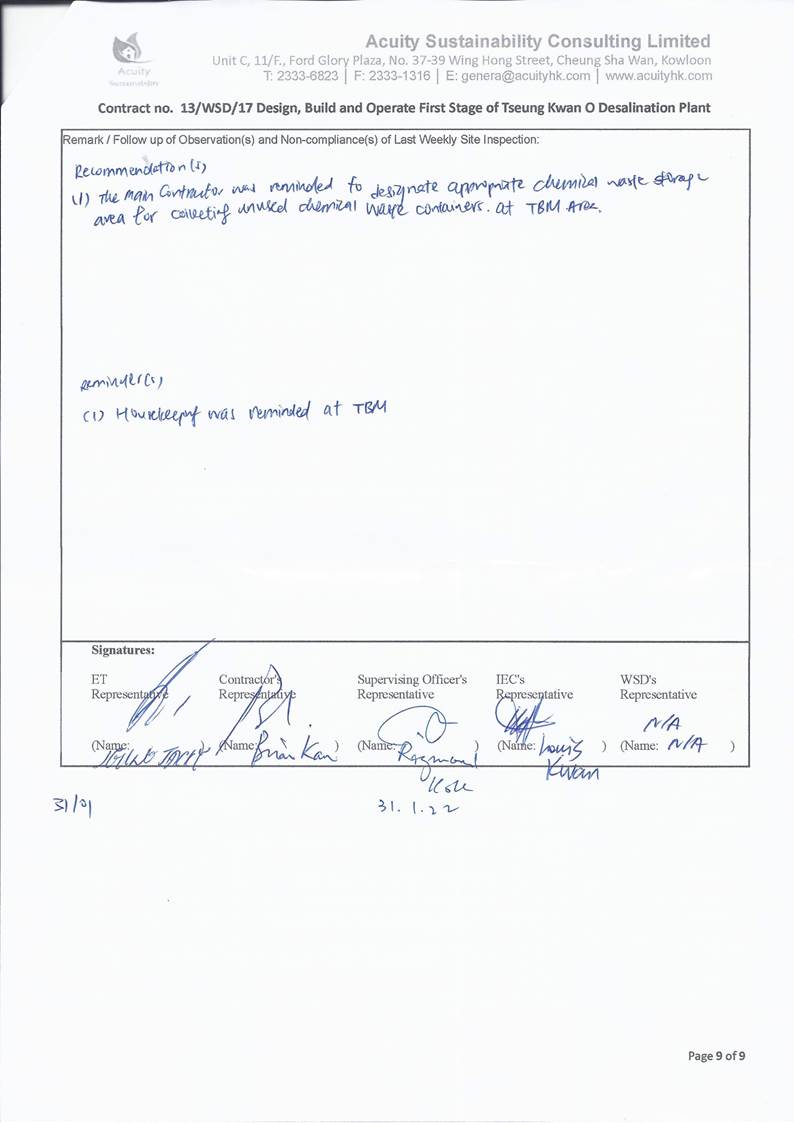
Appendix J
Complaint Log
Statistical Summary
of Environmental Complaints
|
Reporting Period |
Environmental Complaint Statistics |
||
|
Frequency |
Cumulative |
Complaint Nature |
|
|
1 - 31 January 2022 |
0 |
0 |
N/A |
Statistical Summary
of Environmental Summons
|
Reporting Period |
Environmental Summons
Statistics |
||
|
Frequency |
Cumulative |
Details |
|
|
1 - 31 January 2022 |
0 |
0 |
N/A |
Statistical Summary
of Environmental Prosecution
|
Reporting Period |
Environmental Prosecution Statistics |
||
|
Frequency |
Cumulative |
Details |
|
|
1 - 31 January 2022 |
0 |
0 |
N/A |
Appendix K
Impact Monitoring Schedule of Next Reporting Month
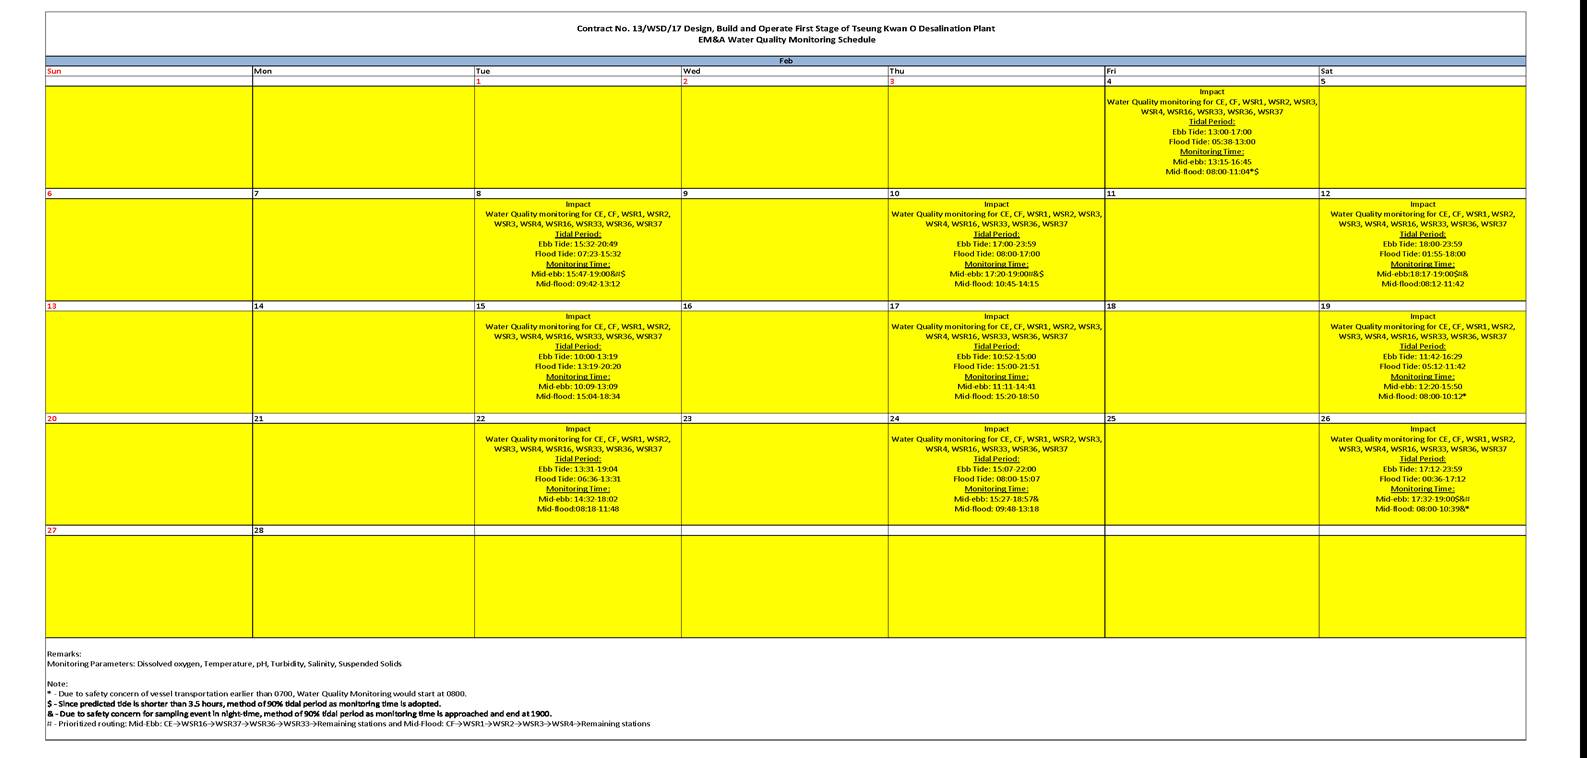
Appendix L
Water Quality
and Landfill Gas Monitoring Data
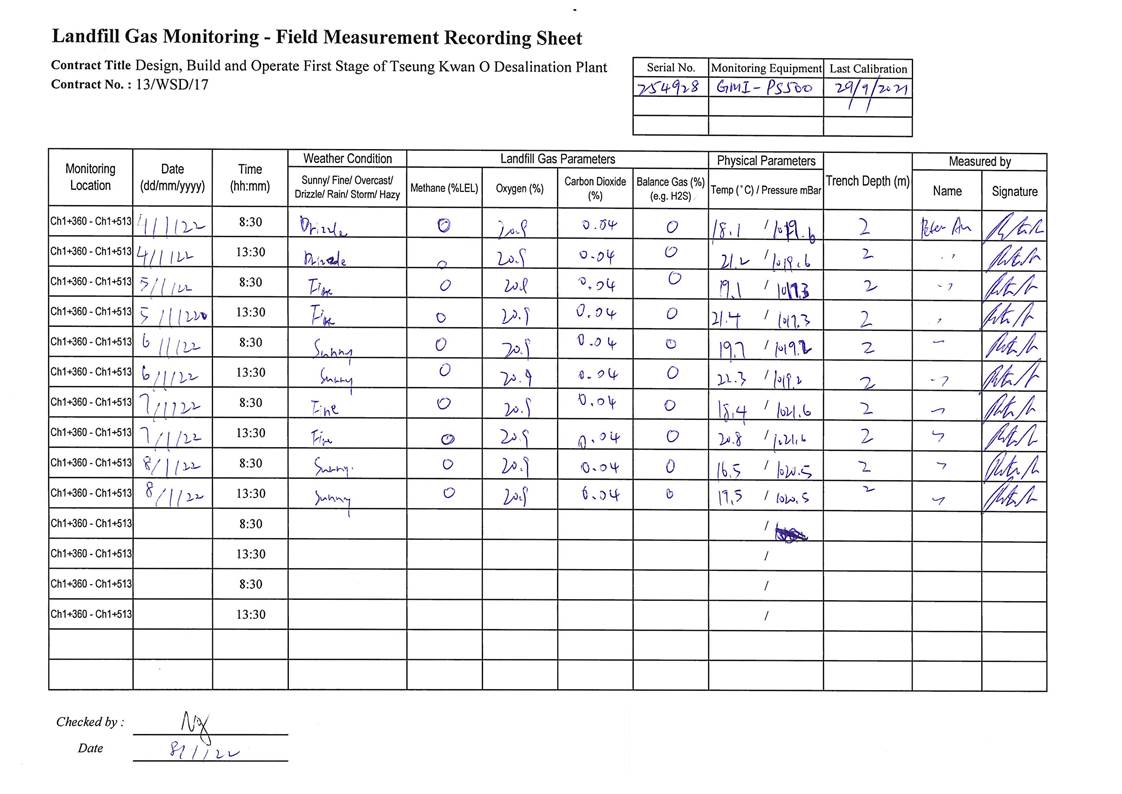
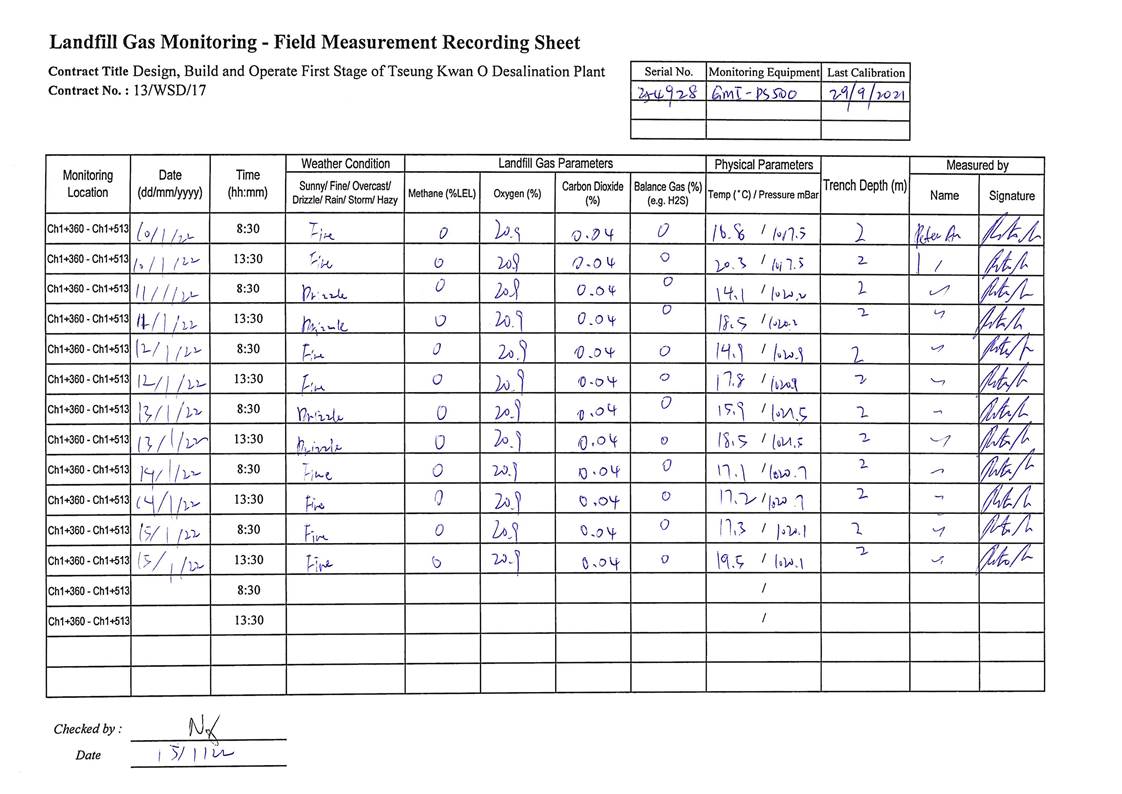
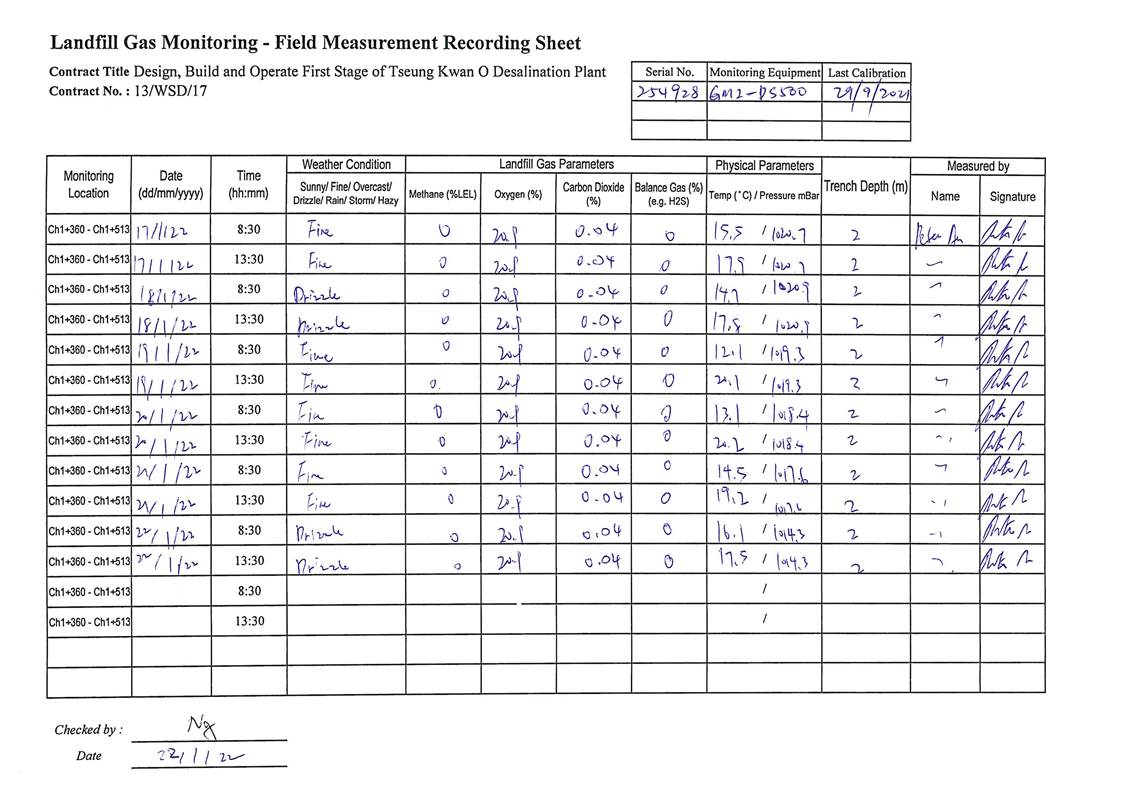
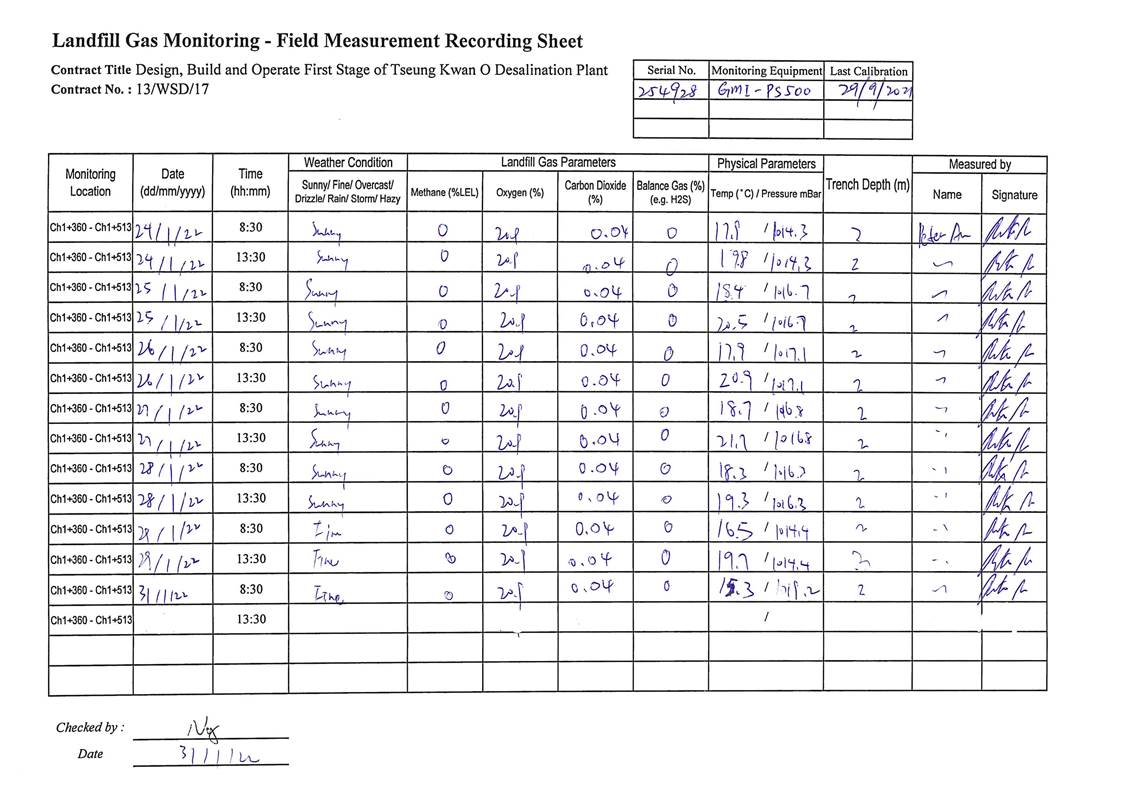
|
Location |
Date |
Weather |
Sea Conidtion |
Tidal |
Water Level |
Depth (m) |
Time |
DO (mg/L) |
H |
Sal (ppt) |
Temp (�XC) |
Turbidty (NTU) |
SS (mg/L) |
|
CE |
20220101 |
Cloudy |
Moderate |
Mid-Flood |
S |
1 |
17:03 |
8.92 |
8.19 |
31.15 |
22.44 |
2.9 |
4 |
|
CE |
20220101 |
Cloudy |
Moderate |
Mid-Flood |
S |
1 |
17:03 |
8.94 |
8.2 |
31.17 |
22.35 |
3.15 |
6 |
|
CE |
20220101 |
Cloudy |
Moderate |
Mid-Flood |
M |
11.1 |
17:02 |
8.73 |
8.25 |
31.12 |
22.37 |
2.8 |
4 |
|
CE |
20220101 |
Cloudy |
Moderate |
Mid-Flood |
M |
11.1 |
17:02 |
8.97 |
8.2 |
31.02 |
22.42 |
2.91 |
4 |
|
CE |
20220101 |
Cloudy |
Moderate |
Mid-Flood |
B |
21.2 |
17:01 |
8.72 |
8.25 |
31.1 |
22.43 |
3.29 |
4 |
|
CE |
20220101 |
Cloudy |
Moderate |
Mid-Flood |
B |
21.2 |
17:01 |
8.74 |
8.22 |
31.01 |
22.31 |
3.3 |
4 |
|
CE |
20220104 |
Sunny |
Moderate |
Mid-Flood |
S |
1 |
10:29 |
8.08 |
8.22 |
30.85 |
22.17 |
2.65 |
3 |
|
CE |
20220104 |
Sunny |
Moderate |
Mid-Flood |
S |
1 |
10:29 |
8.15 |
8.27 |
30.76 |
21.98 |
2.68 |
4 |
|
CE |
20220104 |
Sunny |
Moderate |
Mid-Flood |
M |
12.05 |
10:28 |
8.19 |
8.23 |
30.82 |
22.12 |
2.3 |
3 |
|
CE |
20220104 |
Sunny |
Moderate |
Mid-Flood |
M |
12.05 |
10:28 |
8.13 |
8.22 |
30.85 |
22.14 |
2.34 |
4 |
|
CE |
20220104 |
Sunny |
Moderate |
Mid-Flood |
B |
23.1 |
10:27 |
8.11 |
8.27 |
30.87 |
22.09 |
2.39 |
4 |
|
CE |
20220104 |
Sunny |
Moderate |
Mid-Flood |
B |
23.1 |
10:27 |
8.15 |
8.27 |
30.83 |
22.07 |
2.39 |
8 |
|
CE |
20220106 |
Sunny |
Moderate |
Mid-Flood |
S |
1 |
10:44 |
8.54 |
8.2 |
32.93 |
22.95 |
3.95 |
2.5 |
|
CE |
20220106 |
Sunny |
Moderate |
Mid-Flood |
S |
1 |
10:44 |
8.6 |
8.22 |
32.89 |
23.1 |
3.53 |
2.5 |
|
CE |
20220106 |
Sunny |
Moderate |
Mid-Flood |
M |
10.4 |
10:43 |
8.5 |
8.16 |
32.93 |
22.94 |
3.64 |
2.5 |
|
CE |
20220106 |
Sunny |
Moderate |
Mid-Flood |
M |
10.4 |
10:43 |
8.5 |
8.17 |
32.94 |
23.1 |
3.55 |
3 |
|
CE |
20220106 |
Sunny |
Moderate |
Mid-Flood |
B |
19.8 |
10:42 |
8.6 |
8.19 |
32.95 |
22.82 |
3.64 |
2.5 |
|
CE |
20220106 |
Sunny |
Moderate |
Mid-Flood |
B |
19.8 |
10:42 |
8.65 |
8.2 |
32.9 |
22.83 |
3.51 |
2.5 |
|
CE |
20220108 |
Sunny |
Moderate |
Mid-Flood |
S |
1 |
12:02 |
8.49 |
8.46 |
34.76 |
21.49 |
2.88 |
4 |
|
CE |
20220108 |
Sunny |
Moderate |
Mid-Flood |
S |
1 |
12:02 |
8.57 |
8.48 |
34.74 |
21.48 |
3.2 |
5 |
|
CE |
20220108 |
Sunny |
Moderate |
Mid-Flood |
M |
11.5 |
12:01 |
8.5 |
8.51 |
34.68 |
21.44 |
2.71 |
4 |
|
CE |
20220108 |
Sunny |
Moderate |
Mid-Flood |
M |
11.5 |
12:01 |
8.48 |
8.47 |
34.71 |
21.49 |
2.61 |
4 |
|
CE |
20220108 |
Sunny |
Moderate |
Mid-Flood |
B |
22 |
12:00 |
8.53 |
8.47 |
34.76 |
21.53 |
2.36 |
4 |
|
CE |
20220108 |
Sunny |
Moderate |
Mid-Flood |
B |
22 |
12:00 |
8.57 |
8.5 |
34.75 |
21.54 |
2.28 |
5 |
|
CE |
20220111 |
Sunny |
Moderate |
Mid-Flood |
S |
1 |
20:00 |
9.38 |
8.3 |
35.04 |
19.89 |
2.77 |
4 |
|
CE |
20220111 |
Sunny |
Moderate |
Mid-Flood |
S |
1 |
20:00 |
9.4 |
8.22 |
35.01 |
19.85 |
3.15 |
4 |
|
Location |
Date |
Weather |
Sea Conidtion |
Tidal |
Water Level |
Depth (m) |
Time |
DO (mg/L) |
H |
Sal (ppt) |
Temp (�XC) |
Turbidty (NTU) |
SS (mg/L) |
|
CE |
20220111 |
Sunny |
Moderate |
Mid-Flood |
M |
11.25 |
19:59 |
9.37 |
8.3 |
34.96 |
19.83 |
2.87 |
3 |
|
CE |
20220111 |
Sunny |
Moderate |
Mid-Flood |
M |
11.25 |
19:59 |
9.58 |
8.28 |
34.9 |
19.8 |
2.96 |
3 |
|
CE |
20220111 |
Sunny |
Moderate |
Mid-Flood |
B |
21.5 |
19:58 |
9.24 |
8.22 |
35.03 |
19.8 |
3.01 |
5 |
|
CE |
20220111 |
Sunny |
Moderate |
Mid-Flood |
B |
21.5 |
19:58 |
9.37 |
8.21 |
35.08 |
19.9 |
3.14 |
3 |
|
CE |
20220113 |
Cloudy |
Moderate |
Mid-Flood |
S |
1 |
15:27 |
8.76 |
8.34 |
32.93 |
20.53 |
3.93 |
3 |
|
CE |
20220113 |
Cloudy |
Moderate |
Mid-Flood |
S |
1 |
15:27 |
8.23 |
8.37 |
32.84 |
20.49 |
3.59 |
3 |
|
CE |
20220113 |
Cloudy |
Moderate |
Mid-Flood |
M |
11 |
15:26 |
8.94 |
8.37 |
32.91 |
20.65 |
3.76 |
2.5 |
|
CE |
20220113 |
Cloudy |
Moderate |
Mid-Flood |
M |
11 |
15:26 |
8.81 |
8.35 |
32.94 |
20.7 |
3.47 |
2.5 |
|
CE |
20220113 |
Cloudy |
Moderate |
Mid-Flood |
B |
21 |
15:25 |
9.16 |
8.35 |
32.86 |
20.65 |
3.83 |
3 |
|
CE |
20220113 |
Cloudy |
Moderate |
Mid-Flood |
B |
21 |
15:25 |
8.22 |
8.35 |
32.92 |
20.54 |
3.51 |
3 |
|
CE |
20220115 |
Cloudy |
Moderate |
Mid-Flood |
S |
1 |
16:50 |
8.9 |
8.31 |
34.53 |
20.86 |
3.18 |
3 |
|
CE |
20220115 |
Cloudy |
Moderate |
Mid-Flood |
S |
1 |
16:50 |
8.85 |
8.32 |
34.53 |
20.93 |
3.33 |
2.5 |
|
CE |
20220115 |
Cloudy |
Moderate |
Mid-Flood |
M |
11.6 |
16:49 |
8.82 |
8.34 |
34.5 |
21 |
2.95 |
2.5 |
|
CE |
20220115 |
Cloudy |
Moderate |
Mid-Flood |
M |
11.6 |
16:49 |
8.83 |
8.3 |
34.59 |
21.01 |
3.18 |
4 |
|
CE |
20220115 |
Cloudy |
Moderate |
Mid-Flood |
B |
22.2 |
16:48 |
8.88 |
8.27 |
34.49 |
20.94 |
3.88 |
2.5 |
|
CE |
20220115 |
Cloudy |
Moderate |
Mid-Flood |
B |
22.2 |
16:48 |
8.95 |
8.29 |
34.6 |
20.95 |
3.64 |
4 |
|
CE |
20220118 |
Cloudy |
Moderate |
Mid-Flood |
S |
1 |
17:56 |
9.05 |
8.2 |
33.92 |
20.63 |
3.2 |
6 |
|
CE |
20220118 |
Cloudy |
Moderate |
Mid-Flood |
S |
1 |
17:56 |
9.16 |
8.13 |
33.96 |
20.82 |
3.59 |
6 |
|
CE |
20220118 |
Cloudy |
Moderate |
Mid-Flood |
M |
10.45 |
17:55 |
9.15 |
8.21 |
33.94 |
20.72 |
3.66 |
3 |
|
CE |
20220118 |
Cloudy |
Moderate |
Mid-Flood |
M |
10.45 |
17:55 |
9.06 |
8.12 |
33.89 |
20.67 |
3.3 |
4 |
|
CE |
20220118 |
Cloudy |
Moderate |
Mid-Flood |
B |
19.9 |
17:54 |
9.18 |
8.15 |
33.9 |
20.7 |
3.03 |
11 |
|
CE |
20220118 |
Cloudy |
Moderate |
Mid-Flood |
B |
19.9 |
17:54 |
9.15 |
8.16 |
33.99 |
20.75 |
2.84 |
12 |
|
CE |
20220120 |
Sunny |
Moderate |
Mid-Flood |
S |
1 |
10:24 |
8.58 |
8.33 |
33.94 |
20.77 |
3.53 |
4 |
|
CE |
20220120 |
Sunny |
Moderate |
Mid-Flood |
S |
1 |
10:24 |
8.5 |
8.34 |
33.86 |
20.81 |
3.38 |
5 |
|
CE |
20220120 |
Sunny |
Moderate |
Mid-Flood |
M |
10.2 |
10:23 |
8.69 |
8.29 |
33.81 |
20.76 |
4.32 |
3 |
|
CE |
20220120 |
Sunny |
Moderate |
Mid-Flood |
M |
10.2 |
10:23 |
8.54 |
8.28 |
33.91 |
20.78 |
3.97 |
4 |
|
Location |
Date |
Weather |
Sea Conidtion |
Tidal |
Water Level |
Depth (m) |
Time |
DO (mg/L) |
H |
Sal (ppt) |
Temp (�XC) |
Turbidty (NTU) |
SS (mg/L) |
|
CE |
20220120 |
Sunny |
Moderate |
Mid-Flood |
B |
19.4 |
10:22 |
8.62 |
8.23 |
34.02 |
20.73 |
4.24 |
4 |
|
CE |
20220120 |
Sunny |
Moderate |
Mid-Flood |
B |
19.4 |
10:22 |
8.57 |
8.26 |
33.82 |
20.78 |
3.8 |
4 |
|
CE |
20220122 |
Cloudy |
Moderate |
Mid-Flood |
S |
1 |
10:26 |
8.73 |
8.23 |
33.03 |
21.52 |
4.08 |
6 |
|
CE |
20220122 |
Cloudy |
Moderate |
Mid-Flood |
S |
1 |
10:26 |
8.76 |
8.24 |
33.03 |
21.48 |
3.77 |
6 |
|
CE |
20220122 |
Cloudy |
Moderate |
Mid-Flood |
M |
11.8 |
10:25 |
8.76 |
8.26 |
33.03 |
21.52 |
3.76 |
6 |
|
CE |
20220122 |
Cloudy |
Moderate |
Mid-Flood |
M |
11.8 |
10:25 |
8.68 |
8.23 |
32.92 |
21.51 |
3.94 |
5 |
|
CE |
20220122 |
Cloudy |
Moderate |
Mid-Flood |
B |
22.6 |
10:24 |
8.71 |
8.22 |
32.94 |
21.44 |
4.13 |
6 |
|
CE |
20220122 |
Cloudy |
Moderate |
Mid-Flood |
B |
22.6 |
10:24 |
8.7 |
8.2 |
32.88 |
21.53 |
3.58 |
7 |
|
CE |
20220125 |
Cloudy |
Moderate |
Mid-Flood |
S |
1 |
12:23 |
8.4 |
8.29 |
30.28 |
21.09 |
3.73 |
3 |
|
CE |
20220125 |
Cloudy |
Moderate |
Mid-Flood |
S |
1 |
12:23 |
8.46 |
8.26 |
30.21 |
21.16 |
3.61 |
5 |
|
CE |
20220125 |
Cloudy |
Moderate |
Mid-Flood |
M |
10.4 |
12:22 |
8.49 |
8.19 |
30.09 |
21.12 |
3.17 |
4 |
|
CE |
20220125 |
Cloudy |
Moderate |
Mid-Flood |
M |
10.4 |
12:22 |
8.37 |
8.25 |
30.26 |
21.21 |
3.19 |
5 |
|
CE |
20220125 |
Cloudy |
Moderate |
Mid-Flood |
B |
19.8 |
12:21 |
8.41 |
8.3 |
30.16 |
21.2 |
3.55 |
3 |
|
CE |
20220125 |
Cloudy |
Moderate |
Mid-Flood |
B |
19.8 |
12:21 |
8.32 |
8.26 |
30.23 |
21.17 |
3.3 |
3 |
|
CE |
20220127 |
Cloudy |
Moderate |
Mid-Flood |
S |
1 |
14:03 |
8.57 |
8.04 |
31.28 |
21.18 |
2.88 |
4 |
|
CE |
20220127 |
Cloudy |
Moderate |
Mid-Flood |
S |
1 |
14:03 |
8.57 |
8.12 |
31.24 |
21.23 |
3.15 |
2.5 |
|
CE |
20220127 |
Cloudy |
Moderate |
Mid-Flood |
M |
12 |
14:02 |
8.51 |
8.07 |
31.26 |
21.24 |
3.09 |
6 |
|
CE |
20220127 |
Cloudy |
Moderate |
Mid-Flood |
M |
12 |
14:02 |
8.56 |
8.06 |
31.41 |
21.15 |
3.31 |
6 |
|
CE |
20220127 |
Cloudy |
Moderate |
Mid-Flood |
B |
23 |
14:01 |
8.54 |
8.05 |
31.42 |
21.14 |
3.79 |
3 |
|
CE |
20220127 |
Cloudy |
Moderate |
Mid-Flood |
B |
23 |
14:01 |
8.49 |
8.13 |
31.31 |
21.28 |
3.61 |
2.5 |
|
CE |
20220129 |
Cloudy |
Moderate |
Mid-Flood |
S |
1 |
15:50 |
9.59 |
8.19 |
31.18 |
20.65 |
2.81 |
2.5 |
|
CE |
20220129 |
Cloudy |
Moderate |
Mid-Flood |
S |
1 |
15:50 |
9.54 |
8.14 |
31.08 |
20.52 |
3.06 |
2.5 |
|
CE |
20220129 |
Cloudy |
Moderate |
Mid-Flood |
M |
12.15 |
15:49 |
9.51 |
8.14 |
31.19 |
20.51 |
3.28 |
5 |
|
CE |
20220129 |
Cloudy |
Moderate |
Mid-Flood |
M |
12.15 |
15:49 |
9.58 |
8.12 |
31.1 |
20.6 |
3.4 |
5 |
|
CE |
20220129 |
Cloudy |
Moderate |
Mid-Flood |
B |
23.3 |
15:48 |
9.46 |
8.15 |
31.17 |
20.55 |
3.54 |
4 |
|
CE |
20220129 |
Cloudy |
Moderate |
Mid-Flood |
B |
23.3 |
15:48 |
9.55 |
8.15 |
31.04 |
20.66 |
3.11 |
4 |
|
Location |
Date |
Weather |
Sea Conidtion |
Tidal |
Water Level |
Depth (m) |
Time |
DO (mg/L) |
H |
Sal (ppt) |
Temp (�XC) |
Turbidty (NTU) |
SS (mg/L) |
|
CE |
20220131 |
Cloudy |
Moderate |
Mid-Flood |
S |
1 |
17:42 |
8.3 |
8.18 |
33.67 |
19.74 |
3.26 |
3 |
|
CE |
20220131 |
Cloudy |
Moderate |
Mid-Flood |
S |
1 |
17:42 |
8.2 |
8.2 |
33.76 |
19.78 |
3.24 |
4 |
|
CE |
20220131 |
Cloudy |
Moderate |
Mid-Flood |
M |
12.35 |
17:41 |
8.16 |
8.14 |
33.8 |
19.71 |
2.8 |
4 |
|
CE |
20220131 |
Cloudy |
Moderate |
Mid-Flood |
M |
12.35 |
17:41 |
8.26 |
8.23 |
33.77 |
19.73 |
3.14 |
5 |
|
CE |
20220131 |
Cloudy |
Moderate |
Mid-Flood |
B |
23.7 |
17:40 |
8.18 |
8.18 |
33.59 |
19.72 |
3.5 |
4 |
|
CE |
20220131 |
Cloudy |
Moderate |
Mid-Flood |
B |
23.7 |
17:40 |
8.19 |
8.21 |
33.79 |
19.72 |
3.19 |
4 |
|
CF |
20220101 |
Cloudy |
Moderate |
Mid-Flood |
S |
1 |
14:36 |
8.95 |
8.38 |
31.75 |
22.16 |
3.43 |
4 |
|
CF |
20220101 |
Cloudy |
Moderate |
Mid-Flood |
S |
1 |
14:36 |
8.97 |
8.42 |
31.67 |
22.24 |
3.55 |
5 |
|
CF |
20220101 |
Cloudy |
Moderate |
Mid-Flood |
M |
9.6 |
14:35 |
8.95 |
8.41 |
31.62 |
22.17 |
2.98 |
4 |
|
CF |
20220101 |
Cloudy |
Moderate |
Mid-Flood |
M |
9.6 |
14:35 |
9.04 |
8.4 |
31.76 |
22.17 |
3.25 |
4 |
|
CF |
20220101 |
Cloudy |
Moderate |
Mid-Flood |
B |
18.2 |
14:34 |
8.8 |
8.43 |
31.7 |
22.21 |
3.24 |
6 |
|
CF |
20220101 |
Cloudy |
Moderate |
Mid-Flood |
B |
18.2 |
14:34 |
8.91 |
8.47 |
31.75 |
22.09 |
3 |
6 |
|
CF |
20220104 |
Sunny |
Moderate |
Mid-Flood |
S |
1 |
8:02 |
8.57 |
8.36 |
30.73 |
22.25 |
2.48 |
4 |
|
CF |
20220104 |
Sunny |
Moderate |
Mid-Flood |
S |
1 |
8:02 |
8.53 |
8.38 |
30.84 |
22.44 |
2.55 |
3 |
|
CF |
20220104 |
Sunny |
Moderate |
Mid-Flood |
M |
10.45 |
8:01 |
8.42 |
8.34 |
30.75 |
22.37 |
2.18 |
3 |
|
CF |
20220104 |
Sunny |
Moderate |
Mid-Flood |
M |
10.45 |
8:01 |
8.45 |
8.31 |
30.74 |
22.33 |
2.42 |
4 |
|
CF |
20220104 |
Sunny |
Moderate |
Mid-Flood |
B |
19.9 |
8:00 |
8.35 |
8.37 |
30.74 |
22.36 |
2.62 |
3 |
|
CF |
20220104 |
Sunny |
Moderate |
Mid-Flood |
B |
19.9 |
8:00 |
8.5 |
8.33 |
30.77 |
22.26 |
2.48 |
3 |
|
CF |
20220106 |
Sunny |
Moderate |
Mid-Flood |
S |
1 |
8:13 |
8.31 |
8.4 |
33.09 |
22.58 |
5.67 |
9 |
|
CF |
20220106 |
Sunny |
Moderate |
Mid-Flood |
S |
1 |
8:13 |
8.47 |
8.42 |
33.08 |
22.86 |
5.19 |
9 |
|
CF |
20220106 |
Sunny |
Moderate |
Mid-Flood |
M |
10.85 |
8:12 |
8.32 |
8.47 |
33.17 |
22.84 |
3.97 |
6 |
|
CF |
20220106 |
Sunny |
Moderate |
Mid-Flood |
M |
10.85 |
8:12 |
8.32 |
8.45 |
32.97 |
22.87 |
4.12 |
6 |
|
CF |
20220106 |
Sunny |
Moderate |
Mid-Flood |
B |
20.7 |
8:11 |
8.42 |
8.44 |
33.13 |
22.55 |
4.41 |
3 |
|
CF |
20220106 |
Sunny |
Moderate |
Mid-Flood |
B |
20.7 |
8:11 |
8.41 |
8.47 |
33.04 |
22.73 |
3.69 |
3 |
|
CF |
20220108 |
Sunny |
Moderate |
Mid-Flood |
S |
1 |
9:33 |
8.61 |
8.43 |
34.76 |
21.95 |
3.53 |
3 |
|
CF |
20220108 |
Sunny |
Moderate |
Mid-Flood |
S |
1 |
9:33 |
8.63 |
8.44 |
34.85 |
22.01 |
3 |
4 |
|
Location |
Date |
Weather |
Sea Conidtion |
Tidal |
Water Level |
Depth (m) |
Time |
DO (mg/L) |
H |
Sal (ppt) |
Temp (�XC) |
Turbidty (NTU) |
SS (mg/L) |
|
CF |
20220108 |
Sunny |
Moderate |
Mid-Flood |
M |
10.7 |
9:32 |
8.54 |
8.41 |
34.81 |
21.9 |
2.92 |
5 |
|
CF |
20220108 |
Sunny |
Moderate |
Mid-Flood |
M |
10.7 |
9:32 |
8.62 |
8.49 |
34.79 |
21.93 |
3.16 |
5 |
|
CF |
20220108 |
Sunny |
Moderate |
Mid-Flood |
B |
20.4 |
9:31 |
8.58 |
8.46 |
34.77 |
21.89 |
3.29 |
7 |
|
CF |
20220108 |
Sunny |
Moderate |
Mid-Flood |
B |
20.4 |
9:31 |
8.54 |
8.44 |
34.83 |
21.92 |
3.35 |
7 |
|
CF |
20220111 |
Sunny |
Moderate |
Mid-Flood |
S |
1 |
17:42 |
9.03 |
8.28 |
34.22 |
20.2 |
2.89 |
4 |
|
CF |
20220111 |
Sunny |
Moderate |
Mid-Flood |
S |
1 |
17:42 |
8.98 |
8.24 |
34.25 |
20.15 |
3.33 |
4 |
|
CF |
20220111 |
Sunny |
Moderate |
Mid-Flood |
M |
9.65 |
17:41 |
8.89 |
8.21 |
34.22 |
20.17 |
3.47 |
4 |
|
CF |
20220111 |
Sunny |
Moderate |
Mid-Flood |
M |
9.65 |
17:41 |
8.86 |
8.21 |
34.16 |
20.13 |
3.66 |
2.5 |
|
CF |
20220111 |
Sunny |
Moderate |
Mid-Flood |
B |
18.3 |
17:40 |
9.01 |
8.28 |
34.1 |
20.21 |
3.57 |
10 |
|
CF |
20220111 |
Sunny |
Moderate |
Mid-Flood |
B |
18.3 |
17:40 |
9.12 |
8.25 |
34.31 |
20.27 |
3.9 |
10 |
|
CF |
20220113 |
Cloudy |
Moderate |
Mid-Flood |
S |
1 |
12:51 |
8.81 |
8.29 |
32.95 |
20.64 |
5.41 |
8 |
|
CF |
20220113 |
Cloudy |
Moderate |
Mid-Flood |
S |
1 |
12:51 |
8.87 |
8.35 |
32.89 |
20.59 |
5.08 |
8 |
|
CF |
20220113 |
Cloudy |
Moderate |
Mid-Flood |
M |
10.55 |
12:50 |
8.84 |
8.3 |
32.99 |
20.73 |
4.4 |
4 |
|
CF |
20220113 |
Cloudy |
Moderate |
Mid-Flood |
M |
10.55 |
12:50 |
8.9 |
8.37 |
33.01 |
20.74 |
4.67 |
3 |
|
CF |
20220113 |
Cloudy |
Moderate |
Mid-Flood |
B |
20.1 |
12:49 |
8.79 |
8.29 |
32.97 |
20.72 |
4.4 |
5 |
|
CF |
20220113 |
Cloudy |
Moderate |
Mid-Flood |
B |
20.1 |
12:49 |
8.9 |
8.37 |
32.95 |
20.72 |
4.73 |
5 |
|
CF |
20220115 |
Cloudy |
Moderate |
Mid-Flood |
S |
1 |
14:07 |
8.8 |
8.31 |
34.22 |
20.75 |
3.83 |
2.5 |
|
CF |
20220115 |
Cloudy |
Moderate |
Mid-Flood |
S |
1 |
14:07 |
8.79 |
8.28 |
34.31 |
20.72 |
3.71 |
3 |
|
CF |
20220115 |
Cloudy |
Moderate |
Mid-Flood |
M |
10.5 |
14:06 |
8.76 |
8.26 |
34.32 |
20.78 |
3.7 |
2.5 |
|
CF |
20220115 |
Cloudy |
Moderate |
Mid-Flood |
M |
10.5 |
14:06 |
8.77 |
8.28 |
34.26 |
20.7 |
3.5 |
2.5 |
|
CF |
20220115 |
Cloudy |
Moderate |
Mid-Flood |
B |
20 |
14:05 |
8.82 |
8.28 |
34.35 |
20.68 |
4.19 |
5 |
|
CF |
20220115 |
Cloudy |
Moderate |
Mid-Flood |
B |
20 |
14:05 |
8.81 |
8.3 |
34.36 |
20.76 |
3.68 |
5 |
|
CF |
20220118 |
Cloudy |
Moderate |
Mid-Flood |
S |
1 |
15:42 |
8.17 |
8.16 |
33.9 |
20.88 |
3.72 |
11 |
|
CF |
20220118 |
Cloudy |
Moderate |
Mid-Flood |
S |
1 |
15:42 |
8.16 |
8.18 |
33.94 |
20.82 |
3.46 |
11 |
|
CF |
20220118 |
Cloudy |
Moderate |
Mid-Flood |
M |
10.75 |
15:41 |
8.29 |
8.16 |
33.98 |
21.02 |
3.29 |
7 |
|
CF |
20220118 |
Cloudy |
Moderate |
Mid-Flood |
M |
10.75 |
15:41 |
8.15 |
8.12 |
33.9 |
20.89 |
3.66 |
7 |
|
Location |
Date |
Weather |
Sea Conidtion |
Tidal |
Water Level |
Depth (m) |
Time |
DO (mg/L) |
H |
Sal (ppt) |
Temp (�XC) |
Turbidty (NTU) |
SS (mg/L) |
|
CF |
20220118 |
Cloudy |
Moderate |
Mid-Flood |
B |
20.5 |
15:40 |
8.21 |
8.17 |
33.89 |
21.02 |
4.63 |
7 |
|
CF |
20220118 |
Cloudy |
Moderate |
Mid-Flood |
B |
20.5 |
15:40 |
8.17 |
8.18 |
33.86 |
20.93 |
4.17 |
7 |
|
CF |
20220120 |
Sunny |
Moderate |
Mid-Flood |
S |
1 |
8:02 |
8.4 |
8.2 |
33.59 |
20.71 |
4.97 |
5 |
|
CF |
20220120 |
Sunny |
Moderate |
Mid-Flood |
S |
1 |
8:02 |
8.5 |
8.23 |
33.63 |
20.72 |
4.91 |
5 |
|
CF |
20220120 |
Sunny |
Moderate |
Mid-Flood |
M |
10.35 |
8:01 |
8.35 |
8.22 |
33.68 |
20.66 |
5.27 |
5 |
|
CF |
20220120 |
Sunny |
Moderate |
Mid-Flood |
M |
10.35 |
8:01 |
8.4 |
8.21 |
33.57 |
20.69 |
5 |
4 |
|
CF |
20220120 |
Sunny |
Moderate |
Mid-Flood |
B |
19.7 |
8:00 |
8.42 |
8.2 |
33.56 |
20.75 |
5.11 |
4 |
|
CF |
20220120 |
Sunny |
Moderate |
Mid-Flood |
B |
19.7 |
8:00 |
8.37 |
8.21 |
33.71 |
20.72 |
5.32 |
4 |
|
CF |
20220122 |
Cloudy |
Moderate |
Mid-Flood |
S |
1 |
8:04 |
8.9 |
8.26 |
33.11 |
20.94 |
4.55 |
3 |
|
CF |
20220122 |
Cloudy |
Moderate |
Mid-Flood |
S |
1 |
8:04 |
8.92 |
8.24 |
32.99 |
20.99 |
4.06 |
3 |
|
CF |
20220122 |
Cloudy |
Moderate |
Mid-Flood |
M |
9.95 |
8:03 |
9.01 |
8.29 |
33.05 |
20.9 |
4.23 |
5 |
|
CF |
20220122 |
Cloudy |
Moderate |
Mid-Flood |
M |
9.95 |
8:03 |
8.95 |
8.24 |
33.03 |
20.83 |
4.08 |
5 |
|
CF |
20220122 |
Cloudy |
Moderate |
Mid-Flood |
B |
18.9 |
8:02 |
8.99 |
8.24 |
33.11 |
20.87 |
4.15 |
5 |
|
CF |
20220122 |
Cloudy |
Moderate |
Mid-Flood |
B |
18.9 |
8:02 |
8.97 |
8.29 |
33.19 |
20.95 |
4.04 |
4 |
|
CF |
20220125 |
Cloudy |
Moderate |
Mid-Flood |
S |
1 |
10:01 |
8.41 |
8.17 |
30.63 |
21.08 |
4.17 |
3 |
|
CF |
20220125 |
Cloudy |
Moderate |
Mid-Flood |
S |
1 |
10:01 |
8.36 |
8.17 |
30.71 |
21.07 |
3.85 |
3 |
|
CF |
20220125 |
Cloudy |
Moderate |
Mid-Flood |
M |
10.2 |
10:00 |
8.41 |
8.2 |
30.53 |
21.01 |
4.26 |
3 |
|
CF |
20220125 |
Cloudy |
Moderate |
Mid-Flood |
M |
10.2 |
10:00 |
8.26 |
8.18 |
30.6 |
21.08 |
4.23 |
5 |
|
CF |
20220125 |
Cloudy |
Moderate |
Mid-Flood |
B |
19.4 |
9:59 |
8.41 |
8.18 |
30.53 |
21.02 |
3.97 |
5 |
|
CF |
20220125 |
Cloudy |
Moderate |
Mid-Flood |
B |
19.4 |
9:59 |
8.26 |
8.26 |
30.73 |
21.15 |
4.23 |
3 |
|
CF |
20220127 |
Cloudy |
Moderate |
Mid-Flood |
S |
1 |
11:28 |
8.6 |
8.04 |
31.54 |
21.07 |
3.7 |
22 |
|
CF |
20220127 |
Cloudy |
Moderate |
Mid-Flood |
S |
1 |
11:28 |
8.6 |
8.14 |
31.43 |
20.99 |
3.49 |
22 |
|
CF |
20220127 |
Cloudy |
Moderate |
Mid-Flood |
M |
10.7 |
11:27 |
8.74 |
8.07 |
31.54 |
21.07 |
3.43 |
2.5 |
|
CF |
20220127 |
Cloudy |
Moderate |
Mid-Flood |
M |
10.7 |
11:27 |
8.72 |
8.08 |
31.51 |
20.98 |
3.65 |
3 |
|
CF |
20220127 |
Cloudy |
Moderate |
Mid-Flood |
B |
20.4 |
11:26 |
8.72 |
8.15 |
31.44 |
21.06 |
3.88 |
5 |
|
CF |
20220127 |
Cloudy |
Moderate |
Mid-Flood |
B |
20.4 |
11:26 |
8.6 |
8.06 |
31.55 |
20.94 |
3.9 |
4 |
|
Location |
Date |
Weather |
Sea Conidtion |
Tidal |
Water Level |
Depth (m) |
Time |
DO (mg/L) |
H |
Sal (ppt) |
Temp (�XC) |
Turbidty (NTU) |
SS (mg/L) |
|
CF |
20220129 |
Cloudy |
Moderate |
Mid-Flood |
S |
1 |
13:12 |
8.81 |
8.2 |
30.32 |
20.48 |
3.59 |
15 |
|
CF |
20220129 |
Cloudy |
Moderate |
Mid-Flood |
S |
1 |
13:12 |
8.81 |
8.18 |
30.36 |
20.57 |
3.53 |
15 |
|
CF |
20220129 |
Cloudy |
Moderate |
Mid-Flood |
M |
10.35 |
13:11 |
8.8 |
8.13 |
30.26 |
20.57 |
3.48 |
2.5 |
|
CF |
20220129 |
Cloudy |
Moderate |
Mid-Flood |
M |
10.35 |
13:11 |
8.82 |
8.18 |
30.31 |
20.54 |
3.41 |
3 |
|
CF |
20220129 |
Cloudy |
Moderate |
Mid-Flood |
B |
19.7 |
13:10 |
8.85 |
8.15 |
30.42 |
20.44 |
4.03 |
4 |
|
CF |
20220129 |
Cloudy |
Moderate |
Mid-Flood |
B |
19.7 |
13:10 |
8.84 |
8.14 |
30.47 |
20.42 |
4.15 |
4 |
|
CF |
20220131 |
Cloudy |
Moderate |
Mid-Flood |
S |
1 |
15:09 |
8.74 |
8.19 |
33.89 |
20.25 |
4.19 |
3 |
|
CF |
20220131 |
Cloudy |
Moderate |
Mid-Flood |
S |
1 |
15:09 |
8.82 |
8.22 |
33.89 |
20.23 |
4.28 |
4 |
|
CF |
20220131 |
Cloudy |
Moderate |
Mid-Flood |
M |
10.35 |
15:08 |
8.78 |
8.16 |
33.93 |
20.28 |
3.65 |
4 |
|
CF |
20220131 |
Cloudy |
Moderate |
Mid-Flood |
M |
10.35 |
15:08 |
8.67 |
8.15 |
33.88 |
20.28 |
3.87 |
3 |
|
CF |
20220131 |
Cloudy |
Moderate |
Mid-Flood |
B |
19.7 |
15:07 |
8.67 |
8.17 |
34.02 |
20.25 |
4.28 |
2.5 |
|
CF |
20220131 |
Cloudy |
Moderate |
Mid-Flood |
B |
19.7 |
15:07 |
8.81 |
8.15 |
33.95 |
20.21 |
4.15 |
4 |
|
WSR01 |
20220101 |
Cloudy |
Moderate |
Mid-Flood |
S |
1 |
14:59 |
8.67 |
8.46 |
31.45 |
22.31 |
2.22 |
5 |
|
WSR01 |
20220101 |
Cloudy |
Moderate |
Mid-Flood |
S |
1 |
14:59 |
8.8 |
8.39 |
31.59 |
22.2 |
2.21 |
5 |
|
WSR01 |
20220101 |
Cloudy |
Moderate |
Mid-Flood |
M |
4.35 |
14:58 |
8.62 |
8.43 |
31.56 |
22.32 |
2.1 |
4 |
|
WSR01 |
20220101 |
Cloudy |
Moderate |
Mid-Flood |
M |
4.35 |
14:58 |
8.79 |
8.4 |
31.42 |
22.3 |
2 |
4 |
|
WSR01 |
20220101 |
Cloudy |
Moderate |
Mid-Flood |
B |
7.7 |
14:57 |
8.89 |
8.39 |
31.5 |
22.17 |
1.6 |
5 |
|
WSR01 |
20220101 |
Cloudy |
Moderate |
Mid-Flood |
B |
7.7 |
14:57 |
8.62 |
8.38 |
31.44 |
22.32 |
1.73 |
4 |
|
WSR01 |
20220104 |
Sunny |
Moderate |
Mid-Flood |
S |
1 |
8:23 |
8.59 |
8.34 |
31.62 |
22.62 |
2.47 |
5 |
|
WSR01 |
20220104 |
Sunny |
Moderate |
Mid-Flood |
S |
1 |
8:23 |
8.4 |
8.31 |
31.62 |
22.42 |
2.28 |
4 |
|
WSR01 |
20220104 |
Sunny |
Moderate |
Mid-Flood |
M |
4.5 |
8:22 |
8.55 |
8.27 |
31.68 |
22.42 |
2.17 |
6 |
|
WSR01 |
20220104 |
Sunny |
Moderate |
Mid-Flood |
M |
4.5 |
8:22 |
8.39 |
8.26 |
31.64 |
22.43 |
1.96 |
7 |
|
WSR01 |
20220104 |
Sunny |
Moderate |
Mid-Flood |
B |
8 |
8:21 |
8.47 |
8.27 |
31.66 |
22.65 |
2.15 |
5 |
|
WSR01 |
20220104 |
Sunny |
Moderate |
Mid-Flood |
B |
8 |
8:21 |
8.33 |
8.28 |
31.62 |
22.59 |
2.09 |
5 |
|
WSR01 |
20220106 |
Sunny |
Moderate |
Mid-Flood |
S |
1 |
8:34 |
8.19 |
8.23 |
32.7 |
22.34 |
3.81 |
3 |
|
WSR01 |
20220106 |
Sunny |
Moderate |
Mid-Flood |
S |
1 |
8:34 |
8.19 |
8.26 |
32.73 |
22.27 |
4.02 |
3 |
|
Location |
Date |
Weather |
Sea Conidtion |
Tidal |
Water Level |
Depth (m) |
Time |
DO (mg/L) |
H |
Sal (ppt) |
Temp (�XC) |
Turbidty (NTU) |
SS (mg/L) |
|
WSR01 |
20220106 |
Sunny |
Moderate |
Mid-Flood |
M |
4.75 |
8:33 |
8.13 |
8.25 |
32.87 |
22.48 |
3.67 |
3 |
|
WSR01 |
20220106 |
Sunny |
Moderate |
Mid-Flood |
M |
4.75 |
8:33 |
8.22 |
8.23 |
32.82 |
22.29 |
3.55 |
5 |
|
WSR01 |
20220106 |
Sunny |
Moderate |
Mid-Flood |
B |
8.5 |
8:32 |
8.19 |
8.21 |
32.89 |
22.38 |
3.37 |
4 |
|
WSR01 |
20220106 |
Sunny |
Moderate |
Mid-Flood |
B |
8.5 |
8:32 |
8.2 |
8.2 |
32.84 |
22.22 |
3.27 |
2.5 |
|
WSR01 |
20220108 |
Sunny |
Moderate |
Mid-Flood |
S |
1 |
9:56 |
8.85 |
8.41 |
34.38 |
21.83 |
2.78 |
2.5 |
|
WSR01 |
20220108 |
Sunny |
Moderate |
Mid-Flood |
S |
1 |
9:56 |
8.82 |
8.41 |
34.45 |
21.9 |
2.89 |
2.5 |
|
WSR01 |
20220108 |
Sunny |
Moderate |
Mid-Flood |
M |
4.5 |
9:55 |
8.8 |
8.39 |
34.4 |
21.87 |
2.62 |
6 |
|
WSR01 |
20220108 |
Sunny |
Moderate |
Mid-Flood |
M |
4.5 |
9:55 |
8.78 |
8.38 |
34.33 |
21.93 |
2.49 |
7 |
|
WSR01 |
20220108 |
Sunny |
Moderate |
Mid-Flood |
B |
8 |
9:54 |
8.79 |
8.41 |
34.38 |
21.96 |
2.57 |
7 |
|
WSR01 |
20220108 |
Sunny |
Moderate |
Mid-Flood |
B |
8 |
9:54 |
8.77 |
8.47 |
34.37 |
21.88 |
2.41 |
4 |
|
WSR01 |
20220111 |
Sunny |
Moderate |
Mid-Flood |
S |
1 |
18:02 |
9.29 |
8.29 |
34.81 |
19.86 |
2.79 |
3 |
|
WSR01 |
20220111 |
Sunny |
Moderate |
Mid-Flood |
S |
1 |
18:02 |
9.36 |
8.26 |
34.97 |
19.79 |
2.55 |
2.5 |
|
WSR01 |
20220111 |
Sunny |
Moderate |
Mid-Flood |
M |
4.2 |
18:01 |
9.53 |
8.29 |
34.84 |
19.87 |
2.23 |
5 |
|
WSR01 |
20220111 |
Sunny |
Moderate |
Mid-Flood |
M |
4.2 |
18:01 |
9.46 |
8.24 |
34.93 |
19.71 |
2.59 |
3 |
|
WSR01 |
20220111 |
Sunny |
Moderate |
Mid-Flood |
B |
7.4 |
18:00 |
9.38 |
8.25 |
34.85 |
19.76 |
2.38 |
5 |
|
WSR01 |
20220111 |
Sunny |
Moderate |
Mid-Flood |
B |
7.4 |
18:00 |
9.4 |
8.29 |
34.84 |
19.7 |
2.01 |
4 |
|
WSR01 |
20220113 |
Cloudy |
Moderate |
Mid-Flood |
S |
1 |
13:26 |
9.04 |
8.31 |
32.25 |
20.52 |
3.59 |
2.5 |
|
WSR01 |
20220113 |
Cloudy |
Moderate |
Mid-Flood |
S |
1 |
13:26 |
9.11 |
8.29 |
32.28 |
20.62 |
3.6 |
2.5 |
|
WSR01 |
20220113 |
Cloudy |
Moderate |
Mid-Flood |
M |
4.4 |
13:25 |
8.94 |
8.23 |
32.24 |
20.55 |
3.19 |
3 |
|
WSR01 |
20220113 |
Cloudy |
Moderate |
Mid-Flood |
M |
4.4 |
13:25 |
9.06 |
8.28 |
32.18 |
20.57 |
3.49 |
3 |
|
WSR01 |
20220113 |
Cloudy |
Moderate |
Mid-Flood |
B |
7.8 |
13:24 |
8.88 |
8.28 |
32.21 |
20.5 |
3.06 |
2.5 |
|
WSR01 |
20220113 |
Cloudy |
Moderate |
Mid-Flood |
B |
7.8 |
13:24 |
8.22 |
8.26 |
32.18 |
20.54 |
3.11 |
2.5 |
|
WSR01 |
20220115 |
Cloudy |
Moderate |
Mid-Flood |
S |
1 |
14:33 |
8.49 |
8.17 |
34.38 |
21.2 |
3.13 |
3 |
|
WSR01 |
20220115 |
Cloudy |
Moderate |
Mid-Flood |
S |
1 |
14:33 |
8.42 |
8.15 |
34.36 |
21.21 |
3.19 |
3 |
|
WSR01 |
20220115 |
Cloudy |
Moderate |
Mid-Flood |
M |
4.4 |
14:32 |
8.45 |
8.17 |
34.47 |
21.18 |
2.34 |
6 |
|
WSR01 |
20220115 |
Cloudy |
Moderate |
Mid-Flood |
M |
4.4 |
14:32 |
8.48 |
8.17 |
34.33 |
21.27 |
2.33 |
8 |
|
Location |
Date |
Weather |
Sea Conidtion |
Tidal |
Water Level |
Depth (m) |
Time |
DO (mg/L) |
H |
Sal (ppt) |
Temp (�XC) |
Turbidty (NTU) |
SS (mg/L) |
|
WSR01 |
20220115 |
Cloudy |
Moderate |
Mid-Flood |
B |
7.8 |
14:31 |
8.51 |
8.2 |
34.48 |
21.23 |
2.58 |
3 |
|
WSR01 |
20220115 |
Cloudy |
Moderate |
Mid-Flood |
B |
7.8 |
14:31 |
8.46 |
8.18 |
34.43 |
21.18 |
2.5 |
3 |
|
WSR01 |
20220118 |
Cloudy |
Moderate |
Mid-Flood |
S |
1 |
16:02 |
8.29 |
8.37 |
34.32 |
20.65 |
3.45 |
8 |
|
WSR01 |
20220118 |
Cloudy |
Moderate |
Mid-Flood |
S |
1 |
16:02 |
8.26 |
8.34 |
34.35 |
20.75 |
3.44 |
8 |
|
WSR01 |
20220118 |
Cloudy |
Moderate |
Mid-Flood |
M |
4.6 |
16:01 |
8.25 |
8.35 |
34.29 |
20.8 |
2.64 |
4 |
|
WSR01 |
20220118 |
Cloudy |
Moderate |
Mid-Flood |
M |
4.6 |
16:01 |
8.26 |
8.35 |
34.39 |
20.81 |
2.88 |
5 |
|
WSR01 |
20220118 |
Cloudy |
Moderate |
Mid-Flood |
B |
8.2 |
16:00 |
8.34 |
8.33 |
34.34 |
20.73 |
2.9 |
8 |
|
WSR01 |
20220118 |
Cloudy |
Moderate |
Mid-Flood |
B |
8.2 |
16:00 |
8.22 |
8.34 |
34.32 |
20.67 |
3.04 |
8 |
|
WSR01 |
20220120 |
Sunny |
Moderate |
Mid-Flood |
S |
1 |
8:22 |
8.31 |
8.3 |
33.5 |
20.91 |
3.21 |
5 |
|
WSR01 |
20220120 |
Sunny |
Moderate |
Mid-Flood |
S |
1 |
8:22 |
8.26 |
8.31 |
33.48 |
20.95 |
3.23 |
5 |
|
WSR01 |
20220120 |
Sunny |
Moderate |
Mid-Flood |
M |
4.75 |
8:21 |
8.21 |
8.24 |
33.27 |
20.89 |
2.81 |
5 |
|
WSR01 |
20220120 |
Sunny |
Moderate |
Mid-Flood |
M |
4.75 |
8:21 |
8.32 |
8.23 |
33.46 |
20.87 |
2.68 |
5 |
|
WSR01 |
20220120 |
Sunny |
Moderate |
Mid-Flood |
B |
8.5 |
8:20 |
8.2 |
8.28 |
33.38 |
20.88 |
3.09 |
5 |
|
WSR01 |
20220120 |
Sunny |
Moderate |
Mid-Flood |
B |
8.5 |
8:20 |
8.25 |
8.23 |
33.39 |
20.93 |
2.58 |
5 |
|
WSR01 |
20220122 |
Cloudy |
Moderate |
Mid-Flood |
S |
1 |
8:26 |
8.59 |
8.27 |
33.08 |
21.21 |
2.51 |
4 |
|
WSR01 |
20220122 |
Cloudy |
Moderate |
Mid-Flood |
S |
1 |
8:26 |
8.61 |
8.26 |
33.07 |
21.29 |
2.79 |
4 |
|
WSR01 |
20220122 |
Cloudy |
Moderate |
Mid-Flood |
M |
4.6 |
8:25 |
8.52 |
8.29 |
33.07 |
21.31 |
2.94 |
4 |
|
WSR01 |
20220122 |
Cloudy |
Moderate |
Mid-Flood |
M |
4.6 |
8:25 |
8.5 |
8.27 |
33.07 |
21.16 |
2.83 |
4 |
|
WSR01 |
20220122 |
Cloudy |
Moderate |
Mid-Flood |
B |
8.2 |
8:24 |
8.61 |
8.31 |
33.03 |
21.15 |
2.52 |
4 |
|
WSR01 |
20220122 |
Cloudy |
Moderate |
Mid-Flood |
B |
8.2 |
8:24 |
8.52 |
8.28 |
32.93 |
21.17 |
2.58 |
3 |
|
WSR01 |
20220125 |
Cloudy |
Moderate |
Mid-Flood |
S |
1 |
10:23 |
8.23 |
8.2 |
30.31 |
21.03 |
3.46 |
8 |
|
WSR01 |
20220125 |
Cloudy |
Moderate |
Mid-Flood |
S |
1 |
10:23 |
8.38 |
8.12 |
30.4 |
21.15 |
3.64 |
6 |
|
WSR01 |
20220125 |
Cloudy |
Moderate |
Mid-Flood |
M |
4.25 |
10:22 |
8.32 |
8.12 |
30.42 |
21.13 |
3.38 |
3 |
|
WSR01 |
20220125 |
Cloudy |
Moderate |
Mid-Flood |
M |
4.25 |
10:22 |
8.23 |
8.18 |
30.38 |
21.09 |
3.57 |
3 |
|
WSR01 |
20220125 |
Cloudy |
Moderate |
Mid-Flood |
B |
7.5 |
10:21 |
8.34 |
8.14 |
30.31 |
21.07 |
3.2 |
3 |
|
WSR01 |
20220125 |
Cloudy |
Moderate |
Mid-Flood |
B |
7.5 |
10:21 |
8.25 |
8.24 |
30.32 |
21.13 |
3.21 |
3 |
|
Location |
Date |
Weather |
Sea Conidtion |
Tidal |
Water Level |
Depth (m) |
Time |
DO (mg/L) |
H |
Sal (ppt) |
Temp (�XC) |
Turbidty (NTU) |
SS (mg/L) |
|
WSR01 |
20220127 |
Cloudy |
Moderate |
Mid-Flood |
S |
1 |
11:52 |
8.84 |
8.21 |
31.21 |
21.07 |
2.39 |
5 |
|
WSR01 |
20220127 |
Cloudy |
Moderate |
Mid-Flood |
S |
1 |
11:52 |
8.69 |
8.18 |
31.24 |
21.02 |
2.59 |
4 |
|
WSR01 |
20220127 |
Cloudy |
Moderate |
Mid-Flood |
M |
4.4 |
11:51 |
8.73 |
8.2 |
31.27 |
21.03 |
2.22 |
4 |
|
WSR01 |
20220127 |
Cloudy |
Moderate |
Mid-Flood |
M |
4.4 |
11:51 |
8.7 |
8.17 |
31.28 |
21.08 |
2.12 |
3 |
|
WSR01 |
20220127 |
Cloudy |
Moderate |
Mid-Flood |
B |
7.8 |
11:50 |
8.73 |
8.19 |
31.13 |
21.01 |
2.14 |
4 |
|
WSR01 |
20220127 |
Cloudy |
Moderate |
Mid-Flood |
B |
7.8 |
11:50 |
8.74 |
8.21 |
31.22 |
20.96 |
2.5 |
3 |
|
WSR01 |
20220129 |
Cloudy |
Moderate |
Mid-Flood |
S |
1 |
13:36 |
9.18 |
8.18 |
31.31 |
20.45 |
2.77 |
3 |
|
WSR01 |
20220129 |
Cloudy |
Moderate |
Mid-Flood |
S |
1 |
13:36 |
9.23 |
8.19 |
31.22 |
20.42 |
3.14 |
4 |
|
WSR01 |
20220129 |
Cloudy |
Moderate |
Mid-Flood |
M |
4.65 |
13:35 |
9.17 |
8.17 |
31.27 |
20.36 |
2.71 |
3 |
|
WSR01 |
20220129 |
Cloudy |
Moderate |
Mid-Flood |
M |
4.65 |
13:35 |
9.1 |
8.18 |
31.27 |
20.42 |
2.69 |
6 |
|
WSR01 |
20220129 |
Cloudy |
Moderate |
Mid-Flood |
B |
8.3 |
13:34 |
9.2 |
8.17 |
31.24 |
20.5 |
2.25 |
4 |
|
WSR01 |
20220129 |
Cloudy |
Moderate |
Mid-Flood |
B |
8.3 |
13:34 |
9.11 |
8.19 |
31.15 |
20.37 |
2 |
4 |
|
WSR01 |
20220131 |
Cloudy |
Moderate |
Mid-Flood |
S |
1 |
15:32 |
8.65 |
7.98 |
33.78 |
19.58 |
2.45 |
7 |
|
WSR01 |
20220131 |
Cloudy |
Moderate |
Mid-Flood |
S |
1 |
15:32 |
8.73 |
7.97 |
33.67 |
19.59 |
2.34 |
7 |
|
WSR01 |
20220131 |
Cloudy |
Moderate |
Mid-Flood |
M |
4.65 |
15:31 |
8.7 |
7.97 |
33.7 |
19.6 |
2.19 |
6 |
|
WSR01 |
20220131 |
Cloudy |
Moderate |
Mid-Flood |
M |
4.65 |
15:31 |
8.64 |
8.04 |
33.7 |
19.62 |
2.06 |
6 |
|
WSR01 |
20220131 |
Cloudy |
Moderate |
Mid-Flood |
B |
8.3 |
15:30 |
8.73 |
8.05 |
33.86 |
19.65 |
2 |
2.5 |
|
WSR01 |
20220131 |
Cloudy |
Moderate |
Mid-Flood |
B |
8.3 |
15:30 |
8.64 |
8.02 |
33.75 |
19.65 |
1.95 |
3 |
|
WSR02 |
20220101 |
Cloudy |
Moderate |
Mid-Flood |
S |
1 |
15:16 |
8.46 |
8.44 |
31.4 |
22.06 |
2.03 |
4 |
|
WSR02 |
20220101 |
Cloudy |
Moderate |
Mid-Flood |
S |
1 |
15:16 |
8.3 |
8.47 |
31.44 |
22.01 |
2.15 |
4 |
|
WSR02 |
20220101 |
Cloudy |
Moderate |
Mid-Flood |
M |
4.85 |
15:15 |
8.42 |
8.45 |
31.29 |
21.91 |
2.53 |
5 |
|
WSR02 |
20220101 |
Cloudy |
Moderate |
Mid-Flood |
M |
4.85 |
15:15 |
8.39 |
8.39 |
31.27 |
21.98 |
2.39 |
7 |
|
WSR02 |
20220101 |
Cloudy |
Moderate |
Mid-Flood |
B |
8.7 |
15:14 |
8.44 |
8.36 |
31.45 |
22.09 |
1.83 |
6 |
|
WSR02 |
20220101 |
Cloudy |
Moderate |
Mid-Flood |
B |
8.7 |
15:14 |
8.36 |
8.46 |
31.33 |
22.08 |
2.08 |
8 |
|
WSR02 |
20220104 |
Sunny |
Moderate |
Mid-Flood |
S |
1 |
8:40 |
9.03 |
8.37 |
31.95 |
22.13 |
2.29 |
7 |
|
WSR02 |
20220104 |
Sunny |
Moderate |
Mid-Flood |
S |
1 |
8:40 |
9.04 |
8.31 |
31.89 |
22.2 |
1.93 |
7 |
|
Location |
Date |
Weather |
Sea Conidtion |
Tidal |
Water Level |
Depth (m) |
Time |
DO (mg/L) |
H |
Sal (ppt) |
Temp (�XC) |
Turbidty (NTU) |
SS (mg/L) |
|
WSR02 |
20220104 |
Sunny |
Moderate |
Mid-Flood |
M |
4.55 |
8:39 |
9.09 |
8.39 |
31.83 |
22.08 |
2.21 |
4 |
|
WSR02 |
20220104 |
Sunny |
Moderate |
Mid-Flood |
M |
4.55 |
8:39 |
8.9 |
8.32 |
31.81 |
22.26 |
2.07 |
3 |
|
WSR02 |
20220104 |
Sunny |
Moderate |
Mid-Flood |
B |
8.1 |
8:38 |
8.75 |
8.31 |
31.83 |
22.1 |
1.93 |
2.5 |
|
WSR02 |
20220104 |
Sunny |
Moderate |
Mid-Flood |
B |
8.1 |
8:38 |
8.98 |
8.33 |
31.91 |
22.12 |
2.26 |
3 |
|
WSR02 |
20220106 |
Sunny |
Moderate |
Mid-Flood |
S |
1 |
8:53 |
9.09 |
8.42 |
32.92 |
23.05 |
3.24 |
3 |
|
WSR02 |
20220106 |
Sunny |
Moderate |
Mid-Flood |
S |
1 |
8:53 |
9.17 |
8.36 |
32.79 |
23.12 |
3.26 |
3 |
|
WSR02 |
20220106 |
Sunny |
Moderate |
Mid-Flood |
M |
4.5 |
8:52 |
9.05 |
8.37 |
32.86 |
22.86 |
3.2 |
2.5 |
|
WSR02 |
20220106 |
Sunny |
Moderate |
Mid-Flood |
M |
4.5 |
8:52 |
9.22 |
8.4 |
32.82 |
23.03 |
3.35 |
3 |
|
WSR02 |
20220106 |
Sunny |
Moderate |
Mid-Flood |
B |
8 |
8:51 |
9.21 |
8.4 |
32.78 |
23.17 |
2.49 |
4 |
|
WSR02 |
20220106 |
Sunny |
Moderate |
Mid-Flood |
B |
8 |
8:51 |
9.08 |
8.38 |
32.88 |
23.09 |
2.42 |
4 |
|
WSR02 |
20220108 |
Sunny |
Moderate |
Mid-Flood |
S |
1 |
10:13 |
8.7 |
8.37 |
34.66 |
21.93 |
2.56 |
8 |
|
WSR02 |
20220108 |
Sunny |
Moderate |
Mid-Flood |
S |
1 |
10:13 |
8.68 |
8.3 |
34.62 |
21.94 |
2.41 |
8 |
|
WSR02 |
20220108 |
Sunny |
Moderate |
Mid-Flood |
M |
4.75 |
10:12 |
8.63 |
8.3 |
34.74 |
21.97 |
2.18 |
12 |
|
WSR02 |
20220108 |
Sunny |
Moderate |
Mid-Flood |
M |
4.75 |
10:12 |
8.69 |
8.37 |
34.66 |
21.94 |
2.37 |
12 |
|
WSR02 |
20220108 |
Sunny |
Moderate |
Mid-Flood |
B |
8.5 |
10:11 |
8.67 |
8.39 |
34.68 |
21.9 |
1.98 |
21 |
|
WSR02 |
20220108 |
Sunny |
Moderate |
Mid-Flood |
B |
8.5 |
10:11 |
8.7 |
8.32 |
34.7 |
21.91 |
2.14 |
21 |
|
WSR02 |
20220111 |
Sunny |
Moderate |
Mid-Flood |
S |
1 |
18:17 |
9.84 |
8.26 |
34.93 |
19.7 |
1.73 |
2.5 |
|
WSR02 |
20220111 |
Sunny |
Moderate |
Mid-Flood |
S |
1 |
18:17 |
9.63 |
8.27 |
34.98 |
19.74 |
1.78 |
4 |
|
WSR02 |
20220111 |
Sunny |
Moderate |
Mid-Flood |
M |
4.55 |
18:16 |
9.82 |
8.29 |
34.93 |
19.79 |
2.35 |
2.5 |
|
WSR02 |
20220111 |
Sunny |
Moderate |
Mid-Flood |
M |
4.55 |
18:16 |
9.65 |
8.26 |
34.8 |
19.69 |
2.14 |
3 |
|
WSR02 |
20220111 |
Sunny |
Moderate |
Mid-Flood |
B |
8.1 |
18:15 |
9.85 |
8.27 |
34.94 |
19.69 |
2.11 |
6 |
|
WSR02 |
20220111 |
Sunny |
Moderate |
Mid-Flood |
B |
8.1 |
18:15 |
9.74 |
8.21 |
34.85 |
19.74 |
2.4 |
6 |
|
WSR02 |
20220113 |
Cloudy |
Moderate |
Mid-Flood |
S |
1 |
13:43 |
8.63 |
8.31 |
32.68 |
20.45 |
2.51 |
2.5 |
|
WSR02 |
20220113 |
Cloudy |
Moderate |
Mid-Flood |
S |
1 |
13:43 |
8.69 |
8.35 |
32.59 |
20.43 |
2.67 |
3 |
|
WSR02 |
20220113 |
Cloudy |
Moderate |
Mid-Flood |
M |
4.85 |
13:42 |
8.71 |
8.33 |
32.64 |
20.58 |
2.4 |
2.5 |
|
WSR02 |
20220113 |
Cloudy |
Moderate |
Mid-Flood |
M |
4.85 |
13:42 |
8.66 |
8.32 |
32.61 |
20.57 |
2.27 |
2.5 |
|
Location |
Date |
Weather |
Sea Conidtion |
Tidal |
Water Level |
Depth (m) |
Time |
DO (mg/L) |
H |
Sal (ppt) |
Temp (�XC) |
Turbidty (NTU) |
SS (mg/L) |
|
WSR02 |
20220113 |
Cloudy |
Moderate |
Mid-Flood |
B |
8.7 |
13:41 |
8.58 |
8.31 |
32.67 |
20.37 |
2.05 |
6 |
|
WSR02 |
20220113 |
Cloudy |
Moderate |
Mid-Flood |
B |
8.7 |
13:41 |
8.53 |
8.35 |
32.67 |
20.43 |
2.1 |
6 |
|
WSR02 |
20220115 |
Cloudy |
Moderate |
Mid-Flood |
S |
1 |
14:52 |
8.92 |
8.29 |
33.5 |
21.32 |
2.29 |
4 |
|
WSR02 |
20220115 |
Cloudy |
Moderate |
Mid-Flood |
S |
1 |
14:52 |
9 |
8.28 |
33.43 |
21.4 |
2.36 |
3 |
|
WSR02 |
20220115 |
Cloudy |
Moderate |
Mid-Flood |
M |
4.75 |
14:51 |
8.94 |
8.25 |
33.48 |
21.37 |
2.55 |
2.5 |
|
WSR02 |
20220115 |
Cloudy |
Moderate |
Mid-Flood |
M |
4.75 |
14:51 |
8.93 |
8.25 |
33.48 |
21.26 |
2.28 |
2.5 |
|
WSR02 |
20220115 |
Cloudy |
Moderate |
Mid-Flood |
B |
8.5 |
14:50 |
8.95 |
8.22 |
33.56 |
21.39 |
2.18 |
2.5 |
|
WSR02 |
20220115 |
Cloudy |
Moderate |
Mid-Flood |
B |
8.5 |
14:50 |
8.91 |
8.22 |
33.5 |
21.32 |
2.32 |
2.5 |
|
WSR02 |
20220118 |
Cloudy |
Moderate |
Mid-Flood |
S |
1 |
16:17 |
8.53 |
8.32 |
34.05 |
20.86 |
2.34 |
7 |
|
WSR02 |
20220118 |
Cloudy |
Moderate |
Mid-Flood |
S |
1 |
16:17 |
8.49 |
8.27 |
33.93 |
20.96 |
2.2 |
7 |
|
WSR02 |
20220118 |
Cloudy |
Moderate |
Mid-Flood |
M |
4.55 |
16:16 |
8.46 |
8.27 |
33.99 |
20.81 |
1.88 |
2.5 |
|
WSR02 |
20220118 |
Cloudy |
Moderate |
Mid-Flood |
M |
4.55 |
16:16 |
8.52 |
8.26 |
34.07 |
20.87 |
1.78 |
4 |
|
WSR02 |
20220118 |
Cloudy |
Moderate |
Mid-Flood |
B |
8.1 |
16:15 |
8.64 |
8.21 |
34.03 |
20.89 |
2.71 |
8 |
|
WSR02 |
20220118 |
Cloudy |
Moderate |
Mid-Flood |
B |
8.1 |
16:15 |
8.53 |
8.29 |
33.93 |
20.76 |
2.41 |
7 |
|
WSR02 |
20220120 |
Sunny |
Moderate |
Mid-Flood |
S |
1 |
8:37 |
9 |
8.12 |
34.17 |
20.7 |
3.18 |
5 |
|
WSR02 |
20220120 |
Sunny |
Moderate |
Mid-Flood |
S |
1 |
8:37 |
8.97 |
8.11 |
34.17 |
20.8 |
3.35 |
3 |
|
WSR02 |
20220120 |
Sunny |
Moderate |
Mid-Flood |
M |
4.5 |
8:36 |
8.92 |
8.11 |
34.13 |
20.73 |
3.4 |
4 |
|
WSR02 |
20220120 |
Sunny |
Moderate |
Mid-Flood |
M |
4.5 |
8:36 |
8.95 |
8.14 |
34.05 |
20.68 |
3.43 |
5 |
|
WSR02 |
20220120 |
Sunny |
Moderate |
Mid-Flood |
B |
8 |
8:35 |
8.97 |
8.15 |
34.24 |
20.74 |
3.02 |
5 |
|
WSR02 |
20220120 |
Sunny |
Moderate |
Mid-Flood |
B |
8 |
8:35 |
8.89 |
8.19 |
34.2 |
20.79 |
2.8 |
5 |
|
WSR02 |
20220122 |
Cloudy |
Moderate |
Mid-Flood |
S |
1 |
8:42 |
8.79 |
8.32 |
33.53 |
20.75 |
3.03 |
4 |
|
WSR02 |
20220122 |
Cloudy |
Moderate |
Mid-Flood |
S |
1 |
8:42 |
8.8 |
8.34 |
33.35 |
20.84 |
3.35 |
3 |
|
WSR02 |
20220122 |
Cloudy |
Moderate |
Mid-Flood |
M |
4.6 |
8:41 |
8.73 |
8.28 |
33.52 |
20.8 |
2.75 |
5 |
|
WSR02 |
20220122 |
Cloudy |
Moderate |
Mid-Flood |
M |
4.6 |
8:41 |
8.72 |
8.33 |
33.36 |
20.79 |
2.74 |
4 |
|
WSR02 |
20220122 |
Cloudy |
Moderate |
Mid-Flood |
B |
8.2 |
8:40 |
8.7 |
8.35 |
33.4 |
20.69 |
2.49 |
3 |
|
WSR02 |
20220122 |
Cloudy |
Moderate |
Mid-Flood |
B |
8.2 |
8:40 |
8.78 |
8.28 |
33.48 |
20.84 |
2.49 |
3 |
|
Location |
Date |
Weather |
Sea Conidtion |
Tidal |
Water Level |
Depth (m) |
Time |
DO (mg/L) |
H |
Sal (ppt) |
Temp (�XC) |
Turbidty (NTU) |
SS (mg/L) |
|
WSR02 |
20220125 |
Cloudy |
Moderate |
Mid-Flood |
S |
1 |
10:40 |
8.86 |
8.27 |
31.16 |
20.89 |
2.16 |
4 |
|
WSR02 |
20220125 |
Cloudy |
Moderate |
Mid-Flood |
S |
1 |
10:40 |
8.94 |
8.21 |
31.15 |
20.95 |
2.33 |
3 |
|
WSR02 |
20220125 |
Cloudy |
Moderate |
Mid-Flood |
M |
4.95 |
10:39 |
8.91 |
8.24 |
31.05 |
20.97 |
2.56 |
2.5 |
|
WSR02 |
20220125 |
Cloudy |
Moderate |
Mid-Flood |
M |
4.95 |
10:39 |
8.99 |
8.23 |
31.26 |
20.89 |
2.14 |
3 |
|
WSR02 |
20220125 |
Cloudy |
Moderate |
Mid-Flood |
B |
8.9 |
10:38 |
9.02 |
8.23 |
31.19 |
21.03 |
2.56 |
6 |
|
WSR02 |
20220125 |
Cloudy |
Moderate |
Mid-Flood |
B |
8.9 |
10:38 |
8.84 |
8.19 |
31.26 |
20.91 |
2.55 |
8 |
|
WSR02 |
20220127 |
Cloudy |
Moderate |
Mid-Flood |
S |
1 |
12:11 |
9.19 |
8.07 |
31.75 |
21.31 |
2.15 |
2.5 |
|
WSR02 |
20220127 |
Cloudy |
Moderate |
Mid-Flood |
S |
1 |
12:11 |
9.22 |
8.11 |
31.74 |
21.24 |
1.85 |
2.5 |
|
WSR02 |
20220127 |
Cloudy |
Moderate |
Mid-Flood |
M |
4.6 |
12:10 |
9.13 |
8.14 |
31.68 |
21.29 |
1.89 |
4 |
|
WSR02 |
20220127 |
Cloudy |
Moderate |
Mid-Flood |
M |
4.6 |
12:10 |
9.13 |
8.17 |
31.78 |
21.22 |
2.14 |
7 |
|
WSR02 |
20220127 |
Cloudy |
Moderate |
Mid-Flood |
B |
8.2 |
12:09 |
9.17 |
8.17 |
31.62 |
21.26 |
1.51 |
6 |
|
WSR02 |
20220127 |
Cloudy |
Moderate |
Mid-Flood |
B |
8.2 |
12:09 |
9.1 |
8.1 |
31.66 |
21.29 |
1.68 |
6 |
|
WSR02 |
20220129 |
Cloudy |
Moderate |
Mid-Flood |
S |
1 |
13:56 |
9.74 |
8.23 |
31.2 |
20.58 |
2.3 |
4 |
|
WSR02 |
20220129 |
Cloudy |
Moderate |
Mid-Flood |
S |
1 |
13:56 |
9.63 |
8.29 |
31.21 |
20.63 |
2.52 |
5 |
|
WSR02 |
20220129 |
Cloudy |
Moderate |
Mid-Flood |
M |
4.5 |
13:55 |
9.68 |
8.28 |
31.21 |
20.6 |
2.06 |
5 |
|
WSR02 |
20220129 |
Cloudy |
Moderate |
Mid-Flood |
M |
4.5 |
13:55 |
9.73 |
8.29 |
31.29 |
20.55 |
2.26 |
5 |
|
WSR02 |
20220129 |
Cloudy |
Moderate |
Mid-Flood |
B |
8 |
13:54 |
9.63 |
8.28 |
31.32 |
20.58 |
1.91 |
5 |
|
WSR02 |
20220129 |
Cloudy |
Moderate |
Mid-Flood |
B |
8 |
13:54 |
9.63 |
8.28 |
31.24 |
20.64 |
2.13 |
4 |
|
WSR02 |
20220131 |
Cloudy |
Moderate |
Mid-Flood |
S |
1 |
15:50 |
8.87 |
8.01 |
34.01 |
20.32 |
2.06 |
4 |
|
WSR02 |
20220131 |
Cloudy |
Moderate |
Mid-Flood |
S |
1 |
15:50 |
8.75 |
8.08 |
33.95 |
20.26 |
1.95 |
2.5 |
|
WSR02 |
20220131 |
Cloudy |
Moderate |
Mid-Flood |
M |
4.8 |
15:49 |
8.7 |
8.05 |
33.9 |
20.28 |
2.07 |
5 |
|
WSR02 |
20220131 |
Cloudy |
Moderate |
Mid-Flood |
M |
4.8 |
15:49 |
8.71 |
8.03 |
34.04 |
20.32 |
1.73 |
4 |
|
WSR02 |
20220131 |
Cloudy |
Moderate |
Mid-Flood |
B |
8.6 |
15:48 |
8.88 |
8.01 |
33.98 |
20.29 |
1.77 |
4 |
|
WSR02 |
20220131 |
Cloudy |
Moderate |
Mid-Flood |
B |
8.6 |
15:48 |
8.73 |
8.02 |
34.11 |
20.31 |
1.84 |
5 |
|
WSR03 |
20220101 |
Cloudy |
Moderate |
Mid-Flood |
S |
1 |
15:27 |
8.81 |
8.14 |
31.65 |
21.98 |
2.28 |
5 |
|
WSR03 |
20220101 |
Cloudy |
Moderate |
Mid-Flood |
S |
1 |
15:27 |
8.97 |
8.24 |
31.75 |
22.08 |
2.3 |
5 |
|
Location |
Date |
Weather |
Sea Conidtion |
Tidal |
Water Level |
Depth (m) |
Time |
DO (mg/L) |
H |
Sal (ppt) |
Temp (�XC) |
Turbidty (NTU) |
SS (mg/L) |
|
WSR03 |
20220101 |
Cloudy |
Moderate |
Mid-Flood |
M |
4.15 |
15:26 |
8.9 |
8.17 |
31.73 |
21.94 |
1.89 |
15 |
|
WSR03 |
20220101 |
Cloudy |
Moderate |
Mid-Flood |
M |
4.15 |
15:26 |
8.84 |
8.15 |
31.73 |
22.08 |
2.19 |
15 |
|
WSR03 |
20220101 |
Cloudy |
Moderate |
Mid-Flood |
B |
7.3 |
15:25 |
8.68 |
8.18 |
31.68 |
22.05 |
2.19 |
4 |
|
WSR03 |
20220101 |
Cloudy |
Moderate |
Mid-Flood |
B |
7.3 |
15:25 |
8.92 |
8.15 |
31.73 |
22 |
1.84 |
6 |
|
WSR03 |
20220104 |
Sunny |
Moderate |
Mid-Flood |
S |
1 |
8:52 |
8.17 |
8.31 |
30.82 |
22.7 |
2.01 |
5 |
|
WSR03 |
20220104 |
Sunny |
Moderate |
Mid-Flood |
S |
1 |
8:52 |
8.38 |
8.33 |
30.87 |
22.61 |
2.01 |
4 |
|
WSR03 |
20220104 |
Sunny |
Moderate |
Mid-Flood |
M |
3.75 |
8:51 |
8.22 |
8.33 |
30.86 |
22.64 |
2.51 |
3 |
|
WSR03 |
20220104 |
Sunny |
Moderate |
Mid-Flood |
M |
3.75 |
8:51 |
8.45 |
8.32 |
30.78 |
22.66 |
2.13 |
4 |
|
WSR03 |
20220104 |
Sunny |
Moderate |
Mid-Flood |
B |
6.5 |
8:50 |
8.19 |
8.29 |
30.89 |
22.55 |
2.04 |
2.5 |
|
WSR03 |
20220104 |
Sunny |
Moderate |
Mid-Flood |
B |
6.5 |
8:50 |
8.32 |
8.32 |
30.82 |
22.75 |
2.12 |
3 |
|
WSR03 |
20220106 |
Sunny |
Moderate |
Mid-Flood |
S |
1 |
9:06 |
8.22 |
8.24 |
32.34 |
22.92 |
3.81 |
4 |
|
WSR03 |
20220106 |
Sunny |
Moderate |
Mid-Flood |
S |
1 |
9:06 |
8.28 |
8.25 |
32.32 |
22.99 |
3.94 |
3 |
|
WSR03 |
20220106 |
Sunny |
Moderate |
Mid-Flood |
M |
4.2 |
9:05 |
8.33 |
8.25 |
32.24 |
23.04 |
3.91 |
4 |
|
WSR03 |
20220106 |
Sunny |
Moderate |
Mid-Flood |
M |
4.2 |
9:05 |
8.29 |
8.3 |
32.37 |
22.82 |
3.34 |
2.5 |
|
WSR03 |
20220106 |
Sunny |
Moderate |
Mid-Flood |
B |
7.4 |
9:04 |
8.17 |
8.23 |
32.39 |
22.78 |
3.47 |
3 |
|
WSR03 |
20220106 |
Sunny |
Moderate |
Mid-Flood |
B |
7.4 |
9:04 |
8.19 |
8.26 |
32.31 |
22.75 |
3.66 |
3 |
|
WSR03 |
20220108 |
Sunny |
Moderate |
Mid-Flood |
S |
1 |
10:25 |
8.86 |
8.25 |
34.04 |
21.93 |
2.75 |
18 |
|
WSR03 |
20220108 |
Sunny |
Moderate |
Mid-Flood |
S |
1 |
10:25 |
8.85 |
8.28 |
34.05 |
21.97 |
2.5 |
21 |
|
WSR03 |
20220108 |
Sunny |
Moderate |
Mid-Flood |
M |
4.1 |
10:24 |
8.8 |
8.29 |
34.06 |
21.89 |
2.17 |
20 |
|
WSR03 |
20220108 |
Sunny |
Moderate |
Mid-Flood |
M |
4.1 |
10:24 |
8.77 |
8.32 |
33.98 |
21.99 |
2.54 |
20 |
|
WSR03 |
20220108 |
Sunny |
Moderate |
Mid-Flood |
B |
7.2 |
10:23 |
8.77 |
8.31 |
34.04 |
21.88 |
3.03 |
13 |
|
WSR03 |
20220108 |
Sunny |
Moderate |
Mid-Flood |
B |
7.2 |
10:23 |
8.8 |
8.26 |
33.91 |
21.93 |
2.6 |
13 |
|
WSR03 |
20220111 |
Sunny |
Moderate |
Mid-Flood |
S |
1 |
18:27 |
8.91 |
8.38 |
34.39 |
20.23 |
2.88 |
4 |
|
WSR03 |
20220111 |
Sunny |
Moderate |
Mid-Flood |
S |
1 |
18:27 |
8.91 |
8.32 |
34.16 |
20.21 |
3.25 |
6 |
|
WSR03 |
20220111 |
Sunny |
Moderate |
Mid-Flood |
M |
3.75 |
18:26 |
8.71 |
8.34 |
34.39 |
20.29 |
2.83 |
3 |
|
WSR03 |
20220111 |
Sunny |
Moderate |
Mid-Flood |
M |
3.75 |
18:26 |
8.87 |
8.34 |
34.24 |
20.32 |
2.82 |
4 |
|
Location |
Date |
Weather |
Sea Conidtion |
Tidal |
Water Level |
Depth (m) |
Time |
DO (mg/L) |
H |
Sal (ppt) |
Temp (�XC) |
Turbidty (NTU) |
SS (mg/L) |
|
WSR03 |
20220111 |
Sunny |
Moderate |
Mid-Flood |
B |
6.5 |
18:25 |
8.81 |
8.34 |
34.15 |
20.28 |
2.24 |
13 |
|
WSR03 |
20220111 |
Sunny |
Moderate |
Mid-Flood |
B |
6.5 |
18:25 |
9.02 |
8.39 |
34.22 |
20.22 |
2.6 |
13 |
|
WSR03 |
20220113 |
Cloudy |
Moderate |
Mid-Flood |
S |
1 |
13:54 |
8.5 |
8.3 |
32.46 |
20.77 |
3.5 |
4 |
|
WSR03 |
20220113 |
Cloudy |
Moderate |
Mid-Flood |
S |
1 |
13:54 |
8.53 |
8.33 |
32.34 |
20.63 |
3.6 |
3 |
|
WSR03 |
20220113 |
Cloudy |
Moderate |
Mid-Flood |
M |
3.8 |
13:53 |
8.53 |
8.21 |
32.43 |
20.63 |
3.2 |
7 |
|
WSR03 |
20220113 |
Cloudy |
Moderate |
Mid-Flood |
M |
3.8 |
13:53 |
8.63 |
8.36 |
32.44 |
20.66 |
3.68 |
7 |
|
WSR03 |
20220113 |
Cloudy |
Moderate |
Mid-Flood |
B |
6.6 |
13:52 |
8.62 |
8.37 |
32.34 |
20.72 |
2.68 |
3 |
|
WSR03 |
20220113 |
Cloudy |
Moderate |
Mid-Flood |
B |
6.6 |
13:52 |
8.64 |
8.34 |
32.43 |
20.66 |
3.02 |
3 |
|
WSR03 |
20220115 |
Cloudy |
Moderate |
Mid-Flood |
S |
1 |
15:06 |
8.96 |
8.21 |
34.58 |
21.27 |
2.97 |
2.5 |
|
WSR03 |
20220115 |
Cloudy |
Moderate |
Mid-Flood |
S |
1 |
15:06 |
9.01 |
8.2 |
34.59 |
21.28 |
3.33 |
2.5 |
|
WSR03 |
20220115 |
Cloudy |
Moderate |
Mid-Flood |
M |
3.8 |
15:05 |
8.95 |
8.16 |
34.6 |
21.29 |
3.26 |
5 |
|
WSR03 |
20220115 |
Cloudy |
Moderate |
Mid-Flood |
M |
3.8 |
15:05 |
8.99 |
8.19 |
34.59 |
21.17 |
3.31 |
5 |
|
WSR03 |
20220115 |
Cloudy |
Moderate |
Mid-Flood |
B |
6.6 |
15:04 |
8.94 |
8.19 |
34.55 |
21.23 |
3.28 |
2.5 |
|
WSR03 |
20220115 |
Cloudy |
Moderate |
Mid-Flood |
B |
6.6 |
15:04 |
8.94 |
8.18 |
34.6 |
21.14 |
2.8 |
2.5 |
|
WSR03 |
20220118 |
Cloudy |
Moderate |
Mid-Flood |
S |
1 |
16:26 |
8.09 |
8.16 |
33.09 |
20.6 |
3 |
7 |
|
WSR03 |
20220118 |
Cloudy |
Moderate |
Mid-Flood |
S |
1 |
16:26 |
8.13 |
8.06 |
33.21 |
20.57 |
3.03 |
7 |
|
WSR03 |
20220118 |
Cloudy |
Moderate |
Mid-Flood |
M |
4.25 |
16:25 |
8.07 |
8.08 |
33.17 |
20.57 |
2.8 |
5 |
|
WSR03 |
20220118 |
Cloudy |
Moderate |
Mid-Flood |
M |
4.25 |
16:25 |
8.09 |
8.09 |
33.17 |
20.55 |
2.86 |
8 |
|
WSR03 |
20220118 |
Cloudy |
Moderate |
Mid-Flood |
B |
7.5 |
16:24 |
8.16 |
8.05 |
33.2 |
20.64 |
2.51 |
5 |
|
WSR03 |
20220118 |
Cloudy |
Moderate |
Mid-Flood |
B |
7.5 |
16:24 |
8.09 |
8.09 |
33.18 |
20.61 |
2.68 |
7 |
|
WSR03 |
20220120 |
Sunny |
Moderate |
Mid-Flood |
S |
1 |
8:48 |
8.45 |
8.23 |
34.42 |
20.94 |
3.54 |
4 |
|
WSR03 |
20220120 |
Sunny |
Moderate |
Mid-Flood |
S |
1 |
8:48 |
8.34 |
8.27 |
34.17 |
20.83 |
3.4 |
3 |
|
WSR03 |
20220120 |
Sunny |
Moderate |
Mid-Flood |
M |
3.85 |
8:47 |
8.51 |
8.25 |
34.42 |
20.86 |
3.15 |
5 |
|
WSR03 |
20220120 |
Sunny |
Moderate |
Mid-Flood |
M |
3.85 |
8:47 |
8.35 |
8.24 |
34.24 |
20.89 |
3.67 |
6 |
|
WSR03 |
20220120 |
Sunny |
Moderate |
Mid-Flood |
B |
6.7 |
8:46 |
8.48 |
8.28 |
34.29 |
20.84 |
3.48 |
4 |
|
WSR03 |
20220120 |
Sunny |
Moderate |
Mid-Flood |
B |
6.7 |
8:46 |
8.53 |
8.25 |
34.17 |
20.88 |
3.16 |
5 |
|
Location |
Date |
Weather |
Sea Conidtion |
Tidal |
Water Level |
Depth (m) |
Time |
DO (mg/L) |
H |
Sal (ppt) |
Temp (�XC) |
Turbidty (NTU) |
SS (mg/L) |
|
WSR03 |
20220122 |
Cloudy |
Moderate |
Mid-Flood |
S |
1 |
8:53 |
8.8 |
8.36 |
33.48 |
21.23 |
3.32 |
3 |
|
WSR03 |
20220122 |
Cloudy |
Moderate |
Mid-Flood |
S |
1 |
8:53 |
8.79 |
8.35 |
33.53 |
21.1 |
2.99 |
3 |
|
WSR03 |
20220122 |
Cloudy |
Moderate |
Mid-Flood |
M |
3.95 |
8:52 |
8.88 |
8.34 |
33.49 |
21.2 |
3.11 |
5 |
|
WSR03 |
20220122 |
Cloudy |
Moderate |
Mid-Flood |
M |
3.95 |
8:52 |
8.83 |
8.34 |
33.53 |
21.19 |
2.7 |
5 |
|
WSR03 |
20220122 |
Cloudy |
Moderate |
Mid-Flood |
B |
6.9 |
8:51 |
8.87 |
8.33 |
33.56 |
21.07 |
2.63 |
4 |
|
WSR03 |
20220122 |
Cloudy |
Moderate |
Mid-Flood |
B |
6.9 |
8:51 |
8.86 |
8.33 |
33.51 |
21.08 |
2.89 |
4 |
|
WSR03 |
20220125 |
Cloudy |
Moderate |
Mid-Flood |
S |
1 |
10:51 |
8.94 |
8.26 |
31.09 |
21.05 |
3.63 |
5 |
|
WSR03 |
20220125 |
Cloudy |
Moderate |
Mid-Flood |
S |
1 |
10:51 |
8.98 |
8.16 |
31.18 |
21.09 |
3.78 |
4 |
|
WSR03 |
20220125 |
Cloudy |
Moderate |
Mid-Flood |
M |
3.8 |
10:50 |
8.89 |
8.22 |
31.23 |
21.02 |
3.45 |
6 |
|
WSR03 |
20220125 |
Cloudy |
Moderate |
Mid-Flood |
M |
3.8 |
10:50 |
9.02 |
8.26 |
31.25 |
21.02 |
3.02 |
5 |
|
WSR03 |
20220125 |
Cloudy |
Moderate |
Mid-Flood |
B |
6.6 |
10:49 |
8.9 |
8.16 |
31.21 |
21.03 |
3.2 |
4 |
|
WSR03 |
20220125 |
Cloudy |
Moderate |
Mid-Flood |
B |
6.6 |
10:49 |
9.03 |
8.24 |
31.09 |
21.11 |
3.18 |
3 |
|
WSR03 |
20220127 |
Cloudy |
Moderate |
Mid-Flood |
S |
1 |
12:23 |
8.8 |
8.22 |
31.32 |
20.8 |
2 |
5 |
|
WSR03 |
20220127 |
Cloudy |
Moderate |
Mid-Flood |
S |
1 |
12:23 |
8.84 |
8.24 |
31.4 |
20.7 |
2.28 |
4 |
|
WSR03 |
20220127 |
Cloudy |
Moderate |
Mid-Flood |
M |
3.7 |
12:22 |
8.85 |
8.17 |
31.31 |
20.76 |
2.55 |
6 |
|
WSR03 |
20220127 |
Cloudy |
Moderate |
Mid-Flood |
M |
3.7 |
12:22 |
8.78 |
8.22 |
31.35 |
20.71 |
2.26 |
3 |
|
WSR03 |
20220127 |
Cloudy |
Moderate |
Mid-Flood |
B |
6.4 |
12:21 |
8.76 |
8.18 |
31.32 |
20.74 |
2.27 |
3 |
|
WSR03 |
20220127 |
Cloudy |
Moderate |
Mid-Flood |
B |
6.4 |
12:21 |
8.8 |
8.15 |
31.38 |
20.84 |
2.65 |
4 |
|
WSR03 |
20220129 |
Cloudy |
Moderate |
Mid-Flood |
S |
1 |
14:10 |
9.25 |
8.08 |
31.41 |
20.31 |
2.88 |
6 |
|
WSR03 |
20220129 |
Cloudy |
Moderate |
Mid-Flood |
S |
1 |
14:10 |
9.33 |
8.06 |
31.53 |
20.47 |
2.43 |
4 |
|
WSR03 |
20220129 |
Cloudy |
Moderate |
Mid-Flood |
M |
4.25 |
14:09 |
9.23 |
8.06 |
31.49 |
20.3 |
2.21 |
5 |
|
WSR03 |
20220129 |
Cloudy |
Moderate |
Mid-Flood |
M |
4.25 |
14:09 |
9.24 |
8.05 |
31.48 |
20.45 |
2.27 |
5 |
|
WSR03 |
20220129 |
Cloudy |
Moderate |
Mid-Flood |
B |
7.5 |
14:08 |
9.32 |
8.16 |
31.42 |
20.36 |
1.68 |
5 |
|
WSR03 |
20220129 |
Cloudy |
Moderate |
Mid-Flood |
B |
7.5 |
14:08 |
9.29 |
8.11 |
31.48 |
20.47 |
1.68 |
3 |
|
WSR03 |
20220131 |
Cloudy |
Moderate |
Mid-Flood |
S |
1 |
16:03 |
8.85 |
7.94 |
33.71 |
19.96 |
2.89 |
21 |
|
WSR03 |
20220131 |
Cloudy |
Moderate |
Mid-Flood |
S |
1 |
16:03 |
8.89 |
7.99 |
33.65 |
19.92 |
2.48 |
22 |
|
Location |
Date |
Weather |
Sea Conidtion |
Tidal |
Water Level |
Depth (m) |
Time |
DO (mg/L) |
H |
Sal (ppt) |
Temp (�XC) |
Turbidty (NTU) |
SS (mg/L) |
|
WSR03 |
20220131 |
Cloudy |
Moderate |
Mid-Flood |
M |
3.8 |
16:02 |
8.82 |
8.01 |
33.65 |
19.93 |
2.25 |
9 |
|
WSR03 |
20220131 |
Cloudy |
Moderate |
Mid-Flood |
M |
3.8 |
16:02 |
8.85 |
8 |
33.7 |
19.94 |
2.37 |
9 |
|
WSR03 |
20220131 |
Cloudy |
Moderate |
Mid-Flood |
B |
6.6 |
16:01 |
8.85 |
7.95 |
33.67 |
19.94 |
2.31 |
4 |
|
WSR03 |
20220131 |
Cloudy |
Moderate |
Mid-Flood |
B |
6.6 |
16:01 |
8.82 |
7.99 |
33.71 |
19.97 |
1.93 |
3 |
|
WSR04 |
20220101 |
Cloudy |
Moderate |
Mid-Flood |
S |
1 |
15:40 |
8.51 |
8.36 |
31.5 |
22.35 |
2.87 |
9 |
|
WSR04 |
20220101 |
Cloudy |
Moderate |
Mid-Flood |
S |
1 |
15:40 |
8.65 |
8.28 |
31.48 |
22.34 |
2.87 |
7 |
|
WSR04 |
20220101 |
Cloudy |
Moderate |
Mid-Flood |
M |
3.8 |
15:39 |
8.62 |
8.35 |
31.56 |
22.45 |
2.19 |
5 |
|
WSR04 |
20220101 |
Cloudy |
Moderate |
Mid-Flood |
M |
3.8 |
15:39 |
8.49 |
8.3 |
31.39 |
22.33 |
2.57 |
6 |
|
WSR04 |
20220101 |
Cloudy |
Moderate |
Mid-Flood |
B |
6.6 |
15:38 |
8.51 |
8.28 |
31.5 |
22.35 |
1.81 |
5 |
|
WSR04 |
20220101 |
Cloudy |
Moderate |
Mid-Flood |
B |
6.6 |
15:38 |
8.51 |
8.29 |
31.5 |
22.39 |
1.79 |
5 |
|
WSR04 |
20220104 |
Sunny |
Moderate |
Mid-Flood |
S |
1 |
9:04 |
8.26 |
8.24 |
31.8 |
22.4 |
1.95 |
7 |
|
WSR04 |
20220104 |
Sunny |
Moderate |
Mid-Flood |
S |
1 |
9:04 |
8.34 |
8.32 |
31.77 |
22.33 |
1.87 |
7 |
|
WSR04 |
20220104 |
Sunny |
Moderate |
Mid-Flood |
M |
3.6 |
9:03 |
8.03 |
8.28 |
31.89 |
22.32 |
1.94 |
3 |
|
WSR04 |
20220104 |
Sunny |
Moderate |
Mid-Flood |
M |
3.6 |
9:03 |
7.98 |
8.25 |
31.77 |
22.21 |
2.16 |
4 |
|
WSR04 |
20220104 |
Sunny |
Moderate |
Mid-Flood |
B |
6.2 |
9:02 |
7.98 |
8.31 |
31.83 |
22.31 |
2.33 |
3 |
|
WSR04 |
20220104 |
Sunny |
Moderate |
Mid-Flood |
B |
6.2 |
9:02 |
8.18 |
8.3 |
31.82 |
22.18 |
2.21 |
3 |
|
WSR04 |
20220106 |
Sunny |
Moderate |
Mid-Flood |
S |
1 |
9:18 |
8.99 |
8.3 |
32.12 |
22.37 |
3.44 |
2.5 |
|
WSR04 |
20220106 |
Sunny |
Moderate |
Mid-Flood |
S |
1 |
9:18 |
8.91 |
8.32 |
32.08 |
22.48 |
3.58 |
3 |
|
WSR04 |
20220106 |
Sunny |
Moderate |
Mid-Flood |
M |
3.35 |
9:17 |
8.91 |
8.33 |
32.11 |
22.28 |
2.92 |
3 |
|
WSR04 |
20220106 |
Sunny |
Moderate |
Mid-Flood |
M |
3.35 |
9:17 |
8.98 |
8.32 |
31.96 |
22.39 |
3.07 |
3 |
|
WSR04 |
20220106 |
Sunny |
Moderate |
Mid-Flood |
B |
5.7 |
9:16 |
8.96 |
8.35 |
32.07 |
22.26 |
2.71 |
4 |
|
WSR04 |
20220106 |
Sunny |
Moderate |
Mid-Flood |
B |
5.7 |
9:16 |
8.97 |
8.31 |
31.99 |
22.27 |
2.64 |
7 |
|
WSR04 |
20220108 |
Sunny |
Moderate |
Mid-Flood |
S |
1 |
10:38 |
9 |
8.29 |
34.91 |
21.9 |
2.95 |
19 |
|
WSR04 |
20220108 |
Sunny |
Moderate |
Mid-Flood |
S |
1 |
10:38 |
9 |
8.3 |
34.87 |
21.97 |
2.59 |
19 |
|
WSR04 |
20220108 |
Sunny |
Moderate |
Mid-Flood |
M |
3.85 |
10:37 |
9.04 |
8.33 |
34.87 |
21.89 |
2.25 |
4 |
|
WSR04 |
20220108 |
Sunny |
Moderate |
Mid-Flood |
M |
3.85 |
10:37 |
9.06 |
8.28 |
34.86 |
21.97 |
2.41 |
4 |
|
Location |
Date |
Weather |
Sea Conidtion |
Tidal |
Water Level |
Depth (m) |
Time |
DO (mg/L) |
H |
Sal (ppt) |
Temp (�XC) |
Turbidty (NTU) |
SS (mg/L) |
|
WSR04 |
20220108 |
Sunny |
Moderate |
Mid-Flood |
B |
6.7 |
10:36 |
9.06 |
8.37 |
34.8 |
22 |
3.04 |
36 |
|
WSR04 |
20220108 |
Sunny |
Moderate |
Mid-Flood |
B |
6.7 |
10:36 |
9.05 |
8.32 |
34.89 |
21.9 |
3.21 |
36 |
|
WSR04 |
20220111 |
Sunny |
Moderate |
Mid-Flood |
S |
1 |
18:38 |
9.51 |
8.34 |
35.32 |
20.4 |
2.99 |
4 |
|
WSR04 |
20220111 |
Sunny |
Moderate |
Mid-Flood |
S |
1 |
18:38 |
9.4 |
8.29 |
35.32 |
20.45 |
3.08 |
5 |
|
WSR04 |
20220111 |
Sunny |
Moderate |
Mid-Flood |
M |
3.65 |
18:37 |
9.36 |
8.35 |
35.13 |
20.45 |
2.8 |
3 |
|
WSR04 |
20220111 |
Sunny |
Moderate |
Mid-Flood |
M |
3.65 |
18:37 |
9.32 |
8.31 |
35.21 |
20.44 |
3.14 |
4 |
|
WSR04 |
20220111 |
Sunny |
Moderate |
Mid-Flood |
B |
6.3 |
18:36 |
9.51 |
8.32 |
35.28 |
20.39 |
2.46 |
7 |
|
WSR04 |
20220111 |
Sunny |
Moderate |
Mid-Flood |
B |
6.3 |
18:36 |
9.53 |
8.3 |
35.15 |
20.38 |
2.33 |
5 |
|
WSR04 |
20220113 |
Cloudy |
Moderate |
Mid-Flood |
S |
1 |
14:08 |
9.04 |
8.32 |
32.33 |
20.59 |
3.08 |
3 |
|
WSR04 |
20220113 |
Cloudy |
Moderate |
Mid-Flood |
S |
1 |
14:08 |
8.36 |
8.35 |
32.31 |
20.54 |
3.08 |
3 |
|
WSR04 |
20220113 |
Cloudy |
Moderate |
Mid-Flood |
M |
3.45 |
14:07 |
8.78 |
8.3 |
32.3 |
20.5 |
2.75 |
3 |
|
WSR04 |
20220113 |
Cloudy |
Moderate |
Mid-Flood |
M |
3.45 |
14:07 |
8.99 |
8.3 |
32.27 |
20.58 |
2.83 |
2.5 |
|
WSR04 |
20220113 |
Cloudy |
Moderate |
Mid-Flood |
B |
5.9 |
14:06 |
8.54 |
8.36 |
32.21 |
20.52 |
2.58 |
3 |
|
WSR04 |
20220113 |
Cloudy |
Moderate |
Mid-Flood |
B |
5.9 |
14:06 |
8.66 |
8.33 |
32.24 |
20.47 |
2.89 |
3 |
|
WSR04 |
20220115 |
Cloudy |
Moderate |
Mid-Flood |
S |
1 |
15:20 |
8.52 |
8.12 |
33.45 |
21.16 |
2.83 |
2.5 |
|
WSR04 |
20220115 |
Cloudy |
Moderate |
Mid-Flood |
S |
1 |
15:20 |
8.55 |
8.12 |
33.52 |
21.11 |
2.92 |
2.5 |
|
WSR04 |
20220115 |
Cloudy |
Moderate |
Mid-Flood |
M |
3.75 |
15:19 |
8.49 |
8.18 |
33.5 |
21.16 |
2.28 |
3 |
|
WSR04 |
20220115 |
Cloudy |
Moderate |
Mid-Flood |
M |
3.75 |
15:19 |
8.61 |
8.17 |
33.54 |
21.06 |
2.36 |
2.5 |
|
WSR04 |
20220115 |
Cloudy |
Moderate |
Mid-Flood |
B |
6.5 |
15:18 |
8.54 |
8.12 |
33.51 |
21.01 |
2.43 |
3 |
|
WSR04 |
20220115 |
Cloudy |
Moderate |
Mid-Flood |
B |
6.5 |
15:18 |
8.62 |
8.17 |
33.6 |
21.11 |
2.84 |
2.5 |
|
WSR04 |
20220118 |
Cloudy |
Moderate |
Mid-Flood |
S |
1 |
16:37 |
8.67 |
8.29 |
33.23 |
20.59 |
2.69 |
16 |
|
WSR04 |
20220118 |
Cloudy |
Moderate |
Mid-Flood |
S |
1 |
16:37 |
8.72 |
8.27 |
33.14 |
20.71 |
2.87 |
15 |
|
WSR04 |
20220118 |
Cloudy |
Moderate |
Mid-Flood |
M |
3.9 |
16:36 |
8.63 |
8.29 |
33.1 |
20.81 |
3.02 |
5 |
|
WSR04 |
20220118 |
Cloudy |
Moderate |
Mid-Flood |
M |
3.9 |
16:36 |
8.65 |
8.21 |
33.23 |
20.78 |
3.04 |
5 |
|
WSR04 |
20220118 |
Cloudy |
Moderate |
Mid-Flood |
B |
6.8 |
16:35 |
8.62 |
8.3 |
33.21 |
20.66 |
2.27 |
7 |
|
WSR04 |
20220118 |
Cloudy |
Moderate |
Mid-Flood |
B |
6.8 |
16:35 |
8.68 |
8.19 |
33.11 |
20.79 |
2.56 |
5 |
|
Location |
Date |
Weather |
Sea Conidtion |
Tidal |
Water Level |
Depth (m) |
Time |
DO (mg/L) |
H |
Sal (ppt) |
Temp (�XC) |
Turbidty (NTU) |
SS (mg/L) |
|
WSR04 |
20220120 |
Sunny |
Moderate |
Mid-Flood |
S |
1 |
8:59 |
8.36 |
8.11 |
33.31 |
20.86 |
3.39 |
5 |
|
WSR04 |
20220120 |
Sunny |
Moderate |
Mid-Flood |
S |
1 |
8:59 |
8.29 |
8.1 |
33.15 |
20.86 |
3.1 |
5 |
|
WSR04 |
20220120 |
Sunny |
Moderate |
Mid-Flood |
M |
3.5 |
8:58 |
8.3 |
8.11 |
33.17 |
20.83 |
2.66 |
5 |
|
WSR04 |
20220120 |
Sunny |
Moderate |
Mid-Flood |
M |
3.5 |
8:58 |
8.32 |
8.15 |
33.13 |
20.83 |
3.04 |
6 |
|
WSR04 |
20220120 |
Sunny |
Moderate |
Mid-Flood |
B |
6 |
8:57 |
8.2 |
8.06 |
33.34 |
20.8 |
3.13 |
5 |
|
WSR04 |
20220120 |
Sunny |
Moderate |
Mid-Flood |
B |
6 |
8:57 |
8.26 |
8.08 |
33.16 |
20.85 |
2.68 |
5 |
|
WSR04 |
20220122 |
Cloudy |
Moderate |
Mid-Flood |
S |
1 |
9:04 |
8.73 |
8.15 |
33.71 |
21.37 |
2.91 |
8 |
|
WSR04 |
20220122 |
Cloudy |
Moderate |
Mid-Flood |
S |
1 |
9:04 |
8.67 |
8.14 |
33.71 |
21.27 |
3.36 |
7 |
|
WSR04 |
20220122 |
Cloudy |
Moderate |
Mid-Flood |
M |
3.75 |
9:03 |
8.69 |
8.16 |
33.65 |
21.25 |
2.95 |
12 |
|
WSR04 |
20220122 |
Cloudy |
Moderate |
Mid-Flood |
M |
3.75 |
9:03 |
8.75 |
8.15 |
33.87 |
21.3 |
2.99 |
14 |
|
WSR04 |
20220122 |
Cloudy |
Moderate |
Mid-Flood |
B |
6.5 |
9:02 |
8.73 |
8.2 |
33.7 |
21.23 |
2.4 |
13 |
|
WSR04 |
20220122 |
Cloudy |
Moderate |
Mid-Flood |
B |
6.5 |
9:02 |
8.7 |
8.19 |
33.76 |
21.37 |
2.84 |
10 |
|
WSR04 |
20220125 |
Cloudy |
Moderate |
Mid-Flood |
S |
1 |
11:02 |
8.74 |
8.12 |
31.14 |
21.05 |
3.44 |
5 |
|
WSR04 |
20220125 |
Cloudy |
Moderate |
Mid-Flood |
S |
1 |
11:02 |
8.7 |
8.16 |
31.01 |
21.07 |
3.82 |
5 |
|
WSR04 |
20220125 |
Cloudy |
Moderate |
Mid-Flood |
M |
3.4 |
11:01 |
8.74 |
8.13 |
30.95 |
20.92 |
3.56 |
3 |
|
WSR04 |
20220125 |
Cloudy |
Moderate |
Mid-Flood |
M |
3.4 |
11:01 |
8.74 |
8.25 |
31.15 |
21 |
3.59 |
3 |
|
WSR04 |
20220125 |
Cloudy |
Moderate |
Mid-Flood |
B |
5.8 |
11:00 |
8.78 |
8.12 |
31.02 |
21.04 |
3.52 |
4 |
|
WSR04 |
20220125 |
Cloudy |
Moderate |
Mid-Flood |
B |
5.8 |
11:00 |
8.76 |
8.2 |
31.04 |
20.95 |
3.46 |
4 |
|
WSR04 |
20220127 |
Cloudy |
Moderate |
Mid-Flood |
S |
1 |
12:36 |
8.82 |
8.06 |
30.86 |
21.06 |
2.71 |
4 |
|
WSR04 |
20220127 |
Cloudy |
Moderate |
Mid-Flood |
S |
1 |
12:36 |
8.86 |
8 |
30.94 |
21.11 |
2.45 |
5 |
|
WSR04 |
20220127 |
Cloudy |
Moderate |
Mid-Flood |
M |
3.7 |
12:35 |
8.82 |
8 |
30.94 |
20.99 |
2.42 |
6 |
|
WSR04 |
20220127 |
Cloudy |
Moderate |
Mid-Flood |
M |
3.7 |
12:35 |
8.87 |
8 |
30.89 |
21.07 |
2.7 |
6 |
|
WSR04 |
20220127 |
Cloudy |
Moderate |
Mid-Flood |
B |
6.4 |
12:34 |
8.84 |
7.99 |
30.87 |
21.04 |
2.26 |
4 |
|
WSR04 |
20220127 |
Cloudy |
Moderate |
Mid-Flood |
B |
6.4 |
12:34 |
8.79 |
7.99 |
30.93 |
21 |
2.61 |
6 |
|
WSR04 |
20220129 |
Cloudy |
Moderate |
Mid-Flood |
S |
1 |
14:22 |
9.51 |
8.2 |
30.66 |
20.36 |
2.46 |
5 |
|
WSR04 |
20220129 |
Cloudy |
Moderate |
Mid-Flood |
S |
1 |
14:22 |
9.62 |
8.27 |
30.6 |
20.39 |
2.73 |
4 |
|
Location |
Date |
Weather |
Sea Conidtion |
Tidal |
Water Level |
Depth (m) |
Time |
DO (mg/L) |
H |
Sal (ppt) |
Temp (�XC) |
Turbidty (NTU) |
SS (mg/L) |
|
WSR04 |
20220129 |
Cloudy |
Moderate |
Mid-Flood |
M |
3.4 |
14:21 |
9.6 |
8.24 |
30.65 |
20.42 |
2.45 |
6 |
|
WSR04 |
20220129 |
Cloudy |
Moderate |
Mid-Flood |
M |
3.4 |
14:21 |
9.54 |
8.29 |
30.73 |
20.41 |
2.9 |
6 |
|
WSR04 |
20220129 |
Cloudy |
Moderate |
Mid-Flood |
B |
5.8 |
14:20 |
9.6 |
8.2 |
30.58 |
20.27 |
2.54 |
4 |
|
WSR04 |
20220129 |
Cloudy |
Moderate |
Mid-Flood |
B |
5.8 |
14:20 |
9.49 |
8.25 |
30.59 |
20.31 |
2.83 |
5 |
|
WSR04 |
20220131 |
Cloudy |
Moderate |
Mid-Flood |
S |
1 |
16:16 |
8.72 |
7.98 |
33.51 |
20.03 |
2.59 |
12 |
|
WSR04 |
20220131 |
Cloudy |
Moderate |
Mid-Flood |
S |
1 |
16:16 |
8.82 |
8.06 |
33.55 |
20.05 |
2.88 |
12 |
|
WSR04 |
20220131 |
Cloudy |
Moderate |
Mid-Flood |
M |
3.4 |
16:15 |
8.69 |
8.02 |
33.65 |
20.02 |
2.87 |
3 |
|
WSR04 |
20220131 |
Cloudy |
Moderate |
Mid-Flood |
M |
3.4 |
16:15 |
8.65 |
8.01 |
33.46 |
20.05 |
2.95 |
4 |
|
WSR04 |
20220131 |
Cloudy |
Moderate |
Mid-Flood |
B |
5.8 |
16:14 |
8.82 |
8.04 |
33.52 |
20.06 |
2.04 |
3 |
|
WSR04 |
20220131 |
Cloudy |
Moderate |
Mid-Flood |
B |
5.8 |
16:14 |
8.73 |
8.04 |
33.62 |
20.03 |
2.15 |
3 |
|
WSR16 |
20220101 |
Cloudy |
Moderate |
Mid-Flood |
S |
1 |
16:42 |
9 |
8.21 |
31.29 |
22.49 |
2.31 |
14 |
|
WSR16 |
20220101 |
Cloudy |
Moderate |
Mid-Flood |
S |
1 |
16:42 |
8.88 |
8.25 |
31.32 |
22.51 |
2.47 |
14 |
|
WSR16 |
20220101 |
Cloudy |
Moderate |
Mid-Flood |
M |
8.55 |
16:41 |
9.01 |
8.24 |
31.24 |
22.42 |
2.12 |
9 |
|
WSR16 |
20220101 |
Cloudy |
Moderate |
Mid-Flood |
M |
8.55 |
16:41 |
9 |
8.27 |
31.21 |
22.39 |
1.89 |
5 |
|
WSR16 |
20220101 |
Cloudy |
Moderate |
Mid-Flood |
B |
16.1 |
16:40 |
8.95 |
8.17 |
31.3 |
22.41 |
1.67 |
4 |
|
WSR16 |
20220101 |
Cloudy |
Moderate |
Mid-Flood |
B |
16.1 |
16:40 |
8.87 |
8.17 |
31.32 |
22.35 |
1.68 |
4 |
|
WSR16 |
20220104 |
Sunny |
Moderate |
Mid-Flood |
S |
1 |
10:07 |
8.43 |
8.32 |
31.84 |
22.33 |
2.16 |
3 |
|
WSR16 |
20220104 |
Sunny |
Moderate |
Mid-Flood |
S |
1 |
10:07 |
8.55 |
8.31 |
31.81 |
22.42 |
2.38 |
3 |
|
WSR16 |
20220104 |
Sunny |
Moderate |
Mid-Flood |
M |
7.75 |
10:06 |
8.46 |
8.36 |
31.88 |
22.34 |
2.73 |
4 |
|
WSR16 |
20220104 |
Sunny |
Moderate |
Mid-Flood |
M |
7.75 |
10:06 |
8.44 |
8.38 |
31.79 |
22.49 |
2.38 |
8 |
|
WSR16 |
20220104 |
Sunny |
Moderate |
Mid-Flood |
B |
14.5 |
10:05 |
8.63 |
8.34 |
31.83 |
22.46 |
2.5 |
5 |
|
WSR16 |
20220104 |
Sunny |
Moderate |
Mid-Flood |
B |
14.5 |
10:05 |
8.58 |
8.37 |
31.91 |
22.34 |
2.12 |
6 |
|
WSR16 |
20220106 |
Sunny |
Moderate |
Mid-Flood |
S |
1 |
10:23 |
8.81 |
8.42 |
32.46 |
22.73 |
2.79 |
4 |
|
WSR16 |
20220106 |
Sunny |
Moderate |
Mid-Flood |
S |
1 |
10:23 |
8.88 |
8.44 |
32.3 |
22.67 |
2.84 |
3 |
|
WSR16 |
20220106 |
Sunny |
Moderate |
Mid-Flood |
M |
8.15 |
10:22 |
8.92 |
8.46 |
32.26 |
22.77 |
3.05 |
4 |
|
WSR16 |
20220106 |
Sunny |
Moderate |
Mid-Flood |
M |
8.15 |
10:22 |
8.86 |
8.41 |
32.35 |
22.89 |
2.78 |
3 |
|
Location |
Date |
Weather |
Sea Conidtion |
Tidal |
Water Level |
Depth (m) |
Time |
DO (mg/L) |
H |
Sal (ppt) |
Temp (�XC) |
Turbidty (NTU) |
SS (mg/L) |
|
WSR16 |
20220106 |
Sunny |
Moderate |
Mid-Flood |
B |
15.3 |
10:21 |
8.79 |
8.45 |
32.27 |
22.92 |
2.75 |
3 |
|
WSR16 |
20220106 |
Sunny |
Moderate |
Mid-Flood |
B |
15.3 |
10:21 |
8.81 |
8.41 |
32.4 |
22.63 |
2.7 |
3 |
|
WSR16 |
20220108 |
Sunny |
Moderate |
Mid-Flood |
S |
1 |
11:39 |
8.32 |
8.34 |
33.96 |
22.08 |
2.84 |
3 |
|
WSR16 |
20220108 |
Sunny |
Moderate |
Mid-Flood |
S |
1 |
11:39 |
8.27 |
8.33 |
33.99 |
22.02 |
3 |
4 |
|
WSR16 |
20220108 |
Sunny |
Moderate |
Mid-Flood |
M |
7.7 |
11:38 |
8.3 |
8.38 |
34.08 |
22.06 |
2.83 |
18 |
|
WSR16 |
20220108 |
Sunny |
Moderate |
Mid-Flood |
M |
7.7 |
11:38 |
8.24 |
8.34 |
34 |
22.08 |
2.37 |
18 |
|
WSR16 |
20220108 |
Sunny |
Moderate |
Mid-Flood |
B |
14.4 |
11:37 |
8.29 |
8.38 |
34.04 |
22.09 |
1.99 |
5 |
|
WSR16 |
20220108 |
Sunny |
Moderate |
Mid-Flood |
B |
14.4 |
11:37 |
8.3 |
8.33 |
34.03 |
22.02 |
2.32 |
6 |
|
WSR16 |
20220111 |
Sunny |
Moderate |
Mid-Flood |
S |
1 |
19:41 |
9.77 |
8.28 |
34.41 |
20.31 |
2.19 |
5 |
|
WSR16 |
20220111 |
Sunny |
Moderate |
Mid-Flood |
S |
1 |
19:41 |
9.73 |
8.25 |
34.31 |
20.44 |
2.36 |
5 |
|
WSR16 |
20220111 |
Sunny |
Moderate |
Mid-Flood |
M |
8.15 |
19:40 |
9.59 |
8.29 |
34.41 |
20.29 |
2.59 |
5 |
|
WSR16 |
20220111 |
Sunny |
Moderate |
Mid-Flood |
M |
8.15 |
19:40 |
9.53 |
8.29 |
34.47 |
20.27 |
2.35 |
8 |
|
WSR16 |
20220111 |
Sunny |
Moderate |
Mid-Flood |
B |
15.3 |
19:39 |
9.83 |
8.21 |
34.29 |
20.44 |
1.79 |
6 |
|
WSR16 |
20220111 |
Sunny |
Moderate |
Mid-Flood |
B |
15.3 |
19:39 |
9.56 |
8.29 |
34.3 |
20.42 |
1.68 |
6 |
|
WSR16 |
20220113 |
Cloudy |
Moderate |
Mid-Flood |
S |
1 |
15:09 |
8.96 |
8.29 |
32.44 |
20.61 |
4.12 |
8 |
|
WSR16 |
20220113 |
Cloudy |
Moderate |
Mid-Flood |
S |
1 |
15:09 |
8.85 |
8.25 |
32.52 |
20.74 |
3.87 |
8 |
|
WSR16 |
20220113 |
Cloudy |
Moderate |
Mid-Flood |
M |
8.4 |
15:08 |
8.85 |
8.32 |
32.45 |
20.75 |
3.85 |
3 |
|
WSR16 |
20220113 |
Cloudy |
Moderate |
Mid-Flood |
M |
8.4 |
15:08 |
8.79 |
8.3 |
32.54 |
20.66 |
3.71 |
3 |
|
WSR16 |
20220113 |
Cloudy |
Moderate |
Mid-Flood |
B |
15.8 |
15:07 |
8.79 |
8.35 |
32.46 |
20.59 |
3.4 |
2.5 |
|
WSR16 |
20220113 |
Cloudy |
Moderate |
Mid-Flood |
B |
15.8 |
15:07 |
8.83 |
8.33 |
32.53 |
20.63 |
2.98 |
3 |
|
WSR16 |
20220115 |
Cloudy |
Moderate |
Mid-Flood |
S |
1 |
16:27 |
8.32 |
8.26 |
33.6 |
20.97 |
3.77 |
3 |
|
WSR16 |
20220115 |
Cloudy |
Moderate |
Mid-Flood |
S |
1 |
16:27 |
8.3 |
8.26 |
33.54 |
20.94 |
3.79 |
2.5 |
|
WSR16 |
20220115 |
Cloudy |
Moderate |
Mid-Flood |
M |
8.25 |
16:26 |
8.33 |
8.25 |
33.48 |
21.06 |
3.39 |
4 |
|
WSR16 |
20220115 |
Cloudy |
Moderate |
Mid-Flood |
M |
8.25 |
16:26 |
8.38 |
8.25 |
33.5 |
21.07 |
2.87 |
2.5 |
|
WSR16 |
20220115 |
Cloudy |
Moderate |
Mid-Flood |
B |
15.5 |
16:25 |
8.34 |
8.27 |
33.52 |
20.96 |
3.06 |
2.5 |
|
WSR16 |
20220115 |
Cloudy |
Moderate |
Mid-Flood |
B |
15.5 |
16:25 |
8.37 |
8.24 |
33.52 |
21.01 |
2.57 |
2.5 |
|
Location |
Date |
Weather |
Sea Conidtion |
Tidal |
Water Level |
Depth (m) |
Time |
DO (mg/L) |
H |
Sal (ppt) |
Temp (�XC) |
Turbidty (NTU) |
SS (mg/L) |
|
WSR16 |
20220118 |
Cloudy |
Moderate |
Mid-Flood |
S |
1 |
17:35 |
8.66 |
8.24 |
34.08 |
21.03 |
2.59 |
5 |
|
WSR16 |
20220118 |
Cloudy |
Moderate |
Mid-Flood |
S |
1 |
17:35 |
8.7 |
8.24 |
34.03 |
20.52 |
2.56 |
7 |
|
WSR16 |
20220118 |
Cloudy |
Moderate |
Mid-Flood |
M |
8.55 |
17:34 |
8.56 |
8.22 |
34.09 |
21.14 |
2.32 |
12 |
|
WSR16 |
20220118 |
Cloudy |
Moderate |
Mid-Flood |
M |
8.55 |
17:34 |
8.56 |
8.2 |
34.04 |
21.06 |
2.69 |
12 |
|
WSR16 |
20220118 |
Cloudy |
Moderate |
Mid-Flood |
B |
16.1 |
17:33 |
8.56 |
8.18 |
34.08 |
20.52 |
2.25 |
7 |
|
WSR16 |
20220118 |
Cloudy |
Moderate |
Mid-Flood |
B |
16.1 |
17:33 |
8.63 |
8.16 |
34 |
21.04 |
2.19 |
7 |
|
WSR16 |
20220120 |
Sunny |
Moderate |
Mid-Flood |
S |
1 |
10:02 |
8.35 |
8.31 |
33.99 |
20.65 |
3.43 |
4 |
|
WSR16 |
20220120 |
Sunny |
Moderate |
Mid-Flood |
S |
1 |
10:02 |
8.4 |
8.29 |
33.86 |
20.78 |
3.47 |
5 |
|
WSR16 |
20220120 |
Sunny |
Moderate |
Mid-Flood |
M |
7.95 |
10:01 |
8.33 |
8.29 |
33.83 |
20.71 |
3.43 |
6 |
|
WSR16 |
20220120 |
Sunny |
Moderate |
Mid-Flood |
M |
7.95 |
10:01 |
8.41 |
8.29 |
33.8 |
20.7 |
3.7 |
7 |
|
WSR16 |
20220120 |
Sunny |
Moderate |
Mid-Flood |
B |
14.9 |
10:00 |
8.29 |
8.25 |
33.99 |
20.68 |
2.8 |
6 |
|
WSR16 |
20220120 |
Sunny |
Moderate |
Mid-Flood |
B |
14.9 |
10:00 |
8.34 |
8.3 |
33.92 |
20.71 |
2.98 |
5 |
|
WSR16 |
20220122 |
Cloudy |
Moderate |
Mid-Flood |
S |
1 |
10:04 |
8.63 |
8.3 |
33.32 |
20.76 |
3 |
4 |
|
WSR16 |
20220122 |
Cloudy |
Moderate |
Mid-Flood |
S |
1 |
10:04 |
8.62 |
8.3 |
33.44 |
20.7 |
2.88 |
4 |
|
WSR16 |
20220122 |
Cloudy |
Moderate |
Mid-Flood |
M |
7.95 |
10:03 |
8.62 |
8.31 |
33.4 |
20.79 |
2.87 |
3 |
|
WSR16 |
20220122 |
Cloudy |
Moderate |
Mid-Flood |
M |
7.95 |
10:03 |
8.64 |
8.25 |
33.35 |
20.78 |
2.64 |
4 |
|
WSR16 |
20220122 |
Cloudy |
Moderate |
Mid-Flood |
B |
14.9 |
10:02 |
8.68 |
8.3 |
33.35 |
20.78 |
2.39 |
4 |
|
WSR16 |
20220122 |
Cloudy |
Moderate |
Mid-Flood |
B |
14.9 |
10:02 |
8.72 |
8.29 |
33.34 |
20.81 |
2.31 |
6 |
|
WSR16 |
20220125 |
Cloudy |
Moderate |
Mid-Flood |
S |
1 |
12:02 |
8.81 |
8.12 |
30.56 |
21.04 |
3.36 |
3 |
|
WSR16 |
20220125 |
Cloudy |
Moderate |
Mid-Flood |
S |
1 |
12:02 |
8.79 |
8.14 |
30.58 |
21.06 |
3.45 |
3 |
|
WSR16 |
20220125 |
Cloudy |
Moderate |
Mid-Flood |
M |
8.5 |
12:01 |
8.91 |
8.09 |
30.47 |
21 |
3.07 |
3 |
|
WSR16 |
20220125 |
Cloudy |
Moderate |
Mid-Flood |
M |
8.5 |
12:01 |
8.84 |
8.06 |
30.56 |
21.11 |
3.29 |
3 |
|
WSR16 |
20220125 |
Cloudy |
Moderate |
Mid-Flood |
B |
16 |
12:00 |
8.88 |
8.11 |
30.6 |
21.09 |
3.45 |
2.5 |
|
WSR16 |
20220125 |
Cloudy |
Moderate |
Mid-Flood |
B |
16 |
12:00 |
8.9 |
8.18 |
30.57 |
21.15 |
3.03 |
3 |
|
WSR16 |
20220127 |
Cloudy |
Moderate |
Mid-Flood |
S |
1 |
13:40 |
8.62 |
8.09 |
31.82 |
21.31 |
2.92 |
3 |
|
WSR16 |
20220127 |
Cloudy |
Moderate |
Mid-Flood |
S |
1 |
13:40 |
8.58 |
8.07 |
31.78 |
21.25 |
2.93 |
3 |
|
Location |
Date |
Weather |
Sea Conidtion |
Tidal |
Water Level |
Depth (m) |
Time |
DO (mg/L) |
H |
Sal (ppt) |
Temp (�XC) |
Turbidty (NTU) |
SS (mg/L) |
|
WSR16 |
20220127 |
Cloudy |
Moderate |
Mid-Flood |
M |
7.7 |
13:39 |
8.53 |
8.12 |
31.75 |
21.22 |
2.29 |
5 |
|
WSR16 |
20220127 |
Cloudy |
Moderate |
Mid-Flood |
M |
7.7 |
13:39 |
8.66 |
8.14 |
31.74 |
21.21 |
2.35 |
7 |
|
WSR16 |
20220127 |
Cloudy |
Moderate |
Mid-Flood |
B |
14.4 |
13:38 |
8.62 |
8.06 |
31.74 |
21.3 |
2.28 |
4 |
|
WSR16 |
20220127 |
Cloudy |
Moderate |
Mid-Flood |
B |
14.4 |
13:38 |
8.57 |
8.12 |
31.82 |
21.18 |
2.31 |
5 |
|
WSR16 |
20220129 |
Cloudy |
Moderate |
Mid-Flood |
S |
1 |
15:26 |
9.37 |
8.27 |
31.17 |
20.42 |
2.81 |
4 |
|
WSR16 |
20220129 |
Cloudy |
Moderate |
Mid-Flood |
S |
1 |
15:26 |
9.43 |
8.28 |
31.16 |
20.5 |
2.79 |
3 |
|
WSR16 |
20220129 |
Cloudy |
Moderate |
Mid-Flood |
M |
8 |
15:25 |
9.36 |
8.24 |
31.19 |
20.45 |
2.89 |
4 |
|
WSR16 |
20220129 |
Cloudy |
Moderate |
Mid-Flood |
M |
8 |
15:25 |
9.29 |
8.24 |
31.18 |
20.55 |
2.9 |
5 |
|
WSR16 |
20220129 |
Cloudy |
Moderate |
Mid-Flood |
B |
15 |
15:24 |
9.41 |
8.24 |
31.19 |
20.44 |
1.9 |
3 |
|
WSR16 |
20220129 |
Cloudy |
Moderate |
Mid-Flood |
B |
15 |
15:24 |
9.29 |
8.21 |
31.37 |
20.47 |
2.11 |
4 |
|
WSR16 |
20220131 |
Cloudy |
Moderate |
Mid-Flood |
S |
1 |
17:20 |
8.04 |
8.09 |
33.15 |
19.89 |
2.67 |
11 |
|
WSR16 |
20220131 |
Cloudy |
Moderate |
Mid-Flood |
S |
1 |
17:20 |
8.1 |
8.06 |
33.28 |
19.88 |
2.84 |
11 |
|
WSR16 |
20220131 |
Cloudy |
Moderate |
Mid-Flood |
M |
7.6 |
17:19 |
8.09 |
8.11 |
33.31 |
19.86 |
2.43 |
4 |
|
WSR16 |
20220131 |
Cloudy |
Moderate |
Mid-Flood |
M |
7.6 |
17:19 |
8.07 |
8.13 |
33.3 |
19.85 |
2.63 |
5 |
|
WSR16 |
20220131 |
Cloudy |
Moderate |
Mid-Flood |
B |
14.2 |
17:18 |
8.05 |
8.1 |
33.28 |
19.92 |
2.41 |
3 |
|
WSR16 |
20220131 |
Cloudy |
Moderate |
Mid-Flood |
B |
14.2 |
17:18 |
8 |
8.1 |
33.12 |
19.85 |
2.43 |
2.5 |
|
WSR33 |
20220101 |
Cloudy |
Moderate |
Mid-Flood |
S |
1 |
15:53 |
8.72 |
8.18 |
31.1 |
22.2 |
2.29 |
4 |
|
WSR33 |
20220101 |
Cloudy |
Moderate |
Mid-Flood |
S |
1 |
15:53 |
8.7 |
8.21 |
30.98 |
22.12 |
1.95 |
4 |
|
WSR33 |
20220101 |
Cloudy |
Moderate |
Mid-Flood |
M |
3.8 |
15:52 |
8.66 |
8.26 |
31.06 |
22.25 |
2.3 |
3 |
|
WSR33 |
20220101 |
Cloudy |
Moderate |
Mid-Flood |
M |
3.8 |
15:52 |
8.87 |
8.23 |
31.04 |
22.12 |
2.6 |
4 |
|
WSR33 |
20220101 |
Cloudy |
Moderate |
Mid-Flood |
B |
6.6 |
15:51 |
8.79 |
8.17 |
31.1 |
22.15 |
2.3 |
5 |
|
WSR33 |
20220101 |
Cloudy |
Moderate |
Mid-Flood |
B |
6.6 |
15:51 |
8.78 |
8.21 |
31.03 |
22.07 |
1.99 |
4 |
|
WSR33 |
20220104 |
Sunny |
Moderate |
Mid-Flood |
S |
1 |
9:18 |
9 |
8.39 |
31.88 |
22.57 |
2.46 |
5 |
|
WSR33 |
20220104 |
Sunny |
Moderate |
Mid-Flood |
S |
1 |
9:18 |
8.96 |
8.4 |
31.78 |
22.47 |
2.09 |
4 |
|
WSR33 |
20220104 |
Sunny |
Moderate |
Mid-Flood |
M |
3.7 |
9:17 |
8.86 |
8.44 |
31.84 |
22.51 |
1.96 |
7 |
|
WSR33 |
20220104 |
Sunny |
Moderate |
Mid-Flood |
M |
3.7 |
9:17 |
8.83 |
8.4 |
31.82 |
22.38 |
2.26 |
6 |
|
Location |
Date |
Weather |
Sea Conidtion |
Tidal |
Water Level |
Depth (m) |
Time |
DO (mg/L) |
H |
Sal (ppt) |
Temp (�XC) |
Turbidty (NTU) |
SS (mg/L) |
|
WSR33 |
20220104 |
Sunny |
Moderate |
Mid-Flood |
B |
6.4 |
9:16 |
8.81 |
8.44 |
31.91 |
22.48 |
2.08 |
8 |
|
WSR33 |
20220104 |
Sunny |
Moderate |
Mid-Flood |
B |
6.4 |
9:16 |
8.72 |
8.37 |
31.91 |
22.55 |
2.36 |
8 |
|
WSR33 |
20220106 |
Sunny |
Moderate |
Mid-Flood |
S |
1 |
9:32 |
8.52 |
8.29 |
32.02 |
22.5 |
3.53 |
3 |
|
WSR33 |
20220106 |
Sunny |
Moderate |
Mid-Flood |
S |
1 |
9:32 |
8.36 |
8.31 |
32.22 |
22.46 |
3.88 |
3 |
|
WSR33 |
20220106 |
Sunny |
Moderate |
Mid-Flood |
M |
3.65 |
9:31 |
8.53 |
8.25 |
32.13 |
22.37 |
3.88 |
2.5 |
|
WSR33 |
20220106 |
Sunny |
Moderate |
Mid-Flood |
M |
3.65 |
9:31 |
8.44 |
8.24 |
32.13 |
22.32 |
3.73 |
3 |
|
WSR33 |
20220106 |
Sunny |
Moderate |
Mid-Flood |
B |
6.3 |
9:30 |
8.4 |
8.27 |
32.07 |
22.46 |
3.78 |
3 |
|
WSR33 |
20220106 |
Sunny |
Moderate |
Mid-Flood |
B |
6.3 |
9:30 |
8.51 |
8.31 |
32.23 |
22.26 |
3.79 |
3 |
|
WSR33 |
20220108 |
Sunny |
Moderate |
Mid-Flood |
S |
1 |
10:52 |
8.23 |
8.47 |
34.24 |
21.81 |
3.25 |
5 |
|
WSR33 |
20220108 |
Sunny |
Moderate |
Mid-Flood |
S |
1 |
10:52 |
8.24 |
8.47 |
34.23 |
21.75 |
2.73 |
6 |
|
WSR33 |
20220108 |
Sunny |
Moderate |
Mid-Flood |
M |
3.6 |
10:51 |
8.27 |
8.44 |
34.17 |
21.8 |
2.44 |
6 |
|
WSR33 |
20220108 |
Sunny |
Moderate |
Mid-Flood |
M |
3.6 |
10:51 |
8.3 |
8.43 |
34.26 |
21.82 |
2.84 |
5 |
|
WSR33 |
20220108 |
Sunny |
Moderate |
Mid-Flood |
B |
6.2 |
10:50 |
8.26 |
8.46 |
34.17 |
21.81 |
2.4 |
5 |
|
WSR33 |
20220108 |
Sunny |
Moderate |
Mid-Flood |
B |
6.2 |
10:50 |
8.28 |
8.47 |
34.25 |
21.78 |
2.22 |
5 |
|
WSR33 |
20220111 |
Sunny |
Moderate |
Mid-Flood |
S |
1 |
18:52 |
8.74 |
8.39 |
34.19 |
20.14 |
2.95 |
5 |
|
WSR33 |
20220111 |
Sunny |
Moderate |
Mid-Flood |
S |
1 |
18:52 |
8.91 |
8.31 |
34.25 |
20.22 |
2.92 |
8 |
|
WSR33 |
20220111 |
Sunny |
Moderate |
Mid-Flood |
M |
3.75 |
18:51 |
8.89 |
8.38 |
34.32 |
20.24 |
2.17 |
4 |
|
WSR33 |
20220111 |
Sunny |
Moderate |
Mid-Flood |
M |
3.75 |
18:51 |
8.89 |
8.34 |
34.32 |
20.23 |
2.33 |
5 |
|
WSR33 |
20220111 |
Sunny |
Moderate |
Mid-Flood |
B |
6.5 |
18:50 |
8.78 |
8.39 |
34.33 |
20.21 |
2.42 |
5 |
|
WSR33 |
20220111 |
Sunny |
Moderate |
Mid-Flood |
B |
6.5 |
18:50 |
8.97 |
8.33 |
34.1 |
20.24 |
2.44 |
5 |
|
WSR33 |
20220113 |
Cloudy |
Moderate |
Mid-Flood |
S |
1 |
14:22 |
8.38 |
8.29 |
32.22 |
20.54 |
4.25 |
2.5 |
|
WSR33 |
20220113 |
Cloudy |
Moderate |
Mid-Flood |
S |
1 |
14:22 |
8.41 |
8.29 |
32.24 |
20.55 |
4.11 |
2.5 |
|
WSR33 |
20220113 |
Cloudy |
Moderate |
Mid-Flood |
M |
3.65 |
14:21 |
8.24 |
8.38 |
32.31 |
20.56 |
3.44 |
2.5 |
|
WSR33 |
20220113 |
Cloudy |
Moderate |
Mid-Flood |
M |
3.65 |
14:21 |
8.32 |
8.36 |
32.32 |
20.57 |
4.1 |
3 |
|
WSR33 |
20220113 |
Cloudy |
Moderate |
Mid-Flood |
B |
6.3 |
14:20 |
8.41 |
8.3 |
32.21 |
20.55 |
3.35 |
3 |
|
WSR33 |
20220113 |
Cloudy |
Moderate |
Mid-Flood |
B |
6.3 |
14:20 |
8.34 |
8.3 |
32.32 |
20.46 |
3.83 |
3 |
|
Location |
Date |
Weather |
Sea Conidtion |
Tidal |
Water Level |
Depth (m) |
Time |
DO (mg/L) |
H |
Sal (ppt) |
Temp (�XC) |
Turbidty (NTU) |
SS (mg/L) |
|
WSR33 |
20220115 |
Cloudy |
Moderate |
Mid-Flood |
S |
1 |
15:35 |
8.35 |
8.32 |
33.79 |
20.85 |
3.56 |
2.5 |
|
WSR33 |
20220115 |
Cloudy |
Moderate |
Mid-Flood |
S |
1 |
15:35 |
8.24 |
8.29 |
33.73 |
20.96 |
3.62 |
3 |
|
WSR33 |
20220115 |
Cloudy |
Moderate |
Mid-Flood |
M |
3.65 |
15:34 |
8.33 |
8.32 |
33.85 |
20.88 |
3.29 |
4 |
|
WSR33 |
20220115 |
Cloudy |
Moderate |
Mid-Flood |
M |
3.65 |
15:34 |
8.29 |
8.28 |
33.85 |
20.99 |
3.29 |
3 |
|
WSR33 |
20220115 |
Cloudy |
Moderate |
Mid-Flood |
B |
6.3 |
15:33 |
8.27 |
8.28 |
33.89 |
20.94 |
2.88 |
3 |
|
WSR33 |
20220115 |
Cloudy |
Moderate |
Mid-Flood |
B |
6.3 |
15:33 |
8.31 |
8.26 |
33.89 |
20.95 |
3.11 |
3 |
|
WSR33 |
20220118 |
Cloudy |
Moderate |
Mid-Flood |
S |
1 |
16:50 |
8.84 |
8.11 |
33.4 |
20.7 |
2.64 |
7 |
|
WSR33 |
20220118 |
Cloudy |
Moderate |
Mid-Flood |
S |
1 |
16:50 |
8.89 |
8.11 |
33.39 |
20.75 |
2.89 |
7 |
|
WSR33 |
20220118 |
Cloudy |
Moderate |
Mid-Flood |
M |
3.7 |
16:49 |
8.91 |
8.09 |
33.35 |
20.77 |
2.87 |
2.5 |
|
WSR33 |
20220118 |
Cloudy |
Moderate |
Mid-Flood |
M |
3.7 |
16:49 |
8.84 |
8.08 |
33.4 |
20.6 |
2.86 |
3 |
|
WSR33 |
20220118 |
Cloudy |
Moderate |
Mid-Flood |
B |
6.4 |
16:48 |
9 |
8.06 |
33.47 |
20.71 |
2.01 |
6 |
|
WSR33 |
20220118 |
Cloudy |
Moderate |
Mid-Flood |
B |
6.4 |
16:48 |
8.94 |
8.02 |
33.38 |
20.73 |
1.9 |
6 |
|
WSR33 |
20220120 |
Sunny |
Moderate |
Mid-Flood |
S |
1 |
9:13 |
8.04 |
8.34 |
33.73 |
20.91 |
3.79 |
5 |
|
WSR33 |
20220120 |
Sunny |
Moderate |
Mid-Flood |
S |
1 |
9:13 |
8.01 |
8.25 |
33.67 |
20.88 |
3.52 |
5 |
|
WSR33 |
20220120 |
Sunny |
Moderate |
Mid-Flood |
M |
3.75 |
9:12 |
8.2 |
8.34 |
33.66 |
20.91 |
3.66 |
4 |
|
WSR33 |
20220120 |
Sunny |
Moderate |
Mid-Flood |
M |
3.75 |
9:12 |
8.19 |
8.32 |
33.73 |
20.84 |
3.14 |
5 |
|
WSR33 |
20220120 |
Sunny |
Moderate |
Mid-Flood |
B |
6.5 |
9:11 |
8.02 |
8.24 |
33.75 |
20.89 |
3.13 |
5 |
|
WSR33 |
20220120 |
Sunny |
Moderate |
Mid-Flood |
B |
6.5 |
9:11 |
8.05 |
8.34 |
33.78 |
20.95 |
3.16 |
5 |
|
WSR33 |
20220122 |
Cloudy |
Moderate |
Mid-Flood |
S |
1 |
9:17 |
8.4 |
8.13 |
33.69 |
21.26 |
3.3 |
6 |
|
WSR33 |
20220122 |
Cloudy |
Moderate |
Mid-Flood |
S |
1 |
9:17 |
8.43 |
8.12 |
33.53 |
21.2 |
3.17 |
5 |
|
WSR33 |
20220122 |
Cloudy |
Moderate |
Mid-Flood |
M |
3.5 |
9:16 |
8.4 |
8.12 |
33.55 |
21.26 |
3.01 |
5 |
|
WSR33 |
20220122 |
Cloudy |
Moderate |
Mid-Flood |
M |
3.5 |
9:16 |
8.36 |
8.17 |
33.54 |
21.18 |
3.35 |
5 |
|
WSR33 |
20220122 |
Cloudy |
Moderate |
Mid-Flood |
B |
6 |
9:15 |
8.38 |
8.18 |
33.62 |
21.24 |
3 |
5 |
|
WSR33 |
20220122 |
Cloudy |
Moderate |
Mid-Flood |
B |
6 |
9:15 |
8.4 |
8.18 |
33.61 |
21.24 |
3.09 |
6 |
|
WSR33 |
20220125 |
Cloudy |
Moderate |
Mid-Flood |
S |
1 |
11:14 |
8.43 |
8.18 |
31.04 |
20.94 |
3.45 |
3 |
|
WSR33 |
20220125 |
Cloudy |
Moderate |
Mid-Flood |
S |
1 |
11:14 |
8.54 |
8.3 |
31.1 |
20.95 |
3.62 |
3 |
|
Location |
Date |
Weather |
Sea Conidtion |
Tidal |
Water Level |
Depth (m) |
Time |
DO (mg/L) |
H |
Sal (ppt) |
Temp (�XC) |
Turbidty (NTU) |
SS (mg/L) |
|
WSR33 |
20220125 |
Cloudy |
Moderate |
Mid-Flood |
M |
3.55 |
11:13 |
8.54 |
8.19 |
31.02 |
20.88 |
2.97 |
2.5 |
|
WSR33 |
20220125 |
Cloudy |
Moderate |
Mid-Flood |
M |
3.55 |
11:13 |
8.53 |
8.21 |
31.01 |
20.92 |
3.02 |
2.5 |
|
WSR33 |
20220125 |
Cloudy |
Moderate |
Mid-Flood |
B |
6.1 |
11:12 |
8.48 |
8.2 |
30.96 |
20.96 |
2.86 |
2.5 |
|
WSR33 |
20220125 |
Cloudy |
Moderate |
Mid-Flood |
B |
6.1 |
11:12 |
8.35 |
8.19 |
30.92 |
20.86 |
3 |
3 |
|
WSR33 |
20220127 |
Cloudy |
Moderate |
Mid-Flood |
S |
1 |
12:50 |
8.54 |
8.17 |
31.65 |
20.74 |
2.61 |
5 |
|
WSR33 |
20220127 |
Cloudy |
Moderate |
Mid-Flood |
S |
1 |
12:50 |
8.43 |
8.16 |
31.75 |
20.63 |
3.05 |
4 |
|
WSR33 |
20220127 |
Cloudy |
Moderate |
Mid-Flood |
M |
3.8 |
12:49 |
8.52 |
8.23 |
31.68 |
20.71 |
2.62 |
3 |
|
WSR33 |
20220127 |
Cloudy |
Moderate |
Mid-Flood |
M |
3.8 |
12:49 |
8.53 |
8.11 |
31.65 |
20.65 |
2.37 |
5 |
|
WSR33 |
20220127 |
Cloudy |
Moderate |
Mid-Flood |
B |
6.6 |
12:48 |
8.48 |
8.11 |
31.76 |
20.75 |
1.77 |
3 |
|
WSR33 |
20220127 |
Cloudy |
Moderate |
Mid-Flood |
B |
6.6 |
12:48 |
8.53 |
8.24 |
31.83 |
20.76 |
1.93 |
4 |
|
WSR33 |
20220129 |
Cloudy |
Moderate |
Mid-Flood |
S |
1 |
14:37 |
8.93 |
8.15 |
30.59 |
20.72 |
3.08 |
4 |
|
WSR33 |
20220129 |
Cloudy |
Moderate |
Mid-Flood |
S |
1 |
14:37 |
8.79 |
8.14 |
30.59 |
20.69 |
3.55 |
5 |
|
WSR33 |
20220129 |
Cloudy |
Moderate |
Mid-Flood |
M |
3.75 |
14:36 |
8.89 |
8.25 |
30.55 |
20.68 |
2.8 |
5 |
|
WSR33 |
20220129 |
Cloudy |
Moderate |
Mid-Flood |
M |
3.75 |
14:36 |
8.79 |
8.17 |
30.61 |
20.62 |
3.24 |
6 |
|
WSR33 |
20220129 |
Cloudy |
Moderate |
Mid-Flood |
B |
6.5 |
14:35 |
8.79 |
8.24 |
30.6 |
20.65 |
2.31 |
5 |
|
WSR33 |
20220129 |
Cloudy |
Moderate |
Mid-Flood |
B |
6.5 |
14:35 |
8.81 |
8.14 |
30.55 |
20.71 |
2.35 |
6 |
|
WSR33 |
20220131 |
Cloudy |
Moderate |
Mid-Flood |
S |
1 |
16:30 |
9.03 |
8.09 |
34.15 |
19.94 |
2.72 |
2.5 |
|
WSR33 |
20220131 |
Cloudy |
Moderate |
Mid-Flood |
S |
1 |
16:30 |
9 |
8.1 |
34.13 |
19.94 |
3.14 |
3 |
|
WSR33 |
20220131 |
Cloudy |
Moderate |
Mid-Flood |
M |
3.5 |
16:29 |
9.01 |
8.15 |
34.33 |
19.99 |
2.71 |
2.5 |
|
WSR33 |
20220131 |
Cloudy |
Moderate |
Mid-Flood |
M |
3.5 |
16:29 |
8.93 |
8.09 |
34.15 |
19.97 |
2.32 |
3 |
|
WSR33 |
20220131 |
Cloudy |
Moderate |
Mid-Flood |
B |
6 |
16:28 |
9.07 |
8.16 |
34.12 |
19.95 |
2.06 |
2.5 |
|
WSR33 |
20220131 |
Cloudy |
Moderate |
Mid-Flood |
B |
6 |
16:28 |
8.91 |
8.1 |
34.19 |
19.92 |
1.97 |
5 |
|
WSR36 |
20220101 |
Cloudy |
Moderate |
Mid-Flood |
S |
1 |
16:07 |
9.07 |
8.49 |
30.9 |
22.18 |
1.46 |
3 |
|
WSR36 |
20220101 |
Cloudy |
Moderate |
Mid-Flood |
S |
1 |
16:07 |
9.11 |
8.38 |
31.07 |
22.12 |
1.33 |
5 |
|
WSR36 |
20220101 |
Cloudy |
Moderate |
Mid-Flood |
M |
3.8 |
16:07 |
8.94 |
8.45 |
30.92 |
22.13 |
1.86 |
5 |
|
WSR36 |
20220101 |
Cloudy |
Moderate |
Mid-Flood |
M |
3.8 |
16:07 |
8.99 |
8.44 |
30.91 |
22.04 |
1.94 |
4 |
|
Location |
Date |
Weather |
Sea Conidtion |
Tidal |
Water Level |
Depth (m) |
Time |
DO (mg/L) |
H |
Sal (ppt) |
Temp (�XC) |
Turbidty (NTU) |
SS (mg/L) |
|
WSR36 |
20220101 |
Cloudy |
Moderate |
Mid-Flood |
B |
6.6 |
16:06 |
8.95 |
8.48 |
31 |
22.13 |
1.91 |
4 |
|
WSR36 |
20220101 |
Cloudy |
Moderate |
Mid-Flood |
B |
6.6 |
16:06 |
9.16 |
8.39 |
31.02 |
22.15 |
2.14 |
7 |
|
WSR36 |
20220104 |
Sunny |
Moderate |
Mid-Flood |
S |
1 |
9:31 |
8.89 |
8.26 |
31.78 |
22.27 |
2.15 |
6 |
|
WSR36 |
20220104 |
Sunny |
Moderate |
Mid-Flood |
S |
1 |
9:31 |
9.01 |
8.29 |
31.77 |
22.28 |
2.24 |
4 |
|
WSR36 |
20220104 |
Sunny |
Moderate |
Mid-Flood |
M |
3.75 |
9:31 |
9.05 |
8.28 |
31.7 |
22.1 |
2.1 |
8 |
|
WSR36 |
20220104 |
Sunny |
Moderate |
Mid-Flood |
M |
3.75 |
9:31 |
8.92 |
8.32 |
31.74 |
22.18 |
2.3 |
4 |
|
WSR36 |
20220104 |
Sunny |
Moderate |
Mid-Flood |
B |
6.5 |
9:30 |
8.98 |
8.33 |
31.77 |
22.13 |
1.82 |
6 |
|
WSR36 |
20220104 |
Sunny |
Moderate |
Mid-Flood |
B |
6.5 |
9:30 |
8.83 |
8.25 |
31.8 |
22.18 |
1.97 |
6 |
|
WSR36 |
20220106 |
Sunny |
Moderate |
Mid-Flood |
S |
1 |
10:47 |
8.28 |
8.4 |
32.07 |
22.49 |
3.28 |
3 |
|
WSR36 |
20220106 |
Sunny |
Moderate |
Mid-Flood |
S |
1 |
10:47 |
8.27 |
8.43 |
32.05 |
22.62 |
2.99 |
4 |
|
WSR36 |
20220106 |
Sunny |
Moderate |
Mid-Flood |
M |
3.6 |
10:47 |
8.23 |
8.44 |
32.04 |
22.59 |
2.56 |
3 |
|
WSR36 |
20220106 |
Sunny |
Moderate |
Mid-Flood |
M |
3.6 |
10:47 |
8.19 |
8.42 |
31.93 |
22.43 |
2.6 |
3 |
|
WSR36 |
20220106 |
Sunny |
Moderate |
Mid-Flood |
B |
6.2 |
10:46 |
8.22 |
8.42 |
31.91 |
22.58 |
3.04 |
8 |
|
WSR36 |
20220106 |
Sunny |
Moderate |
Mid-Flood |
B |
6.2 |
10:46 |
8.33 |
8.37 |
31.96 |
22.64 |
3.01 |
8 |
|
WSR36 |
20220108 |
Sunny |
Moderate |
Mid-Flood |
S |
1 |
11:04 |
8.51 |
8.22 |
33.86 |
21.53 |
2.97 |
3 |
|
WSR36 |
20220108 |
Sunny |
Moderate |
Mid-Flood |
S |
1 |
11:04 |
8.51 |
8.26 |
33.91 |
21.54 |
2.68 |
7 |
|
WSR36 |
20220108 |
Sunny |
Moderate |
Mid-Flood |
M |
3.35 |
11:04 |
8.5 |
8.22 |
33.85 |
21.58 |
2.35 |
10 |
|
WSR36 |
20220108 |
Sunny |
Moderate |
Mid-Flood |
M |
3.35 |
11:04 |
8.42 |
8.21 |
33.84 |
21.63 |
2.61 |
10 |
|
WSR36 |
20220108 |
Sunny |
Moderate |
Mid-Flood |
B |
5.7 |
11:03 |
8.48 |
8.19 |
33.84 |
21.66 |
3.14 |
6 |
|
WSR36 |
20220108 |
Sunny |
Moderate |
Mid-Flood |
B |
5.7 |
11:03 |
8.44 |
8.2 |
33.93 |
21.53 |
3.22 |
6 |
|
WSR36 |
20220111 |
Sunny |
Moderate |
Mid-Flood |
S |
1 |
19:02 |
9.46 |
8.35 |
35.14 |
20.05 |
3.03 |
8 |
|
WSR36 |
20220111 |
Sunny |
Moderate |
Mid-Flood |
S |
1 |
19:02 |
9.13 |
8.27 |
34.94 |
20.06 |
2.6 |
7 |
|
WSR36 |
20220111 |
Sunny |
Moderate |
Mid-Flood |
M |
3.7 |
19:02 |
9.42 |
8.27 |
35.15 |
19.98 |
2.46 |
7 |
|
WSR36 |
20220111 |
Sunny |
Moderate |
Mid-Flood |
M |
3.7 |
19:02 |
9.24 |
8.29 |
35.07 |
19.94 |
2.46 |
7 |
|
WSR36 |
20220111 |
Sunny |
Moderate |
Mid-Flood |
B |
6.4 |
19:01 |
9.21 |
8.35 |
35.1 |
19.93 |
2.06 |
7 |
|
WSR36 |
20220111 |
Sunny |
Moderate |
Mid-Flood |
B |
6.4 |
19:01 |
9.42 |
8.35 |
35.09 |
19.99 |
1.9 |
7 |
|
Location |
Date |
Weather |
Sea Conidtion |
Tidal |
Water Level |
Depth (m) |
Time |
DO (mg/L) |
H |
Sal (ppt) |
Temp (�XC) |
Turbidty (NTU) |
SS (mg/L) |
|
WSR36 |
20220113 |
Cloudy |
Moderate |
Mid-Flood |
S |
1 |
14:35 |
8.96 |
8.36 |
32.45 |
20.6 |
3.4 |
3 |
|
WSR36 |
20220113 |
Cloudy |
Moderate |
Mid-Flood |
S |
1 |
14:35 |
8.98 |
8.34 |
32.42 |
20.69 |
3.39 |
2.5 |
|
WSR36 |
20220113 |
Cloudy |
Moderate |
Mid-Flood |
M |
3.7 |
14:36 |
9.02 |
8.35 |
32.35 |
20.64 |
3.24 |
8 |
|
WSR36 |
20220113 |
Cloudy |
Moderate |
Mid-Flood |
M |
3.7 |
14:36 |
8.96 |
8.33 |
32.39 |
20.75 |
3.34 |
8 |
|
WSR36 |
20220113 |
Cloudy |
Moderate |
Mid-Flood |
B |
6.4 |
14:34 |
9.02 |
8.33 |
32.44 |
20.76 |
3.28 |
2.5 |
|
WSR36 |
20220113 |
Cloudy |
Moderate |
Mid-Flood |
B |
6.4 |
14:34 |
8.98 |
8.29 |
32.46 |
20.72 |
2.77 |
2.5 |
|
WSR36 |
20220115 |
Cloudy |
Moderate |
Mid-Flood |
S |
1 |
15:50 |
8.35 |
8.19 |
33.86 |
20.75 |
2.8 |
2.5 |
|
WSR36 |
20220115 |
Cloudy |
Moderate |
Mid-Flood |
S |
1 |
15:50 |
8.35 |
8.26 |
33.92 |
20.86 |
3.25 |
3 |
|
WSR36 |
20220115 |
Cloudy |
Moderate |
Mid-Flood |
M |
3.35 |
15:50 |
8.36 |
8.19 |
33.86 |
20.72 |
3.13 |
3 |
|
WSR36 |
20220115 |
Cloudy |
Moderate |
Mid-Flood |
M |
3.35 |
15:50 |
8.38 |
8.18 |
33.92 |
20.72 |
2.72 |
3 |
|
WSR36 |
20220115 |
Cloudy |
Moderate |
Mid-Flood |
B |
5.7 |
15:49 |
8.4 |
8.19 |
33.84 |
20.82 |
2.77 |
3 |
|
WSR36 |
20220115 |
Cloudy |
Moderate |
Mid-Flood |
B |
5.7 |
15:49 |
8.36 |
8.19 |
33.99 |
20.76 |
2.4 |
4 |
|
WSR36 |
20220118 |
Cloudy |
Moderate |
Mid-Flood |
S |
1 |
17:01 |
8.89 |
8.22 |
33.25 |
20.75 |
3.4 |
3 |
|
WSR36 |
20220118 |
Cloudy |
Moderate |
Mid-Flood |
S |
1 |
17:01 |
8.84 |
8.2 |
33.38 |
20.82 |
3.3 |
4 |
|
WSR36 |
20220118 |
Cloudy |
Moderate |
Mid-Flood |
M |
3.85 |
17:01 |
8.8 |
8.17 |
33.3 |
20.9 |
2.72 |
5 |
|
WSR36 |
20220118 |
Cloudy |
Moderate |
Mid-Flood |
M |
3.85 |
17:01 |
8.89 |
8.15 |
33.34 |
20.89 |
2.79 |
5 |
|
WSR36 |
20220118 |
Cloudy |
Moderate |
Mid-Flood |
B |
6.7 |
17:00 |
8.94 |
8.12 |
33.3 |
20.79 |
2.57 |
8 |
|
WSR36 |
20220118 |
Cloudy |
Moderate |
Mid-Flood |
B |
6.7 |
17:00 |
8.86 |
8.12 |
33.38 |
20.85 |
2.71 |
8 |
|
WSR36 |
20220120 |
Sunny |
Moderate |
Mid-Flood |
S |
1 |
9:26 |
8.65 |
8.25 |
33.7 |
20.74 |
3.65 |
13 |
|
WSR36 |
20220120 |
Sunny |
Moderate |
Mid-Flood |
S |
1 |
9:26 |
8.7 |
8.34 |
33.85 |
20.86 |
3.78 |
9 |
|
WSR36 |
20220120 |
Sunny |
Moderate |
Mid-Flood |
M |
3.15 |
9:26 |
8.61 |
8.31 |
33.78 |
20.82 |
4.04 |
5 |
|
WSR36 |
20220120 |
Sunny |
Moderate |
Mid-Flood |
M |
3.15 |
9:26 |
8.55 |
8.27 |
33.88 |
20.81 |
4.03 |
5 |
|
WSR36 |
20220120 |
Sunny |
Moderate |
Mid-Flood |
B |
5.3 |
9:25 |
8.58 |
8.27 |
33.84 |
20.77 |
3.1 |
5 |
|
WSR36 |
20220120 |
Sunny |
Moderate |
Mid-Flood |
B |
5.3 |
9:25 |
8.66 |
8.27 |
33.92 |
20.78 |
3.58 |
5 |
|
WSR36 |
20220122 |
Cloudy |
Moderate |
Mid-Flood |
S |
1 |
9:29 |
9.36 |
8.35 |
33.89 |
21.54 |
2.39 |
3 |
|
WSR36 |
20220122 |
Cloudy |
Moderate |
Mid-Flood |
S |
1 |
9:29 |
9.36 |
8.35 |
34.09 |
21.4 |
2.62 |
4 |
|
Location |
Date |
Weather |
Sea Conidtion |
Tidal |
Water Level |
Depth (m) |
Time |
DO (mg/L) |
H |
Sal (ppt) |
Temp (�XC) |
Turbidty (NTU) |
SS (mg/L) |
|
WSR36 |
20220122 |
Cloudy |
Moderate |
Mid-Flood |
M |
3.45 |
9:29 |
9.34 |
8.3 |
34.08 |
21.43 |
2.3 |
6 |
|
WSR36 |
20220122 |
Cloudy |
Moderate |
Mid-Flood |
M |
3.45 |
9:29 |
9.35 |
8.3 |
34.08 |
21.45 |
2.51 |
5 |
|
WSR36 |
20220122 |
Cloudy |
Moderate |
Mid-Flood |
B |
5.9 |
9:28 |
9.35 |
8.32 |
34.09 |
21.46 |
2.25 |
4 |
|
WSR36 |
20220122 |
Cloudy |
Moderate |
Mid-Flood |
B |
5.9 |
9:28 |
9.37 |
8.33 |
34.11 |
21.46 |
1.9 |
3 |
|
WSR36 |
20220125 |
Cloudy |
Moderate |
Mid-Flood |
S |
1 |
11:26 |
8.71 |
8.28 |
30.91 |
20.82 |
3.08 |
2.5 |
|
WSR36 |
20220125 |
Cloudy |
Moderate |
Mid-Flood |
S |
1 |
11:26 |
8.51 |
8.28 |
30.87 |
20.9 |
3.21 |
2.5 |
|
WSR36 |
20220125 |
Cloudy |
Moderate |
Mid-Flood |
M |
3.65 |
11:26 |
8.53 |
8.19 |
31.02 |
20.91 |
3.3 |
3 |
|
WSR36 |
20220125 |
Cloudy |
Moderate |
Mid-Flood |
M |
3.65 |
11:26 |
8.68 |
8.2 |
30.98 |
20.9 |
2.84 |
2.5 |
|
WSR36 |
20220125 |
Cloudy |
Moderate |
Mid-Flood |
B |
6.3 |
11:25 |
8.62 |
8.16 |
31.05 |
20.94 |
2.59 |
3 |
|
WSR36 |
20220125 |
Cloudy |
Moderate |
Mid-Flood |
B |
6.3 |
11:25 |
8.57 |
8.28 |
31.05 |
20.91 |
2.48 |
3 |
|
WSR36 |
20220127 |
Cloudy |
Moderate |
Mid-Flood |
S |
1 |
13:03 |
8.4 |
8.17 |
31.35 |
20.99 |
3.17 |
3 |
|
WSR36 |
20220127 |
Cloudy |
Moderate |
Mid-Flood |
S |
1 |
13:03 |
8.38 |
8.15 |
31.23 |
20.91 |
3.04 |
5 |
|
WSR36 |
20220127 |
Cloudy |
Moderate |
Mid-Flood |
M |
3.55 |
13:03 |
8.32 |
8.09 |
31.34 |
20.89 |
3.19 |
6 |
|
WSR36 |
20220127 |
Cloudy |
Moderate |
Mid-Flood |
M |
3.55 |
13:03 |
8.4 |
8.08 |
31.24 |
20.99 |
3.04 |
6 |
|
WSR36 |
20220127 |
Cloudy |
Moderate |
Mid-Flood |
B |
6.1 |
13:02 |
8.35 |
8.19 |
31.23 |
20.95 |
2.95 |
3 |
|
WSR36 |
20220127 |
Cloudy |
Moderate |
Mid-Flood |
B |
6.1 |
13:02 |
8.27 |
8.22 |
31.31 |
20.93 |
2.47 |
3 |
|
WSR36 |
20220129 |
Cloudy |
Moderate |
Mid-Flood |
S |
1 |
14:49 |
9.68 |
8.15 |
31 |
20.36 |
2.73 |
4 |
|
WSR36 |
20220129 |
Cloudy |
Moderate |
Mid-Flood |
S |
1 |
14:49 |
9.71 |
8.25 |
30.94 |
20.51 |
2.96 |
3 |
|
WSR36 |
20220129 |
Cloudy |
Moderate |
Mid-Flood |
M |
3.85 |
14:49 |
9.68 |
8.23 |
31.01 |
20.41 |
2.32 |
4 |
|
WSR36 |
20220129 |
Cloudy |
Moderate |
Mid-Flood |
M |
3.85 |
14:49 |
9.72 |
8.23 |
31.01 |
20.41 |
2.45 |
6 |
|
WSR36 |
20220129 |
Cloudy |
Moderate |
Mid-Flood |
B |
6.7 |
14:48 |
9.74 |
8.24 |
30.96 |
20.43 |
2.69 |
7 |
|
WSR36 |
20220129 |
Cloudy |
Moderate |
Mid-Flood |
B |
6.7 |
14:48 |
9.75 |
8.16 |
31.12 |
20.37 |
2.63 |
5 |
|
WSR36 |
20220131 |
Cloudy |
Moderate |
Mid-Flood |
S |
1 |
16:43 |
8.93 |
8.12 |
33.34 |
20.19 |
2.29 |
4 |
|
WSR36 |
20220131 |
Cloudy |
Moderate |
Mid-Flood |
S |
1 |
16:43 |
8.92 |
8.1 |
33.42 |
20.21 |
1.98 |
3 |
|
WSR36 |
20220131 |
Cloudy |
Moderate |
Mid-Flood |
M |
3.7 |
16:43 |
8.94 |
8.13 |
33.45 |
20.17 |
2.43 |
4 |
|
WSR36 |
20220131 |
Cloudy |
Moderate |
Mid-Flood |
M |
3.7 |
16:43 |
8.95 |
8.05 |
33.26 |
20.2 |
2.19 |
3 |
|
Location |
Date |
Weather |
Sea Conidtion |
Tidal |
Water Level |
Depth (m) |
Time |
DO (mg/L) |
H |
Sal (ppt) |
Temp (�XC) |
Turbidty (NTU) |
SS (mg/L) |
|
WSR36 |
20220131 |
Cloudy |
Moderate |
Mid-Flood |
B |
6.4 |
16:42 |
8.94 |
8.07 |
33.37 |
20.15 |
2.19 |
4 |
|
WSR36 |
20220131 |
Cloudy |
Moderate |
Mid-Flood |
B |
6.4 |
16:42 |
8.93 |
8.14 |
33.38 |
20.15 |
2.39 |
4 |
|
WSR37 |
20220101 |
Cloudy |
Moderate |
Mid-Flood |
S |
1 |
16:21 |
8.64 |
8.41 |
31.55 |
22.15 |
2.1 |
11 |
|
WSR37 |
20220101 |
Cloudy |
Moderate |
Mid-Flood |
S |
1 |
16:21 |
8.69 |
8.34 |
31.4 |
22.06 |
2.41 |
11 |
|
WSR37 |
20220101 |
Cloudy |
Moderate |
Mid-Flood |
M |
4.1 |
16:20 |
8.71 |
8.4 |
31.46 |
22.03 |
1.83 |
4 |
|
WSR37 |
20220101 |
Cloudy |
Moderate |
Mid-Flood |
M |
4.1 |
16:20 |
8.75 |
8.31 |
31.45 |
22.02 |
2.04 |
3 |
|
WSR37 |
20220101 |
Cloudy |
Moderate |
Mid-Flood |
B |
7.2 |
16:19 |
8.61 |
8.41 |
31.45 |
22.17 |
1.79 |
4 |
|
WSR37 |
20220101 |
Cloudy |
Moderate |
Mid-Flood |
B |
7.2 |
16:19 |
8.5 |
8.37 |
31.47 |
22.03 |
1.84 |
6 |
|
WSR37 |
20220104 |
Sunny |
Moderate |
Mid-Flood |
S |
1 |
9:45 |
8.58 |
8.25 |
30.73 |
22.04 |
2.06 |
7 |
|
WSR37 |
20220104 |
Sunny |
Moderate |
Mid-Flood |
S |
1 |
9:45 |
8.49 |
8.24 |
30.78 |
22.05 |
1.84 |
7 |
|
WSR37 |
20220104 |
Sunny |
Moderate |
Mid-Flood |
M |
3.85 |
9:44 |
8.67 |
8.26 |
30.81 |
22.16 |
2.13 |
6 |
|
WSR37 |
20220104 |
Sunny |
Moderate |
Mid-Flood |
M |
3.85 |
9:44 |
8.56 |
8.21 |
30.72 |
22.09 |
2.08 |
8 |
|
WSR37 |
20220104 |
Sunny |
Moderate |
Mid-Flood |
B |
6.7 |
9:43 |
8.7 |
8.19 |
30.69 |
22.22 |
2.1 |
23 |
|
WSR37 |
20220104 |
Sunny |
Moderate |
Mid-Flood |
B |
6.7 |
9:43 |
8.7 |
8.25 |
30.68 |
22.23 |
1.82 |
23 |
|
WSR37 |
20220106 |
Sunny |
Moderate |
Mid-Flood |
S |
1 |
10:02 |
8.84 |
8.48 |
32.28 |
22.73 |
3.15 |
6 |
|
WSR37 |
20220106 |
Sunny |
Moderate |
Mid-Flood |
S |
1 |
10:02 |
8.75 |
8.47 |
32.39 |
22.61 |
3.53 |
6 |
|
WSR37 |
20220106 |
Sunny |
Moderate |
Mid-Flood |
M |
4.25 |
10:01 |
8.74 |
8.41 |
32.3 |
22.81 |
2.78 |
3 |
|
WSR37 |
20220106 |
Sunny |
Moderate |
Mid-Flood |
M |
4.25 |
10:01 |
8.83 |
8.48 |
32.22 |
22.65 |
2.79 |
2.5 |
|
WSR37 |
20220106 |
Sunny |
Moderate |
Mid-Flood |
B |
7.5 |
10:00 |
8.74 |
8.47 |
32.34 |
22.68 |
3.33 |
2.5 |
|
WSR37 |
20220106 |
Sunny |
Moderate |
Mid-Flood |
B |
7.5 |
10:00 |
8.87 |
8.43 |
32.35 |
22.77 |
3.3 |
3 |
|
WSR37 |
20220108 |
Sunny |
Moderate |
Mid-Flood |
S |
1 |
11:18 |
9.09 |
8.4 |
35.16 |
21.81 |
2.37 |
6 |
|
WSR37 |
20220108 |
Sunny |
Moderate |
Mid-Flood |
S |
1 |
11:18 |
9.1 |
8.39 |
35.13 |
21.74 |
2.6 |
7 |
|
WSR37 |
20220108 |
Sunny |
Moderate |
Mid-Flood |
M |
4.15 |
11:17 |
9.13 |
8.4 |
35.07 |
21.8 |
2.23 |
6 |
|
WSR37 |
20220108 |
Sunny |
Moderate |
Mid-Flood |
M |
4.15 |
11:17 |
9.14 |
8.34 |
35.03 |
21.85 |
2.15 |
5 |
|
WSR37 |
20220108 |
Sunny |
Moderate |
Mid-Flood |
B |
7.3 |
11:16 |
9.09 |
8.37 |
35.01 |
21.77 |
2.28 |
6 |
|
WSR37 |
20220108 |
Sunny |
Moderate |
Mid-Flood |
B |
7.3 |
11:16 |
9.11 |
8.35 |
35.11 |
21.8 |
2.69 |
8 |
|
Location |
Date |
Weather |
Sea Conidtion |
Tidal |
Water Level |
Depth (m) |
Time |
DO (mg/L) |
H |
Sal (ppt) |
Temp (�XC) |
Turbidty (NTU) |
SS (mg/L) |
|
WSR37 |
20220111 |
Sunny |
Moderate |
Mid-Flood |
S |
1 |
19:15 |
9.68 |
8.35 |
34.94 |
19.95 |
2.85 |
3 |
|
WSR37 |
20220111 |
Sunny |
Moderate |
Mid-Flood |
S |
1 |
19:15 |
9.79 |
8.36 |
34.92 |
19.95 |
2.48 |
4 |
|
WSR37 |
20220111 |
Sunny |
Moderate |
Mid-Flood |
M |
4.35 |
19:14 |
9.61 |
8.38 |
34.93 |
19.83 |
2.87 |
8 |
|
WSR37 |
20220111 |
Sunny |
Moderate |
Mid-Flood |
M |
4.35 |
19:14 |
9.48 |
8.33 |
34.99 |
19.9 |
2.45 |
8 |
|
WSR37 |
20220111 |
Sunny |
Moderate |
Mid-Flood |
B |
7.7 |
19:13 |
9.68 |
8.31 |
34.86 |
19.87 |
2.99 |
5 |
|
WSR37 |
20220111 |
Sunny |
Moderate |
Mid-Flood |
B |
7.7 |
19:13 |
9.69 |
8.36 |
35.07 |
19.92 |
2.66 |
7 |
|
WSR37 |
20220113 |
Cloudy |
Moderate |
Mid-Flood |
S |
1 |
14:52 |
8.59 |
8.35 |
32.95 |
20.38 |
3.38 |
2.5 |
|
WSR37 |
20220113 |
Cloudy |
Moderate |
Mid-Flood |
S |
1 |
14:52 |
8.72 |
8.36 |
33.02 |
20.39 |
3.74 |
2.5 |
|
WSR37 |
20220113 |
Cloudy |
Moderate |
Mid-Flood |
M |
4.15 |
14:51 |
8.64 |
8.27 |
33 |
20.59 |
3.11 |
2.5 |
|
WSR37 |
20220113 |
Cloudy |
Moderate |
Mid-Flood |
M |
4.15 |
14:51 |
8.72 |
8.38 |
33 |
20.42 |
3.38 |
4 |
|
WSR37 |
20220113 |
Cloudy |
Moderate |
Mid-Flood |
B |
7.3 |
14:50 |
8.62 |
8.34 |
32.94 |
20.58 |
3.65 |
2.5 |
|
WSR37 |
20220113 |
Cloudy |
Moderate |
Mid-Flood |
B |
7.3 |
14:50 |
8.72 |
8.32 |
33.01 |
20.42 |
3.33 |
4 |
|
WSR37 |
20220115 |
Cloudy |
Moderate |
Mid-Flood |
S |
1 |
16:04 |
8.37 |
8.14 |
33.84 |
21.14 |
3.24 |
5 |
|
WSR37 |
20220115 |
Cloudy |
Moderate |
Mid-Flood |
S |
1 |
16:04 |
8.38 |
8.09 |
33.83 |
21.04 |
3.53 |
5 |
|
WSR37 |
20220115 |
Cloudy |
Moderate |
Mid-Flood |
M |
4 |
16:03 |
8.37 |
8.15 |
33.87 |
21 |
2.84 |
3 |
|
WSR37 |
20220115 |
Cloudy |
Moderate |
Mid-Flood |
M |
4 |
16:03 |
8.44 |
8.14 |
33.76 |
21.09 |
2.89 |
2.5 |
|
WSR37 |
20220115 |
Cloudy |
Moderate |
Mid-Flood |
B |
7 |
16:02 |
8.36 |
8.12 |
33.78 |
21.02 |
3.06 |
2.5 |
|
WSR37 |
20220115 |
Cloudy |
Moderate |
Mid-Flood |
B |
7 |
16:02 |
8.36 |
8.16 |
33.87 |
21.01 |
3.26 |
2.5 |
|
WSR37 |
20220118 |
Cloudy |
Moderate |
Mid-Flood |
S |
1 |
17:14 |
8.95 |
8.04 |
33.98 |
21.02 |
3.07 |
7 |
|
WSR37 |
20220118 |
Cloudy |
Moderate |
Mid-Flood |
S |
1 |
17:14 |
8.95 |
8.07 |
33.95 |
20.98 |
3.37 |
7 |
|
WSR37 |
20220118 |
Cloudy |
Moderate |
Mid-Flood |
M |
3.95 |
17:13 |
8.95 |
8.03 |
33.99 |
20.99 |
3.01 |
4 |
|
WSR37 |
20220118 |
Cloudy |
Moderate |
Mid-Flood |
M |
3.95 |
17:13 |
8.92 |
8.06 |
33.98 |
21.01 |
3.4 |
5 |
|
WSR37 |
20220118 |
Cloudy |
Moderate |
Mid-Flood |
B |
6.9 |
17:12 |
8.93 |
8.04 |
33.97 |
20.85 |
3.3 |
7 |
|
WSR37 |
20220118 |
Cloudy |
Moderate |
Mid-Flood |
B |
6.9 |
17:12 |
8.97 |
8.05 |
33.92 |
20.9 |
2.83 |
7 |
|
WSR37 |
20220120 |
Sunny |
Moderate |
Mid-Flood |
S |
1 |
9:40 |
8.67 |
8.19 |
34.14 |
20.63 |
3.77 |
5 |
|
WSR37 |
20220120 |
Sunny |
Moderate |
Mid-Flood |
S |
1 |
9:40 |
8.6 |
8.18 |
34.36 |
20.6 |
4.37 |
4 |
|
WSR37 |
20220120 |
Sunny |
Moderate |
Mid-Flood |
M |
4.25 |
9:39 |
8.75 |
8.22 |
34.28 |
20.62 |
3.46 |
5 |
|
WSR37 |
20220120 |
Sunny |
Moderate |
Mid-Flood |
M |
4.25 |
9:39 |
8.77 |
8.24 |
34.15 |
20.6 |
3.75 |
5 |
|
WSR37 |
20220120 |
Sunny |
Moderate |
Mid-Flood |
B |
7.5 |
9:38 |
8.77 |
8.16 |
34.11 |
20.68 |
3.42 |
6 |
|
WSR37 |
20220120 |
Sunny |
Moderate |
Mid-Flood |
B |
7.5 |
9:38 |
8.58 |
8.16 |
34.18 |
20.66 |
3.54 |
8 |
|
Location |
Date |
Weather |
Sea Conidtion |
Tidal |
Water Level |
Depth (m) |
Time |
DO (mg/L) |
H |
Sal (ppt) |
Temp (�XC) |
Turbidty (NTU) |
SS (mg/L) |
|
WSR37 |
20220122 |
Cloudy |
Moderate |
Mid-Flood |
S |
1 |
9:43 |
9.29 |
8.4 |
33.68 |
20.97 |
2.75 |
6 |
|
WSR37 |
20220122 |
Cloudy |
Moderate |
Mid-Flood |
S |
1 |
9:43 |
9.18 |
8.44 |
33.75 |
21.05 |
3.05 |
6 |
|
WSR37 |
20220122 |
Cloudy |
Moderate |
Mid-Flood |
M |
3.9 |
9:42 |
9.19 |
8.37 |
33.7 |
21.06 |
2.49 |
4 |
|
WSR37 |
20220122 |
Cloudy |
Moderate |
Mid-Flood |
M |
3.9 |
9:42 |
9.26 |
8.39 |
33.84 |
20.99 |
2.26 |
3 |
|
WSR37 |
20220122 |
Cloudy |
Moderate |
Mid-Flood |
B |
6.8 |
9:41 |
9.19 |
8.38 |
33.87 |
20.94 |
2.44 |
7 |
|
WSR37 |
20220122 |
Cloudy |
Moderate |
Mid-Flood |
B |
6.8 |
9:41 |
9.23 |
8.44 |
33.82 |
21.07 |
2.35 |
8 |
|
WSR37 |
20220125 |
Cloudy |
Moderate |
Mid-Flood |
S |
1 |
11:40 |
8.28 |
8.29 |
31.27 |
21.04 |
3.64 |
3 |
|
WSR37 |
20220125 |
Cloudy |
Moderate |
Mid-Flood |
S |
1 |
11:40 |
8.29 |
8.19 |
31.2 |
21.15 |
3.41 |
3 |
|
WSR37 |
20220125 |
Cloudy |
Moderate |
Mid-Flood |
M |
3.95 |
11:39 |
8.23 |
8.28 |
31.15 |
21.08 |
3.39 |
3 |
|
WSR37 |
20220125 |
Cloudy |
Moderate |
Mid-Flood |
M |
3.95 |
11:39 |
8.23 |
8.2 |
31.11 |
21.15 |
2.86 |
2.5 |
|
WSR37 |
20220125 |
Cloudy |
Moderate |
Mid-Flood |
B |
6.9 |
11:38 |
8.39 |
8.3 |
31.12 |
21.05 |
3.33 |
3 |
|
WSR37 |
20220125 |
Cloudy |
Moderate |
Mid-Flood |
B |
6.9 |
11:38 |
8.37 |
8.17 |
31.18 |
21.16 |
3.04 |
3 |
|
WSR37 |
20220127 |
Cloudy |
Moderate |
Mid-Flood |
S |
1 |
13:18 |
9.08 |
8.22 |
30.91 |
21 |
2.74 |
4 |
|
WSR37 |
20220127 |
Cloudy |
Moderate |
Mid-Flood |
S |
1 |
13:18 |
9.21 |
8.2 |
30.87 |
21.02 |
3.25 |
6 |
|
WSR37 |
20220127 |
Cloudy |
Moderate |
Mid-Flood |
M |
4.4 |
13:17 |
9.14 |
8.13 |
30.82 |
21 |
2.72 |
4 |
|
WSR37 |
20220127 |
Cloudy |
Moderate |
Mid-Flood |
M |
4.4 |
13:17 |
9.12 |
8.2 |
30.98 |
20.97 |
2.67 |
4 |
|
WSR37 |
20220127 |
Cloudy |
Moderate |
Mid-Flood |
B |
7.8 |
13:16 |
9.2 |
8.2 |
30.87 |
20.97 |
2.79 |
3 |
|
WSR37 |
20220127 |
Cloudy |
Moderate |
Mid-Flood |
B |
7.8 |
13:16 |
9.17 |
8.2 |
30.96 |
21.09 |
2.48 |
4 |
|
WSR37 |
20220129 |
Cloudy |
Moderate |
Mid-Flood |
S |
1 |
15:04 |
9.22 |
8.1 |
30.63 |
20.28 |
2.65 |
3 |
|
WSR37 |
20220129 |
Cloudy |
Moderate |
Mid-Flood |
S |
1 |
15:04 |
9.25 |
8.2 |
30.72 |
20.28 |
2.51 |
5 |
|
WSR37 |
20220129 |
Cloudy |
Moderate |
Mid-Flood |
M |
4.1 |
15:03 |
9.19 |
8.12 |
30.6 |
20.29 |
2.37 |
4 |
|
WSR37 |
20220129 |
Cloudy |
Moderate |
Mid-Flood |
M |
4.1 |
15:03 |
9.16 |
8.12 |
30.79 |
20.29 |
2.14 |
4 |
|
WSR37 |
20220129 |
Cloudy |
Moderate |
Mid-Flood |
B |
7.2 |
15:02 |
9.15 |
8.14 |
30.66 |
20.27 |
2.46 |
6 |
|
WSR37 |
20220129 |
Cloudy |
Moderate |
Mid-Flood |
B |
7.2 |
15:02 |
9.27 |
8.19 |
30.75 |
20.19 |
2.12 |
3 |
|
WSR37 |
20220131 |
Cloudy |
Moderate |
Mid-Flood |
S |
1 |
16:59 |
8.42 |
8.19 |
33.59 |
19.87 |
2.51 |
3 |
|
WSR37 |
20220131 |
Cloudy |
Moderate |
Mid-Flood |
S |
1 |
16:59 |
8.25 |
8.17 |
33.67 |
19.85 |
2.5 |
4 |
|
WSR37 |
20220131 |
Cloudy |
Moderate |
Mid-Flood |
M |
4.4 |
16:58 |
8.29 |
8.11 |
33.63 |
19.87 |
2.6 |
4 |
|
WSR37 |
20220131 |
Cloudy |
Moderate |
Mid-Flood |
M |
4.4 |
16:58 |
8.38 |
8.19 |
33.49 |
19.92 |
2.27 |
4 |
|
WSR37 |
20220131 |
Cloudy |
Moderate |
Mid-Flood |
B |
7.8 |
16:57 |
8.3 |
8.15 |
33.53 |
19.92 |
2.28 |
4 |
|
WSR37 |
20220131 |
Cloudy |
Moderate |
Mid-Flood |
B |
7.8 |
16:57 |
8.25 |
8.18 |
33.54 |
19.87 |
2.16 |
4 |
|
Location |
Date |
Weather |
Sea Conidtion |
Tidal |
Water Level |
Depth
(m) |
Time |
DO (mg/L) |
pH |
Sal (ppt) |
Temp (�XC) |
Turbidty (NTU) |
SS
(mg/L) |
|
CE |
20220101 |
Cloudy |
Moderate |
Mid-Ebb |
S |
1 |
9:26 |
8.7 |
8.33 |
32.53 |
22.24 |
4.61 |
5 |
|
CE |
20220101 |
Cloudy |
Moderate |
Mid-Ebb |
S |
1 |
9:26 |
8.77 |
8.35 |
32.72 |
22.23 |
4.33 |
7 |
|
CE |
20220101 |
Cloudy |
Moderate |
Mid-Ebb |
M |
11.45 |
9:25 |
8.66 |
8.32 |
32.54 |
22.1 |
4.18 |
3 |
|
CE |
20220101 |
Cloudy |
Moderate |
Mid-Ebb |
M |
11.45 |
9:25 |
8.77 |
8.33 |
32.59 |
22.24 |
4.67 |
5 |
|
CE |
20220101 |
Cloudy |
Moderate |
Mid-Ebb |
B |
21.9 |
9:24 |
8.6 |
8.34 |
32.59 |
22.19 |
3.93 |
5 |
|
CE |
20220101 |
Cloudy |
Moderate |
Mid-Ebb |
B |
21.9 |
9:24 |
8.7 |
8.37 |
32.59 |
22.18 |
3.97 |
6 |
|
CE |
20220104 |
Sunny |
Moderate |
Mid-Ebb |
S |
1 |
11:48 |
8.65 |
8.36 |
31.86 |
22.64 |
3.94 |
8 |
|
CE |
20220104 |
Sunny |
Moderate |
Mid-Ebb |
S |
1 |
11:48 |
8.61 |
8.38 |
31.68 |
22.55 |
4.03 |
8 |
|
CE |
20220104 |
Sunny |
Moderate |
Mid-Ebb |
M |
12.05 |
11:47 |
8.53 |
8.36 |
31.68 |
22.52 |
3.38 |
5 |
|
CE |
20220104 |
Sunny |
Moderate |
Mid-Ebb |
M |
12.05 |
11:47 |
8.59 |
8.34 |
31.95 |
22.67 |
3.65 |
5 |
|
CE |
20220104 |
Sunny |
Moderate |
Mid-Ebb |
B |
23.1 |
11:46 |
8.43 |
8.4 |
31.86 |
22.58 |
3.96 |
4 |
|
CE |
20220104 |
Sunny |
Moderate |
Mid-Ebb |
B |
23.1 |
11:46 |
8.44 |
8.4 |
31.72 |
22.64 |
3.68 |
3 |
|
CE |
20220106 |
Sunny |
Moderate |
Mid-Ebb |
S |
1 |
13:31 |
8.33 |
8.23 |
32.4 |
22.84 |
4.03 |
4 |
|
CE |
20220106 |
Sunny |
Moderate |
Mid-Ebb |
S |
1 |
13:31 |
8.37 |
8.23 |
32.54 |
22.75 |
3.58 |
3 |
|
CE |
20220106 |
Sunny |
Moderate |
Mid-Ebb |
M |
11.85 |
13:30 |
8.36 |
8.18 |
32.49 |
22.8 |
5.01 |
3 |
|
CE |
20220106 |
Sunny |
Moderate |
Mid-Ebb |
M |
11.85 |
13:30 |
8.5 |
8.22 |
32.46 |
22.84 |
4.69 |
3 |
|
CE |
20220106 |
Sunny |
Moderate |
Mid-Ebb |
B |
22.7 |
13:29 |
8.46 |
8.21 |
32.54 |
22.82 |
4.97 |
4 |
|
CE |
20220106 |
Sunny |
Moderate |
Mid-Ebb |
B |
22.7 |
13:29 |
8.36 |
8.17 |
32.44 |
22.82 |
4.52 |
4 |
|
CE |
20220108 |
Sunny |
Moderate |
Mid-Ebb |
S |
1 |
15:17 |
8.97 |
8.26 |
34.21 |
22.11 |
3.16 |
3 |
|
CE |
20220108 |
Sunny |
Moderate |
Mid-Ebb |
S |
1 |
15:17 |
8.89 |
8.33 |
34.19 |
22.15 |
3.17 |
4 |
|
CE |
20220108 |
Sunny |
Moderate |
Mid-Ebb |
M |
10.5 |
15:16 |
8.89 |
8.3 |
34.24 |
22.13 |
2.89 |
4 |
|
CE |
20220108 |
Sunny |
Moderate |
Mid-Ebb |
M |
10.5 |
15:16 |
9.03 |
8.3 |
34.21 |
22.15 |
2.9 |
4 |
|
CE |
20220108 |
Sunny |
Moderate |
Mid-Ebb |
B |
20 |
15:15 |
8.93 |
8.28 |
34.28 |
22.11 |
3.17 |
4 |
|
CE |
20220108 |
Sunny |
Moderate |
Mid-Ebb |
B |
20 |
15:15 |
9.04 |
8.3 |
34.23 |
22.1 |
2.83 |
6 |
|
CE |
20220111 |
Sunny |
Moderate |
Mid-Ebb |
S |
1 |
11:43 |
8.91 |
8.36 |
34.79 |
20.46 |
3.8 |
3 |
|
CE |
20220111 |
Sunny |
Moderate |
Mid-Ebb |
S |
1 |
11:43 |
8.82 |
8.31 |
34.79 |
20.45 |
3.57 |
4 |
|
Location |
Date |
Weather |
Sea Conidtion |
Tidal |
Water Level |
Depth
(m) |
Time |
DO (mg/L) |
pH |
Sal (ppt) |
Temp (�XC) |
Turbidty (NTU) |
SS
(mg/L) |
|
CE |
20220111 |
Sunny |
Moderate |
Mid-Ebb |
M |
10.35 |
11:42 |
8.71 |
8.32 |
34.69 |
20.45 |
3.29 |
3 |
|
CE |
20220111 |
Sunny |
Moderate |
Mid-Ebb |
M |
10.35 |
11:42 |
9 |
8.31 |
34.79 |
20.49 |
3.43 |
4 |
|
CE |
20220111 |
Sunny |
Moderate |
Mid-Ebb |
B |
19.7 |
11:41 |
8.86 |
8.37 |
34.63 |
20.65 |
3.44 |
3 |
|
CE |
20220111 |
Sunny |
Moderate |
Mid-Ebb |
B |
19.7 |
11:41 |
9.02 |
8.36 |
34.71 |
20.71 |
2.97 |
3 |
|
CE |
20220113 |
Cloudy |
Moderate |
Mid-Ebb |
S |
1 |
8:02 |
8.09 |
8.13 |
32.77 |
20.36 |
3.72 |
2.5 |
|
CE |
20220113 |
Cloudy |
Moderate |
Mid-Ebb |
S |
1 |
8:02 |
8.36 |
8.18 |
32.82 |
20.48 |
4.12 |
2.5 |
|
CE |
20220113 |
Cloudy |
Moderate |
Mid-Ebb |
M |
11.6 |
8:01 |
8.02 |
8.2 |
32.78 |
20.53 |
4.05 |
4 |
|
CE |
20220113 |
Cloudy |
Moderate |
Mid-Ebb |
M |
11.6 |
8:01 |
8.08 |
8.18 |
32.89 |
20.48 |
3.87 |
5 |
|
CE |
20220113 |
Cloudy |
Moderate |
Mid-Ebb |
B |
22.2 |
8:00 |
8.14 |
8.17 |
32.88 |
20.45 |
3.34 |
4 |
|
CE |
20220113 |
Cloudy |
Moderate |
Mid-Ebb |
B |
22.2 |
8:00 |
8.06 |
8.15 |
32.76 |
20.53 |
3.55 |
3 |
|
CE |
20220115 |
Cloudy |
Moderate |
Mid-Ebb |
S |
1 |
10:08 |
9.23 |
8.23 |
32.82 |
20.88 |
3.92 |
4 |
|
CE |
20220115 |
Cloudy |
Moderate |
Mid-Ebb |
S |
1 |
10:08 |
9.27 |
8.18 |
32.85 |
20.88 |
3.33 |
6 |
|
CE |
20220115 |
Cloudy |
Moderate |
Mid-Ebb |
M |
11.3 |
10:07 |
9.26 |
8.23 |
32.9 |
20.82 |
3.93 |
5 |
|
CE |
20220115 |
Cloudy |
Moderate |
Mid-Ebb |
M |
11.3 |
10:07 |
9.23 |
8.2 |
32.8 |
20.88 |
3.38 |
7 |
|
CE |
20220115 |
Cloudy |
Moderate |
Mid-Ebb |
B |
21.6 |
10:06 |
9.23 |
8.22 |
32.93 |
20.82 |
4.04 |
5 |
|
CE |
20220115 |
Cloudy |
Moderate |
Mid-Ebb |
B |
21.6 |
10:06 |
9.23 |
8.22 |
32.9 |
20.85 |
4.24 |
6 |
|
CE |
20220118 |
Cloudy |
Moderate |
Mid-Ebb |
S |
1 |
9:46 |
9.13 |
8.31 |
33.91 |
20.96 |
4.32 |
4 |
|
CE |
20220118 |
Cloudy |
Moderate |
Mid-Ebb |
S |
1 |
9:46 |
9.09 |
8.33 |
33.89 |
21.09 |
4.37 |
6 |
|
CE |
20220118 |
Cloudy |
Moderate |
Mid-Ebb |
M |
11.2 |
9:45 |
9.08 |
8.33 |
33.83 |
21.11 |
4.61 |
5 |
|
CE |
20220118 |
Cloudy |
Moderate |
Mid-Ebb |
M |
11.2 |
9:45 |
9.2 |
8.29 |
33.89 |
21.04 |
5.12 |
5 |
|
CE |
20220118 |
Cloudy |
Moderate |
Mid-Ebb |
B |
21.4 |
9:44 |
9.11 |
8.28 |
33.99 |
21.03 |
4.66 |
11 |
|
CE |
20220118 |
Cloudy |
Moderate |
Mid-Ebb |
B |
21.4 |
9:44 |
9.2 |
8.31 |
33.91 |
21.03 |
4.35 |
11 |
|
CE |
20220120 |
Sunny |
Moderate |
Mid-Ebb |
S |
1 |
12:00 |
7.91 |
8.28 |
33.61 |
21.04 |
4.37 |
5 |
|
CE |
20220120 |
Sunny |
Moderate |
Mid-Ebb |
S |
1 |
12:00 |
7.99 |
8.25 |
33.46 |
21.06 |
4.87 |
6 |
|
CE |
20220120 |
Sunny |
Moderate |
Mid-Ebb |
M |
11.9 |
11:59 |
7.91 |
8.24 |
33.6 |
21.11 |
4.49 |
6 |
|
CE |
20220120 |
Sunny |
Moderate |
Mid-Ebb |
M |
11.9 |
11:59 |
7.93 |
8.29 |
33.81 |
21.04 |
4.3 |
4 |
|
Location |
Date |
Weather |
Sea Conidtion |
Tidal |
Water Level |
Depth
(m) |
Time |
DO (mg/L) |
pH |
Sal (ppt) |
Temp (�XC) |
Turbidty (NTU) |
SS
(mg/L) |
|
CE |
20220120 |
Sunny |
Moderate |
Mid-Ebb |
B |
22.8 |
11:58 |
8.02 |
8.24 |
33.78 |
21.04 |
4.56 |
5 |
|
CE |
20220120 |
Sunny |
Moderate |
Mid-Ebb |
B |
22.8 |
11:58 |
8.02 |
8.27 |
33.45 |
21.04 |
4.13 |
4 |
|
CE |
20220122 |
Cloudy |
Moderate |
Mid-Ebb |
S |
1 |
13:26 |
8.77 |
8.23 |
33.56 |
21.4 |
3.85 |
3 |
|
CE |
20220122 |
Cloudy |
Moderate |
Mid-Ebb |
S |
1 |
13:26 |
8.7 |
8.3 |
33.74 |
21.3 |
3.78 |
5 |
|
CE |
20220122 |
Cloudy |
Moderate |
Mid-Ebb |
M |
11.05 |
13:25 |
8.76 |
8.28 |
33.52 |
21.31 |
4.19 |
5 |
|
CE |
20220122 |
Cloudy |
Moderate |
Mid-Ebb |
M |
11.05 |
13:25 |
8.66 |
8.22 |
33.61 |
21.42 |
3.97 |
3 |
|
CE |
20220122 |
Cloudy |
Moderate |
Mid-Ebb |
B |
21.1 |
13:24 |
8.7 |
8.31 |
33.66 |
21.32 |
3.48 |
4 |
|
CE |
20220122 |
Cloudy |
Moderate |
Mid-Ebb |
B |
21.1 |
13:24 |
8.7 |
8.23 |
33.69 |
21.42 |
3.88 |
5 |
|
CE |
20220125 |
Cloudy |
Moderate |
Mid-Ebb |
S |
1 |
15:45 |
8.94 |
8.14 |
30.89 |
20.89 |
3.46 |
2.5 |
|
CE |
20220125 |
Cloudy |
Moderate |
Mid-Ebb |
S |
1 |
15:45 |
8.96 |
8.12 |
30.85 |
20.93 |
3.65 |
2.5 |
|
CE |
20220125 |
Cloudy |
Moderate |
Mid-Ebb |
M |
11.35 |
15:44 |
8.93 |
8.19 |
30.9 |
20.96 |
3.56 |
3 |
|
CE |
20220125 |
Cloudy |
Moderate |
Mid-Ebb |
M |
11.35 |
15:44 |
8.96 |
8.07 |
30.93 |
20.98 |
3.92 |
3 |
|
CE |
20220125 |
Cloudy |
Moderate |
Mid-Ebb |
B |
21.7 |
15:43 |
8.9 |
8.09 |
30.87 |
21 |
4.12 |
3 |
|
CE |
20220125 |
Cloudy |
Moderate |
Mid-Ebb |
B |
21.7 |
15:43 |
8.99 |
8.11 |
30.94 |
20.92 |
3.68 |
3 |
|
CE |
20220127 |
Cloudy |
Moderate |
Mid-Ebb |
S |
1 |
8:02 |
8.53 |
8.19 |
31.4 |
20.82 |
3.45 |
6 |
|
CE |
20220127 |
Cloudy |
Moderate |
Mid-Ebb |
S |
1 |
8:02 |
8.6 |
8.15 |
31.52 |
20.98 |
3.42 |
6 |
|
CE |
20220127 |
Cloudy |
Moderate |
Mid-Ebb |
M |
11.5 |
8:01 |
8.53 |
8.17 |
31.52 |
20.94 |
3.78 |
10 |
|
CE |
20220127 |
Cloudy |
Moderate |
Mid-Ebb |
M |
11.5 |
8:01 |
8.6 |
8.19 |
31.47 |
20.83 |
3.48 |
10 |
|
CE |
20220127 |
Cloudy |
Moderate |
Mid-Ebb |
B |
22 |
8:00 |
8.74 |
8.18 |
31.49 |
20.87 |
3.24 |
5 |
|
CE |
20220127 |
Cloudy |
Moderate |
Mid-Ebb |
B |
22 |
8:00 |
8.53 |
8.2 |
31.37 |
20.84 |
3.66 |
5 |
|
CE |
20220129 |
Cloudy |
Moderate |
Mid-Ebb |
S |
1 |
8:16 |
9.73 |
8.14 |
31.17 |
20.39 |
4.87 |
6 |
|
CE |
20220129 |
Cloudy |
Moderate |
Mid-Ebb |
S |
1 |
8:16 |
9.75 |
8.18 |
30.92 |
20.35 |
4.6 |
4 |
|
CE |
20220129 |
Cloudy |
Moderate |
Mid-Ebb |
M |
10.95 |
8:15 |
9.75 |
8.07 |
31.06 |
20.39 |
4.46 |
7 |
|
CE |
20220129 |
Cloudy |
Moderate |
Mid-Ebb |
M |
10.95 |
8:15 |
9.69 |
8.06 |
31.11 |
20.33 |
5.15 |
7 |
|
CE |
20220129 |
Cloudy |
Moderate |
Mid-Ebb |
B |
20.9 |
8:14 |
9.71 |
8.09 |
31.15 |
20.35 |
4.08 |
4 |
|
CE |
20220129 |
Cloudy |
Moderate |
Mid-Ebb |
B |
20.9 |
8:14 |
9.69 |
8.18 |
31.14 |
20.4 |
4.75 |
6 |
|
Location |
Date |
Weather |
Sea Conidtion |
Tidal |
Water Level |
Depth
(m) |
Time |
DO (mg/L) |
pH |
Sal (ppt) |
Temp (�XC) |
Turbidty (NTU) |
SS
(mg/L) |
|
CE |
20220131 |
Cloudy |
Moderate |
Mid-Ebb |
S |
1 |
10:08 |
7.88 |
8.1 |
33.48 |
19.83 |
2.97 |
4 |
|
CE |
20220131 |
Cloudy |
Moderate |
Mid-Ebb |
S |
1 |
10:08 |
8.04 |
8.16 |
33.57 |
19.84 |
3.33 |
3 |
|
CE |
20220131 |
Cloudy |
Moderate |
Mid-Ebb |
M |
11.85 |
10:07 |
7.89 |
8.16 |
33.61 |
19.91 |
3.77 |
3 |
|
CE |
20220131 |
Cloudy |
Moderate |
Mid-Ebb |
M |
11.85 |
10:07 |
7.92 |
8.12 |
33.6 |
19.93 |
3.27 |
3 |
|
CE |
20220131 |
Cloudy |
Moderate |
Mid-Ebb |
B |
22.7 |
10:06 |
7.9 |
8.09 |
33.42 |
19.92 |
3.57 |
4 |
|
CE |
20220131 |
Cloudy |
Moderate |
Mid-Ebb |
B |
22.7 |
10:06 |
8.05 |
8.13 |
33.53 |
19.92 |
3.24 |
3 |
|
CF |
20220101 |
Cloudy |
Moderate |
Mid-Ebb |
S |
1 |
11:52 |
8.25 |
8.5 |
32.56 |
21.9 |
3.38 |
6 |
|
CF |
20220101 |
Cloudy |
Moderate |
Mid-Ebb |
S |
1 |
11:52 |
8.31 |
8.48 |
32.51 |
21.96 |
3.63 |
5 |
|
CF |
20220101 |
Cloudy |
Moderate |
Mid-Ebb |
M |
9.9 |
11:51 |
8.34 |
8.44 |
32.65 |
22.03 |
3.61 |
6 |
|
CF |
20220101 |
Cloudy |
Moderate |
Mid-Ebb |
M |
9.9 |
11:51 |
8.35 |
8.46 |
32.56 |
22.11 |
3.61 |
6 |
|
CF |
20220101 |
Cloudy |
Moderate |
Mid-Ebb |
B |
18.8 |
11:50 |
8.28 |
8.47 |
32.59 |
21.96 |
3.1 |
8 |
|
CF |
20220101 |
Cloudy |
Moderate |
Mid-Ebb |
B |
18.8 |
11:50 |
8.4 |
8.46 |
32.52 |
22 |
3.59 |
8 |
|
CF |
20220104 |
Sunny |
Moderate |
Mid-Ebb |
S |
1 |
14:14 |
8.47 |
8.31 |
31.5 |
22.92 |
3.03 |
3 |
|
CF |
20220104 |
Sunny |
Moderate |
Mid-Ebb |
S |
1 |
14:14 |
8.47 |
8.28 |
31.54 |
22.81 |
2.89 |
5 |
|
CF |
20220104 |
Sunny |
Moderate |
Mid-Ebb |
M |
10.8 |
14:13 |
8.59 |
8.3 |
31.5 |
22.89 |
2.93 |
7 |
|
CF |
20220104 |
Sunny |
Moderate |
Mid-Ebb |
M |
10.8 |
14:13 |
8.45 |
8.3 |
31.44 |
22.78 |
3.01 |
4 |
|
CF |
20220104 |
Sunny |
Moderate |
Mid-Ebb |
B |
20.6 |
14:12 |
8.45 |
8.28 |
31.45 |
22.91 |
3.16 |
12 |
|
CF |
20220104 |
Sunny |
Moderate |
Mid-Ebb |
B |
20.6 |
14:12 |
8.49 |
8.29 |
31.38 |
22.78 |
2.8 |
12 |
|
CF |
20220106 |
Sunny |
Moderate |
Mid-Ebb |
S |
1 |
16:01 |
8.79 |
8.16 |
32.72 |
22.81 |
3.07 |
4 |
|
CF |
20220106 |
Sunny |
Moderate |
Mid-Ebb |
S |
1 |
16:01 |
8.62 |
8.13 |
32.68 |
22.73 |
3.01 |
3 |
|
CF |
20220106 |
Sunny |
Moderate |
Mid-Ebb |
M |
10.55 |
16:00 |
8.63 |
8.13 |
32.68 |
22.79 |
3.12 |
4 |
|
CF |
20220106 |
Sunny |
Moderate |
Mid-Ebb |
M |
10.55 |
16:00 |
8.75 |
8.15 |
32.67 |
22.83 |
3.24 |
3 |
|
CF |
20220106 |
Sunny |
Moderate |
Mid-Ebb |
B |
20.1 |
15:59 |
8.82 |
8.16 |
32.72 |
22.82 |
3.22 |
8 |
|
CF |
20220106 |
Sunny |
Moderate |
Mid-Ebb |
B |
20.1 |
15:59 |
8.69 |
8.11 |
32.73 |
22.85 |
3.62 |
8 |
|
CF |
20220108 |
Sunny |
Moderate |
Mid-Ebb |
S |
1 |
17:44 |
7.92 |
8.44 |
33.76 |
21.43 |
2.43 |
8 |
|
CF |
20220108 |
Sunny |
Moderate |
Mid-Ebb |
S |
1 |
17:44 |
7.92 |
8.46 |
33.7 |
21.47 |
2.56 |
5 |
|
Location |
Date |
Weather |
Sea Conidtion |
Tidal |
Water Level |
Depth
(m) |
Time |
DO (mg/L) |
pH |
Sal (ppt) |
Temp (�XC) |
Turbidty (NTU) |
SS
(mg/L) |
|
CF |
20220108 |
Sunny |
Moderate |
Mid-Ebb |
M |
10.15 |
17:43 |
8.01 |
8.38 |
33.71 |
21.52 |
2.9 |
4 |
|
CF |
20220108 |
Sunny |
Moderate |
Mid-Ebb |
M |
10.15 |
17:43 |
8 |
8.4 |
33.69 |
21.49 |
2.54 |
4 |
|
CF |
20220108 |
Sunny |
Moderate |
Mid-Ebb |
B |
19.3 |
17:42 |
7.87 |
8.39 |
33.79 |
21.48 |
2.57 |
6 |
|
CF |
20220108 |
Sunny |
Moderate |
Mid-Ebb |
B |
19.3 |
17:42 |
7.9 |
8.46 |
33.68 |
21.49 |
2.55 |
5 |
|
CF |
20220111 |
Sunny |
Moderate |
Mid-Ebb |
S |
1 |
14:25 |
8.96 |
8.25 |
34.32 |
20.35 |
3.06 |
3 |
|
CF |
20220111 |
Sunny |
Moderate |
Mid-Ebb |
S |
1 |
14:25 |
8.84 |
8.32 |
34.33 |
20.27 |
2.88 |
5 |
|
CF |
20220111 |
Sunny |
Moderate |
Mid-Ebb |
M |
10.15 |
14:24 |
9.01 |
8.29 |
34.28 |
20.17 |
2.43 |
4 |
|
CF |
20220111 |
Sunny |
Moderate |
Mid-Ebb |
M |
10.15 |
14:24 |
8.93 |
8.32 |
34.35 |
20.15 |
2.45 |
4 |
|
CF |
20220111 |
Sunny |
Moderate |
Mid-Ebb |
B |
19.3 |
14:23 |
9.02 |
8.38 |
34.19 |
20.25 |
2.76 |
4 |
|
CF |
20220111 |
Sunny |
Moderate |
Mid-Ebb |
B |
19.3 |
14:23 |
9.02 |
8.28 |
34.42 |
20.18 |
2.64 |
5 |
|
CF |
20220113 |
Cloudy |
Moderate |
Mid-Ebb |
S |
1 |
10:38 |
8.07 |
8.19 |
32.55 |
20.25 |
3.88 |
3 |
|
CF |
20220113 |
Cloudy |
Moderate |
Mid-Ebb |
S |
1 |
10:38 |
8.01 |
8.13 |
32.58 |
20.25 |
3.25 |
3 |
|
CF |
20220113 |
Cloudy |
Moderate |
Mid-Ebb |
M |
10.8 |
10:37 |
8.16 |
8.24 |
32.6 |
20.2 |
3.27 |
3 |
|
CF |
20220113 |
Cloudy |
Moderate |
Mid-Ebb |
M |
10.8 |
10:37 |
8.25 |
8.12 |
32.63 |
20.34 |
3.24 |
3 |
|
CF |
20220113 |
Cloudy |
Moderate |
Mid-Ebb |
B |
20.6 |
10:36 |
8.39 |
8.21 |
32.64 |
20.3 |
3.41 |
3 |
|
CF |
20220113 |
Cloudy |
Moderate |
Mid-Ebb |
B |
20.6 |
10:36 |
8.14 |
8.15 |
32.57 |
20.34 |
3.59 |
4 |
|
CF |
20220115 |
Cloudy |
Moderate |
Mid-Ebb |
S |
1 |
12:38 |
8.42 |
8.32 |
32.69 |
21.13 |
3.51 |
6 |
|
CF |
20220115 |
Cloudy |
Moderate |
Mid-Ebb |
S |
1 |
12:38 |
8.38 |
8.3 |
32.7 |
21.16 |
3.59 |
6 |
|
CF |
20220115 |
Cloudy |
Moderate |
Mid-Ebb |
M |
10.1 |
12:37 |
8.4 |
8.34 |
32.74 |
21.18 |
3.55 |
5 |
|
CF |
20220115 |
Cloudy |
Moderate |
Mid-Ebb |
M |
10.1 |
12:37 |
8.37 |
8.28 |
32.77 |
21.06 |
3.69 |
5 |
|
CF |
20220115 |
Cloudy |
Moderate |
Mid-Ebb |
B |
19.2 |
12:36 |
8.34 |
8.3 |
32.65 |
21.05 |
3.36 |
3 |
|
CF |
20220115 |
Cloudy |
Moderate |
Mid-Ebb |
B |
19.2 |
12:36 |
8.39 |
8.31 |
32.71 |
21.17 |
3.48 |
2.5 |
|
CF |
20220118 |
Cloudy |
Moderate |
Mid-Ebb |
S |
1 |
11:57 |
8.6 |
8.2 |
33.47 |
20.6 |
4.16 |
17 |
|
CF |
20220118 |
Cloudy |
Moderate |
Mid-Ebb |
S |
1 |
11:57 |
8.66 |
8.12 |
33.45 |
20.71 |
3.76 |
17 |
|
CF |
20220118 |
Cloudy |
Moderate |
Mid-Ebb |
M |
10.55 |
11:56 |
8.61 |
8.2 |
33.37 |
20.74 |
3.76 |
7 |
|
CF |
20220118 |
Cloudy |
Moderate |
Mid-Ebb |
M |
10.55 |
11:56 |
8.7 |
8.17 |
33.47 |
20.69 |
3.88 |
5 |
|
Location |
Date |
Weather |
Sea Conidtion |
Tidal |
Water Level |
Depth
(m) |
Time |
DO (mg/L) |
pH |
Sal (ppt) |
Temp (�XC) |
Turbidty (NTU) |
SS
(mg/L) |
|
CF |
20220118 |
Cloudy |
Moderate |
Mid-Ebb |
B |
20.1 |
11:55 |
8.69 |
8.13 |
33.46 |
20.64 |
3.28 |
6 |
|
CF |
20220118 |
Cloudy |
Moderate |
Mid-Ebb |
B |
20.1 |
11:55 |
8.55 |
8.14 |
33.39 |
20.56 |
3.82 |
6 |
|
CF |
20220120 |
Sunny |
Moderate |
Mid-Ebb |
S |
1 |
14:07 |
8.49 |
8.13 |
33.03 |
20.85 |
3.62 |
5 |
|
CF |
20220120 |
Sunny |
Moderate |
Mid-Ebb |
S |
1 |
14:07 |
8.42 |
8.15 |
33.05 |
20.8 |
3.92 |
6 |
|
CF |
20220120 |
Sunny |
Moderate |
Mid-Ebb |
M |
10 |
14:06 |
8.45 |
8.15 |
33.28 |
20.84 |
3.61 |
5 |
|
CF |
20220120 |
Sunny |
Moderate |
Mid-Ebb |
M |
10 |
14:06 |
8.46 |
8.14 |
33.02 |
20.83 |
3.28 |
6 |
|
CF |
20220120 |
Sunny |
Moderate |
Mid-Ebb |
B |
19 |
14:05 |
8.49 |
8.19 |
33.36 |
20.79 |
3.87 |
6 |
|
CF |
20220120 |
Sunny |
Moderate |
Mid-Ebb |
B |
19 |
14:05 |
8.47 |
8.18 |
33.13 |
20.89 |
3.99 |
8 |
|
CF |
20220122 |
Cloudy |
Moderate |
Mid-Ebb |
S |
1 |
15:43 |
8.02 |
8.3 |
32.97 |
21.11 |
3.18 |
6 |
|
CF |
20220122 |
Cloudy |
Moderate |
Mid-Ebb |
S |
1 |
15:43 |
8.01 |
8.34 |
32.84 |
21.02 |
2.95 |
5 |
|
CF |
20220122 |
Cloudy |
Moderate |
Mid-Ebb |
M |
10.45 |
15:42 |
7.99 |
8.31 |
32.85 |
21.17 |
3.36 |
7 |
|
CF |
20220122 |
Cloudy |
Moderate |
Mid-Ebb |
M |
10.45 |
15:42 |
8.05 |
8.32 |
32.92 |
21.09 |
3.92 |
5 |
|
CF |
20220122 |
Cloudy |
Moderate |
Mid-Ebb |
B |
19.9 |
15:41 |
8 |
8.29 |
32.83 |
21.11 |
3.03 |
4 |
|
CF |
20220122 |
Cloudy |
Moderate |
Mid-Ebb |
B |
19.9 |
15:41 |
8.07 |
8.27 |
32.85 |
21.08 |
3.22 |
3 |
|
CF |
20220125 |
Cloudy |
Moderate |
Mid-Ebb |
S |
1 |
18:04 |
9.26 |
8.19 |
31.83 |
20.96 |
3.3 |
2.5 |
|
CF |
20220125 |
Cloudy |
Moderate |
Mid-Ebb |
S |
1 |
18:04 |
9.35 |
8.26 |
31.82 |
20.99 |
3.17 |
2.5 |
|
CF |
20220125 |
Cloudy |
Moderate |
Mid-Ebb |
M |
10.55 |
18:03 |
9.32 |
8.26 |
31.77 |
20.96 |
3.27 |
3 |
|
CF |
20220125 |
Cloudy |
Moderate |
Mid-Ebb |
M |
10.55 |
18:03 |
9.39 |
8.27 |
31.78 |
20.92 |
3.19 |
3 |
|
CF |
20220125 |
Cloudy |
Moderate |
Mid-Ebb |
B |
20.1 |
18:02 |
9.37 |
8.25 |
31.76 |
20.93 |
2.98 |
3 |
|
CF |
20220125 |
Cloudy |
Moderate |
Mid-Ebb |
B |
20.1 |
18:02 |
9.34 |
8.24 |
31.81 |
20.94 |
3.4 |
3 |
|
CF |
20220127 |
Cloudy |
Moderate |
Mid-Ebb |
S |
1 |
10:27 |
8.77 |
8.12 |
31.1 |
21.01 |
3.93 |
8 |
|
CF |
20220127 |
Cloudy |
Moderate |
Mid-Ebb |
S |
1 |
10:27 |
8.73 |
8.2 |
31.27 |
21.17 |
3.8 |
8 |
|
CF |
20220127 |
Cloudy |
Moderate |
Mid-Ebb |
M |
9.85 |
10:26 |
8.71 |
8.1 |
31.07 |
21.01 |
4.1 |
3 |
|
CF |
20220127 |
Cloudy |
Moderate |
Mid-Ebb |
M |
9.85 |
10:26 |
8.78 |
8.2 |
31.12 |
21.17 |
3.84 |
4 |
|
CF |
20220127 |
Cloudy |
Moderate |
Mid-Ebb |
B |
18.7 |
10:25 |
8.75 |
8.11 |
31.06 |
21.09 |
4.12 |
6 |
|
CF |
20220127 |
Cloudy |
Moderate |
Mid-Ebb |
B |
18.7 |
10:25 |
8.63 |
8.1 |
31.2 |
21.12 |
3.66 |
6 |
|
Location |
Date |
Weather |
Sea Conidtion |
Tidal |
Water Level |
Depth
(m) |
Time |
DO (mg/L) |
pH |
Sal (ppt) |
Temp (�XC) |
Turbidty (NTU) |
SS
(mg/L) |
|
CF |
20220129 |
Cloudy |
Moderate |
Mid-Ebb |
S |
1 |
10:50 |
9.13 |
8.22 |
30.6 |
20.61 |
4.44 |
5 |
|
CF |
20220129 |
Cloudy |
Moderate |
Mid-Ebb |
S |
1 |
10:50 |
9.12 |
8.13 |
30.67 |
20.59 |
4.09 |
5 |
|
CF |
20220129 |
Cloudy |
Moderate |
Mid-Ebb |
M |
10.45 |
10:49 |
9.09 |
8.19 |
30.55 |
20.62 |
4.69 |
4 |
|
CF |
20220129 |
Cloudy |
Moderate |
Mid-Ebb |
M |
10.45 |
10:49 |
9.14 |
8.24 |
30.57 |
20.55 |
4.1 |
4 |
|
CF |
20220129 |
Cloudy |
Moderate |
Mid-Ebb |
B |
19.9 |
10:48 |
9.12 |
8.16 |
30.62 |
20.65 |
3.83 |
4 |
|
CF |
20220129 |
Cloudy |
Moderate |
Mid-Ebb |
B |
19.9 |
10:48 |
9.08 |
8.22 |
30.63 |
20.52 |
4.07 |
2.5 |
|
CF |
20220131 |
Cloudy |
Moderate |
Mid-Ebb |
S |
1 |
12:46 |
8.92 |
8.07 |
33.24 |
20.26 |
2.41 |
5 |
|
CF |
20220131 |
Cloudy |
Moderate |
Mid-Ebb |
S |
1 |
12:46 |
8.89 |
8.12 |
33.16 |
20.22 |
2.6 |
4 |
|
CF |
20220131 |
Cloudy |
Moderate |
Mid-Ebb |
M |
9.85 |
12:45 |
8.99 |
8.03 |
33.27 |
20.25 |
2.76 |
3 |
|
CF |
20220131 |
Cloudy |
Moderate |
Mid-Ebb |
M |
9.85 |
12:45 |
8.94 |
8.08 |
33.17 |
20.27 |
2.34 |
4 |
|
CF |
20220131 |
Cloudy |
Moderate |
Mid-Ebb |
B |
18.7 |
12:44 |
8.89 |
8.11 |
33.13 |
20.23 |
2.8 |
3 |
|
CF |
20220131 |
Cloudy |
Moderate |
Mid-Ebb |
B |
18.7 |
12:44 |
8.9 |
8.13 |
33.11 |
20.28 |
2.77 |
3 |
|
WSR01 |
20220101 |
Cloudy |
Moderate |
Mid-Ebb |
S |
1 |
11:30 |
8.52 |
8.28 |
32.73 |
22.25 |
2.42 |
3 |
|
WSR01 |
20220101 |
Cloudy |
Moderate |
Mid-Ebb |
S |
1 |
11:30 |
8.66 |
8.28 |
32.72 |
22.18 |
2.46 |
5 |
|
WSR01 |
20220101 |
Cloudy |
Moderate |
Mid-Ebb |
M |
4.35 |
11:29 |
8.7 |
8.34 |
32.86 |
22.23 |
2.19 |
5 |
|
WSR01 |
20220101 |
Cloudy |
Moderate |
Mid-Ebb |
M |
4.35 |
11:29 |
8.71 |
8.29 |
32.87 |
22.11 |
2.22 |
9 |
|
WSR01 |
20220101 |
Cloudy |
Moderate |
Mid-Ebb |
B |
7.7 |
11:28 |
8.51 |
8.33 |
32.78 |
22.09 |
1.82 |
7 |
|
WSR01 |
20220101 |
Cloudy |
Moderate |
Mid-Ebb |
B |
7.7 |
11:28 |
8.75 |
8.33 |
32.75 |
22.08 |
1.6 |
9 |
|
WSR01 |
20220104 |
Sunny |
Moderate |
Mid-Ebb |
S |
1 |
13:51 |
8.83 |
8.28 |
32.05 |
22.46 |
2.34 |
7 |
|
WSR01 |
20220104 |
Sunny |
Moderate |
Mid-Ebb |
S |
1 |
13:51 |
8.83 |
8.34 |
32.19 |
22.38 |
2.65 |
5 |
|
WSR01 |
20220104 |
Sunny |
Moderate |
Mid-Ebb |
M |
4.3 |
13:50 |
8.89 |
8.28 |
32.26 |
22.47 |
2.28 |
5 |
|
WSR01 |
20220104 |
Sunny |
Moderate |
Mid-Ebb |
M |
4.3 |
13:50 |
8.91 |
8.33 |
32.31 |
22.46 |
2.06 |
5 |
|
WSR01 |
20220104 |
Sunny |
Moderate |
Mid-Ebb |
B |
7.6 |
13:49 |
8.71 |
8.33 |
32.28 |
22.35 |
1.94 |
6 |
|
WSR01 |
20220104 |
Sunny |
Moderate |
Mid-Ebb |
B |
7.6 |
13:49 |
8.8 |
8.29 |
32.24 |
22.42 |
2.32 |
5 |
|
WSR01 |
20220106 |
Sunny |
Moderate |
Mid-Ebb |
S |
1 |
15:37 |
8.1 |
8.36 |
32.85 |
22.94 |
3.93 |
5 |
|
WSR01 |
20220106 |
Sunny |
Moderate |
Mid-Ebb |
S |
1 |
15:37 |
8.13 |
8.41 |
32.9 |
22.89 |
4.01 |
3 |
|
Location |
Date |
Weather |
Sea Conidtion |
Tidal |
Water Level |
Depth
(m) |
Time |
DO (mg/L) |
pH |
Sal (ppt) |
Temp (�XC) |
Turbidty (NTU) |
SS
(mg/L) |
|
WSR01 |
20220106 |
Sunny |
Moderate |
Mid-Ebb |
M |
4.5 |
15:36 |
8.11 |
8.35 |
32.97 |
22.93 |
3.88 |
5 |
|
WSR01 |
20220106 |
Sunny |
Moderate |
Mid-Ebb |
M |
4.5 |
15:36 |
8.04 |
8.37 |
32.88 |
22.91 |
3.53 |
5 |
|
WSR01 |
20220106 |
Sunny |
Moderate |
Mid-Ebb |
B |
8 |
15:35 |
8.17 |
8.36 |
32.81 |
22.91 |
3.27 |
7 |
|
WSR01 |
20220106 |
Sunny |
Moderate |
Mid-Ebb |
B |
8 |
15:35 |
8.23 |
8.39 |
32.89 |
22.97 |
3.28 |
7 |
|
WSR01 |
20220108 |
Sunny |
Moderate |
Mid-Ebb |
S |
1 |
17:22 |
8.24 |
8.25 |
33.89 |
21.74 |
2.48 |
6 |
|
WSR01 |
20220108 |
Sunny |
Moderate |
Mid-Ebb |
S |
1 |
17:22 |
8.26 |
8.23 |
33.91 |
21.78 |
2.76 |
5 |
|
WSR01 |
20220108 |
Sunny |
Moderate |
Mid-Ebb |
M |
4.35 |
17:21 |
8.27 |
8.26 |
33.89 |
21.77 |
2.66 |
5 |
|
WSR01 |
20220108 |
Sunny |
Moderate |
Mid-Ebb |
M |
4.35 |
17:21 |
8.31 |
8.27 |
33.94 |
21.8 |
2.29 |
6 |
|
WSR01 |
20220108 |
Sunny |
Moderate |
Mid-Ebb |
B |
7.7 |
17:20 |
8.15 |
8.23 |
33.97 |
21.75 |
2.56 |
5 |
|
WSR01 |
20220108 |
Sunny |
Moderate |
Mid-Ebb |
B |
7.7 |
17:20 |
8.27 |
8.29 |
34.03 |
21.81 |
2.34 |
6 |
|
WSR01 |
20220111 |
Sunny |
Moderate |
Mid-Ebb |
S |
1 |
13:57 |
9.11 |
8.37 |
34.96 |
19.93 |
2.25 |
6 |
|
WSR01 |
20220111 |
Sunny |
Moderate |
Mid-Ebb |
S |
1 |
13:57 |
9.22 |
8.38 |
34.9 |
20.03 |
1.95 |
4 |
|
WSR01 |
20220111 |
Sunny |
Moderate |
Mid-Ebb |
M |
4.55 |
13:56 |
9.29 |
8.35 |
35.14 |
19.95 |
2.27 |
3 |
|
WSR01 |
20220111 |
Sunny |
Moderate |
Mid-Ebb |
M |
4.55 |
13:56 |
9.3 |
8.35 |
35.13 |
19.81 |
2.54 |
4 |
|
WSR01 |
20220111 |
Sunny |
Moderate |
Mid-Ebb |
B |
8.1 |
13:55 |
9.03 |
8.33 |
35.13 |
19.89 |
2.48 |
3 |
|
WSR01 |
20220111 |
Sunny |
Moderate |
Mid-Ebb |
B |
8.1 |
13:55 |
9.26 |
8.36 |
34.95 |
19.82 |
2.76 |
4 |
|
WSR01 |
20220113 |
Cloudy |
Moderate |
Mid-Ebb |
S |
1 |
10:05 |
8.58 |
8.14 |
32.81 |
20.35 |
3.14 |
3 |
|
WSR01 |
20220113 |
Cloudy |
Moderate |
Mid-Ebb |
S |
1 |
10:05 |
8.56 |
8.15 |
32.79 |
20.3 |
2.87 |
3 |
|
WSR01 |
20220113 |
Cloudy |
Moderate |
Mid-Ebb |
M |
4.7 |
10:04 |
8.53 |
8.26 |
32.79 |
20.3 |
2.59 |
4 |
|
WSR01 |
20220113 |
Cloudy |
Moderate |
Mid-Ebb |
M |
4.7 |
10:04 |
8.56 |
8.2 |
32.72 |
20.5 |
2.99 |
2.5 |
|
WSR01 |
20220113 |
Cloudy |
Moderate |
Mid-Ebb |
B |
8.4 |
10:03 |
8.58 |
8.2 |
32.74 |
20.38 |
2.93 |
4 |
|
WSR01 |
20220113 |
Cloudy |
Moderate |
Mid-Ebb |
B |
8.4 |
10:03 |
8.52 |
8.2 |
32.7 |
20.32 |
2.82 |
4 |
|
WSR01 |
20220115 |
Cloudy |
Moderate |
Mid-Ebb |
S |
1 |
12:15 |
8.2 |
8.28 |
33.13 |
21.23 |
2.99 |
2.5 |
|
WSR01 |
20220115 |
Cloudy |
Moderate |
Mid-Ebb |
S |
1 |
12:15 |
8.31 |
8.24 |
33.18 |
21.24 |
3.07 |
2.5 |
|
WSR01 |
20220115 |
Cloudy |
Moderate |
Mid-Ebb |
M |
4.25 |
12:14 |
8.25 |
8.2 |
33.11 |
21.1 |
2.75 |
6 |
|
WSR01 |
20220115 |
Cloudy |
Moderate |
Mid-Ebb |
M |
4.25 |
12:14 |
8.36 |
8.2 |
33.21 |
21.17 |
2.58 |
6 |
|
Location |
Date |
Weather |
Sea Conidtion |
Tidal |
Water Level |
Depth
(m) |
Time |
DO (mg/L) |
pH |
Sal (ppt) |
Temp (�XC) |
Turbidty (NTU) |
SS
(mg/L) |
|
WSR01 |
20220115 |
Cloudy |
Moderate |
Mid-Ebb |
B |
7.5 |
12:13 |
8.33 |
8.24 |
33.2 |
21.14 |
2.66 |
7 |
|
WSR01 |
20220115 |
Cloudy |
Moderate |
Mid-Ebb |
B |
7.5 |
12:13 |
8.21 |
8.2 |
33.11 |
21.21 |
2.71 |
6 |
|
WSR01 |
20220118 |
Cloudy |
Moderate |
Mid-Ebb |
S |
1 |
11:37 |
8.49 |
8.35 |
33.71 |
21 |
3.79 |
7 |
|
WSR01 |
20220118 |
Cloudy |
Moderate |
Mid-Ebb |
S |
1 |
11:37 |
8.5 |
8.29 |
33.73 |
20.97 |
3.69 |
4 |
|
WSR01 |
20220118 |
Cloudy |
Moderate |
Mid-Ebb |
M |
4.55 |
11:36 |
8.4 |
8.28 |
33.58 |
21.06 |
3.96 |
13 |
|
WSR01 |
20220118 |
Cloudy |
Moderate |
Mid-Ebb |
M |
4.55 |
11:36 |
8.41 |
8.29 |
33.66 |
20.96 |
3.53 |
13 |
|
WSR01 |
20220118 |
Cloudy |
Moderate |
Mid-Ebb |
B |
8.1 |
11:35 |
8.49 |
8.31 |
33.67 |
20.89 |
3.94 |
6 |
|
WSR01 |
20220118 |
Cloudy |
Moderate |
Mid-Ebb |
B |
8.1 |
11:35 |
8.39 |
8.26 |
33.7 |
21 |
3.54 |
8 |
|
WSR01 |
20220120 |
Sunny |
Moderate |
Mid-Ebb |
S |
1 |
13:47 |
8.18 |
8.23 |
33.04 |
21 |
4.08 |
6 |
|
WSR01 |
20220120 |
Sunny |
Moderate |
Mid-Ebb |
S |
1 |
13:47 |
8.17 |
8.3 |
33.07 |
21.01 |
3.85 |
5 |
|
WSR01 |
20220120 |
Sunny |
Moderate |
Mid-Ebb |
M |
4.6 |
13:46 |
8.22 |
8.23 |
33.02 |
21.01 |
3.13 |
5 |
|
WSR01 |
20220120 |
Sunny |
Moderate |
Mid-Ebb |
M |
4.6 |
13:46 |
8.16 |
8.28 |
33.04 |
20.97 |
3.64 |
6 |
|
WSR01 |
20220120 |
Sunny |
Moderate |
Mid-Ebb |
B |
8.2 |
13:45 |
8.21 |
8.31 |
33.07 |
20.94 |
2.97 |
5 |
|
WSR01 |
20220120 |
Sunny |
Moderate |
Mid-Ebb |
B |
8.2 |
13:45 |
8.27 |
8.24 |
32.81 |
20.94 |
3.01 |
6 |
|
WSR01 |
20220122 |
Cloudy |
Moderate |
Mid-Ebb |
S |
1 |
15:23 |
8.62 |
8.42 |
32.88 |
21.65 |
2.67 |
7 |
|
WSR01 |
20220122 |
Cloudy |
Moderate |
Mid-Ebb |
S |
1 |
15:23 |
8.61 |
8.35 |
32.76 |
21.68 |
2.92 |
8 |
|
WSR01 |
20220122 |
Cloudy |
Moderate |
Mid-Ebb |
M |
4.55 |
15:22 |
8.67 |
8.41 |
32.87 |
21.56 |
2.04 |
3 |
|
WSR01 |
20220122 |
Cloudy |
Moderate |
Mid-Ebb |
M |
4.55 |
15:22 |
8.64 |
8.33 |
32.72 |
21.57 |
2.38 |
3 |
|
WSR01 |
20220122 |
Cloudy |
Moderate |
Mid-Ebb |
B |
8.1 |
15:21 |
8.7 |
8.36 |
32.77 |
21.73 |
1.81 |
4 |
|
WSR01 |
20220122 |
Cloudy |
Moderate |
Mid-Ebb |
B |
8.1 |
15:21 |
8.62 |
8.41 |
32.7 |
21.73 |
2.03 |
4 |
|
WSR01 |
20220125 |
Cloudy |
Moderate |
Mid-Ebb |
S |
1 |
17:43 |
9.17 |
8.19 |
31.71 |
21.1 |
2.84 |
3 |
|
WSR01 |
20220125 |
Cloudy |
Moderate |
Mid-Ebb |
S |
1 |
17:43 |
9.07 |
8.26 |
31.73 |
20.97 |
2.99 |
2.5 |
|
WSR01 |
20220125 |
Cloudy |
Moderate |
Mid-Ebb |
M |
4.45 |
17:42 |
9.05 |
8.28 |
31.64 |
21.09 |
3.3 |
2.5 |
|
WSR01 |
20220125 |
Cloudy |
Moderate |
Mid-Ebb |
M |
4.45 |
17:42 |
9.15 |
8.17 |
31.59 |
21.03 |
2.89 |
2.5 |
|
WSR01 |
20220125 |
Cloudy |
Moderate |
Mid-Ebb |
B |
7.9 |
17:41 |
9.18 |
8.24 |
31.77 |
21.08 |
2.55 |
2.5 |
|
WSR01 |
20220125 |
Cloudy |
Moderate |
Mid-Ebb |
B |
7.9 |
17:41 |
9.06 |
8.24 |
31.66 |
21.01 |
2.99 |
3 |
|
Location |
Date |
Weather |
Sea Conidtion |
Tidal |
Water Level |
Depth
(m) |
Time |
DO (mg/L) |
pH |
Sal (ppt) |
Temp (�XC) |
Turbidty (NTU) |
SS
(mg/L) |
|
WSR01 |
20220127 |
Cloudy |
Moderate |
Mid-Ebb |
S |
1 |
10:06 |
8.83 |
8.13 |
31.61 |
20.39 |
2.64 |
11 |
|
WSR01 |
20220127 |
Cloudy |
Moderate |
Mid-Ebb |
S |
1 |
10:06 |
8.81 |
8.15 |
31.65 |
20.38 |
2.84 |
11 |
|
WSR01 |
20220127 |
Cloudy |
Moderate |
Mid-Ebb |
M |
4.4 |
10:05 |
8.69 |
8.07 |
31.79 |
20.43 |
2.61 |
8 |
|
WSR01 |
20220127 |
Cloudy |
Moderate |
Mid-Ebb |
M |
4.4 |
10:05 |
8.87 |
8.1 |
31.64 |
20.51 |
2.77 |
8 |
|
WSR01 |
20220127 |
Cloudy |
Moderate |
Mid-Ebb |
B |
7.8 |
10:04 |
8.81 |
8.1 |
31.78 |
20.38 |
2.28 |
12 |
|
WSR01 |
20220127 |
Cloudy |
Moderate |
Mid-Ebb |
B |
7.8 |
10:04 |
8.88 |
8.09 |
31.79 |
20.35 |
2.47 |
12 |
|
WSR01 |
20220129 |
Cloudy |
Moderate |
Mid-Ebb |
S |
1 |
10:27 |
9.31 |
8.07 |
30.3 |
20.68 |
3.49 |
5 |
|
WSR01 |
20220129 |
Cloudy |
Moderate |
Mid-Ebb |
S |
1 |
10:27 |
9.32 |
8.12 |
30.38 |
20.62 |
3.2 |
4 |
|
WSR01 |
20220129 |
Cloudy |
Moderate |
Mid-Ebb |
M |
4.25 |
10:26 |
9.2 |
8.11 |
30.32 |
20.6 |
2.78 |
5 |
|
WSR01 |
20220129 |
Cloudy |
Moderate |
Mid-Ebb |
M |
4.25 |
10:26 |
9.32 |
8.11 |
30.14 |
20.66 |
2.66 |
4 |
|
WSR01 |
20220129 |
Cloudy |
Moderate |
Mid-Ebb |
B |
7.5 |
10:25 |
9.25 |
8.09 |
30.29 |
20.75 |
3.06 |
4 |
|
WSR01 |
20220129 |
Cloudy |
Moderate |
Mid-Ebb |
B |
7.5 |
10:25 |
9.29 |
8.11 |
30.33 |
20.67 |
2.86 |
2.5 |
|
WSR01 |
20220131 |
Cloudy |
Moderate |
Mid-Ebb |
S |
1 |
12:23 |
8.18 |
7.94 |
34.04 |
20.36 |
2.95 |
4 |
|
WSR01 |
20220131 |
Cloudy |
Moderate |
Mid-Ebb |
S |
1 |
12:23 |
8.18 |
7.93 |
33.99 |
20.42 |
2.77 |
5 |
|
WSR01 |
20220131 |
Cloudy |
Moderate |
Mid-Ebb |
M |
4.3 |
12:22 |
8.12 |
7.95 |
34.05 |
20.3 |
2.46 |
4 |
|
WSR01 |
20220131 |
Cloudy |
Moderate |
Mid-Ebb |
M |
4.3 |
12:22 |
8.25 |
7.98 |
34.07 |
20.34 |
2.88 |
4 |
|
WSR01 |
20220131 |
Cloudy |
Moderate |
Mid-Ebb |
B |
7.6 |
12:21 |
8.19 |
8.01 |
33.88 |
20.38 |
2.63 |
4 |
|
WSR01 |
20220131 |
Cloudy |
Moderate |
Mid-Ebb |
B |
7.6 |
12:21 |
8.11 |
7.98 |
33.99 |
20.4 |
2.66 |
4 |
|
WSR02 |
20220101 |
Cloudy |
Moderate |
Mid-Ebb |
S |
1 |
11:12 |
8.07 |
8.3 |
33.31 |
22.19 |
2.31 |
7 |
|
WSR02 |
20220101 |
Cloudy |
Moderate |
Mid-Ebb |
S |
1 |
11:12 |
8.26 |
8.31 |
33.29 |
22.27 |
2.68 |
4 |
|
WSR02 |
20220101 |
Cloudy |
Moderate |
Mid-Ebb |
M |
4.65 |
11:11 |
8.15 |
8.3 |
33.26 |
22.17 |
2.15 |
6 |
|
WSR02 |
20220101 |
Cloudy |
Moderate |
Mid-Ebb |
M |
4.65 |
11:11 |
8.18 |
8.27 |
33.2 |
22.1 |
2.07 |
6 |
|
WSR02 |
20220101 |
Cloudy |
Moderate |
Mid-Ebb |
B |
8.3 |
11:10 |
8.22 |
8.3 |
33.21 |
22.2 |
1.85 |
3 |
|
WSR02 |
20220101 |
Cloudy |
Moderate |
Mid-Ebb |
B |
8.3 |
11:10 |
8.07 |
8.3 |
33.22 |
22.25 |
1.99 |
2.5 |
|
WSR02 |
20220104 |
Sunny |
Moderate |
Mid-Ebb |
S |
1 |
13:33 |
9.15 |
8.42 |
31.74 |
22.5 |
2.16 |
4 |
|
WSR02 |
20220104 |
Sunny |
Moderate |
Mid-Ebb |
S |
1 |
13:33 |
9.03 |
8.47 |
31.63 |
22.48 |
2.4 |
3 |
|
Location |
Date |
Weather |
Sea Conidtion |
Tidal |
Water Level |
Depth
(m) |
Time |
DO (mg/L) |
pH |
Sal (ppt) |
Temp (�XC) |
Turbidty (NTU) |
SS
(mg/L) |
|
WSR02 |
20220104 |
Sunny |
Moderate |
Mid-Ebb |
M |
4.85 |
13:32 |
9.19 |
8.46 |
31.69 |
22.5 |
2.14 |
4 |
|
WSR02 |
20220104 |
Sunny |
Moderate |
Mid-Ebb |
M |
4.85 |
13:32 |
9.24 |
8.44 |
31.74 |
22.43 |
1.84 |
2.5 |
|
WSR02 |
20220104 |
Sunny |
Moderate |
Mid-Ebb |
B |
8.7 |
13:31 |
9.2 |
8.43 |
31.69 |
22.47 |
1.81 |
4 |
|
WSR02 |
20220104 |
Sunny |
Moderate |
Mid-Ebb |
B |
8.7 |
13:31 |
9.06 |
8.45 |
31.75 |
22.45 |
1.94 |
4 |
|
WSR02 |
20220106 |
Sunny |
Moderate |
Mid-Ebb |
S |
1 |
15:19 |
8.64 |
8.29 |
32.59 |
22.86 |
3.21 |
5 |
|
WSR02 |
20220106 |
Sunny |
Moderate |
Mid-Ebb |
S |
1 |
15:19 |
8.62 |
8.34 |
32.55 |
22.87 |
3.48 |
3 |
|
WSR02 |
20220106 |
Sunny |
Moderate |
Mid-Ebb |
M |
4.65 |
15:18 |
8.71 |
8.32 |
32.44 |
22.83 |
3.15 |
5 |
|
WSR02 |
20220106 |
Sunny |
Moderate |
Mid-Ebb |
M |
4.65 |
15:18 |
8.78 |
8.34 |
32.48 |
22.85 |
3.6 |
5 |
|
WSR02 |
20220106 |
Sunny |
Moderate |
Mid-Ebb |
B |
8.3 |
15:17 |
8.74 |
8.34 |
32.5 |
22.81 |
3.42 |
4 |
|
WSR02 |
20220106 |
Sunny |
Moderate |
Mid-Ebb |
B |
8.3 |
15:17 |
8.66 |
8.3 |
32.61 |
22.81 |
3.33 |
3 |
|
WSR02 |
20220108 |
Sunny |
Moderate |
Mid-Ebb |
S |
1 |
17:04 |
8.9 |
8.22 |
33.77 |
21.57 |
2.98 |
6 |
|
WSR02 |
20220108 |
Sunny |
Moderate |
Mid-Ebb |
S |
1 |
17:04 |
8.9 |
8.3 |
33.89 |
21.63 |
2.84 |
8 |
|
WSR02 |
20220108 |
Sunny |
Moderate |
Mid-Ebb |
M |
4.95 |
17:03 |
8.89 |
8.21 |
33.93 |
21.63 |
2.53 |
4 |
|
WSR02 |
20220108 |
Sunny |
Moderate |
Mid-Ebb |
M |
4.95 |
17:03 |
8.99 |
8.27 |
33.85 |
21.66 |
2.82 |
3 |
|
WSR02 |
20220108 |
Sunny |
Moderate |
Mid-Ebb |
B |
8.9 |
17:02 |
8.92 |
8.27 |
33.81 |
21.64 |
2.24 |
6 |
|
WSR02 |
20220108 |
Sunny |
Moderate |
Mid-Ebb |
B |
8.9 |
17:02 |
8.88 |
8.3 |
33.93 |
21.6 |
2.15 |
7 |
|
WSR02 |
20220111 |
Sunny |
Moderate |
Mid-Ebb |
S |
1 |
13:42 |
8.58 |
8.36 |
34.56 |
20.08 |
1.67 |
4 |
|
WSR02 |
20220111 |
Sunny |
Moderate |
Mid-Ebb |
S |
1 |
13:42 |
8.84 |
8.31 |
34.36 |
20.24 |
1.99 |
3 |
|
WSR02 |
20220111 |
Sunny |
Moderate |
Mid-Ebb |
M |
4.85 |
13:41 |
8.7 |
8.35 |
34.6 |
20.34 |
2.09 |
3 |
|
WSR02 |
20220111 |
Sunny |
Moderate |
Mid-Ebb |
M |
4.85 |
13:41 |
8.74 |
8.33 |
34.55 |
20.28 |
2.16 |
3 |
|
WSR02 |
20220111 |
Sunny |
Moderate |
Mid-Ebb |
B |
8.7 |
13:40 |
8.68 |
8.26 |
34.44 |
20.21 |
1.76 |
5 |
|
WSR02 |
20220111 |
Sunny |
Moderate |
Mid-Ebb |
B |
8.7 |
13:40 |
8.8 |
8.33 |
34.55 |
20.3 |
1.48 |
6 |
|
WSR02 |
20220113 |
Cloudy |
Moderate |
Mid-Ebb |
S |
1 |
9:48 |
8.84 |
8.22 |
33.29 |
20.32 |
3.05 |
2.5 |
|
WSR02 |
20220113 |
Cloudy |
Moderate |
Mid-Ebb |
S |
1 |
9:48 |
8.88 |
8.25 |
33.32 |
20.37 |
2.68 |
2.5 |
|
WSR02 |
20220113 |
Cloudy |
Moderate |
Mid-Ebb |
M |
4.85 |
9:47 |
8.78 |
8.23 |
33.28 |
20.25 |
2.41 |
8 |
|
WSR02 |
20220113 |
Cloudy |
Moderate |
Mid-Ebb |
M |
4.85 |
9:47 |
8.81 |
8.24 |
33.25 |
20.21 |
2.83 |
8 |
|
Location |
Date |
Weather |
Sea Conidtion |
Tidal |
Water Level |
Depth
(m) |
Time |
DO (mg/L) |
pH |
Sal (ppt) |
Temp (�XC) |
Turbidty (NTU) |
SS
(mg/L) |
|
WSR02 |
20220113 |
Cloudy |
Moderate |
Mid-Ebb |
B |
8.7 |
9:46 |
8.76 |
8.19 |
33.32 |
20.24 |
2.12 |
3 |
|
WSR02 |
20220113 |
Cloudy |
Moderate |
Mid-Ebb |
B |
8.7 |
9:46 |
8.83 |
8.21 |
33.29 |
20.27 |
1.98 |
3 |
|
WSR02 |
20220115 |
Cloudy |
Moderate |
Mid-Ebb |
S |
1 |
11:57 |
8.9 |
8.22 |
33.17 |
20.38 |
2.25 |
6 |
|
WSR02 |
20220115 |
Cloudy |
Moderate |
Mid-Ebb |
S |
1 |
11:57 |
8.95 |
8.27 |
33.16 |
20.38 |
2.11 |
4 |
|
WSR02 |
20220115 |
Cloudy |
Moderate |
Mid-Ebb |
M |
4.5 |
11:56 |
8.9 |
8.24 |
33.21 |
20.35 |
2.54 |
2.5 |
|
WSR02 |
20220115 |
Cloudy |
Moderate |
Mid-Ebb |
M |
4.5 |
11:56 |
8.86 |
8.24 |
33.19 |
20.44 |
2.49 |
2.5 |
|
WSR02 |
20220115 |
Cloudy |
Moderate |
Mid-Ebb |
B |
8 |
11:55 |
8.83 |
8.28 |
33.18 |
20.47 |
2.52 |
5 |
|
WSR02 |
20220115 |
Cloudy |
Moderate |
Mid-Ebb |
B |
8 |
11:55 |
8.94 |
8.22 |
33.22 |
20.41 |
2.89 |
5 |
|
WSR02 |
20220118 |
Cloudy |
Moderate |
Mid-Ebb |
S |
1 |
11:21 |
9.08 |
8.06 |
33.35 |
20.73 |
2.3 |
4 |
|
WSR02 |
20220118 |
Cloudy |
Moderate |
Mid-Ebb |
S |
1 |
11:21 |
9.12 |
8.09 |
33.35 |
20.73 |
2.41 |
5 |
|
WSR02 |
20220118 |
Cloudy |
Moderate |
Mid-Ebb |
M |
4.75 |
11:20 |
9.05 |
8.03 |
33.3 |
20.91 |
2.35 |
2.5 |
|
WSR02 |
20220118 |
Cloudy |
Moderate |
Mid-Ebb |
M |
4.75 |
11:20 |
9.05 |
8.04 |
33.33 |
20.91 |
2.22 |
3 |
|
WSR02 |
20220118 |
Cloudy |
Moderate |
Mid-Ebb |
B |
8.5 |
11:19 |
9.04 |
8.08 |
33.27 |
20.85 |
2.52 |
2.5 |
|
WSR02 |
20220118 |
Cloudy |
Moderate |
Mid-Ebb |
B |
8.5 |
11:19 |
9.14 |
8.12 |
33.41 |
20.87 |
2.17 |
2.5 |
|
WSR02 |
20220120 |
Sunny |
Moderate |
Mid-Ebb |
S |
1 |
13:32 |
8.09 |
8.3 |
32.97 |
21.01 |
3.21 |
6 |
|
WSR02 |
20220120 |
Sunny |
Moderate |
Mid-Ebb |
S |
1 |
13:32 |
8 |
8.29 |
32.98 |
21.01 |
3.79 |
6 |
|
WSR02 |
20220120 |
Sunny |
Moderate |
Mid-Ebb |
M |
4.6 |
13:31 |
8.04 |
8.32 |
32.91 |
20.98 |
3.51 |
7 |
|
WSR02 |
20220120 |
Sunny |
Moderate |
Mid-Ebb |
M |
4.6 |
13:31 |
8.04 |
8.26 |
33.19 |
20.91 |
3.14 |
5 |
|
WSR02 |
20220120 |
Sunny |
Moderate |
Mid-Ebb |
B |
8.2 |
13:30 |
8.11 |
8.28 |
33.1 |
21.01 |
3.42 |
7 |
|
WSR02 |
20220120 |
Sunny |
Moderate |
Mid-Ebb |
B |
8.2 |
13:30 |
8.1 |
8.32 |
33.16 |
20.94 |
2.87 |
5 |
|
WSR02 |
20220122 |
Cloudy |
Moderate |
Mid-Ebb |
S |
1 |
15:06 |
8.92 |
8.37 |
32.98 |
20.92 |
2.45 |
4 |
|
WSR02 |
20220122 |
Cloudy |
Moderate |
Mid-Ebb |
S |
1 |
15:06 |
8.84 |
8.36 |
33.03 |
21 |
2.77 |
5 |
|
WSR02 |
20220122 |
Cloudy |
Moderate |
Mid-Ebb |
M |
4.7 |
15:05 |
8.88 |
8.35 |
32.93 |
21.01 |
2.21 |
5 |
|
WSR02 |
20220122 |
Cloudy |
Moderate |
Mid-Ebb |
M |
4.7 |
15:05 |
8.87 |
8.36 |
32.93 |
20.93 |
2.25 |
7 |
|
WSR02 |
20220122 |
Cloudy |
Moderate |
Mid-Ebb |
B |
8.4 |
15:04 |
8.85 |
8.34 |
33.09 |
21.01 |
2.12 |
4 |
|
WSR02 |
20220122 |
Cloudy |
Moderate |
Mid-Ebb |
B |
8.4 |
15:04 |
8.89 |
8.4 |
33.03 |
21.04 |
1.85 |
5 |
|
Location |
Date |
Weather |
Sea Conidtion |
Tidal |
Water Level |
Depth
(m) |
Time |
DO (mg/L) |
pH |
Sal (ppt) |
Temp (�XC) |
Turbidty (NTU) |
SS
(mg/L) |
|
WSR02 |
20220125 |
Cloudy |
Moderate |
Mid-Ebb |
S |
1 |
17:25 |
8.8 |
8.18 |
31.97 |
21.01 |
2.51 |
4 |
|
WSR02 |
20220125 |
Cloudy |
Moderate |
Mid-Ebb |
S |
1 |
17:25 |
8.84 |
8.29 |
31.87 |
20.98 |
2.18 |
3 |
|
WSR02 |
20220125 |
Cloudy |
Moderate |
Mid-Ebb |
M |
4.8 |
17:24 |
8.88 |
8.15 |
31.86 |
21.09 |
2.15 |
3 |
|
WSR02 |
20220125 |
Cloudy |
Moderate |
Mid-Ebb |
M |
4.8 |
17:24 |
8.76 |
8.23 |
31.86 |
21.01 |
2.43 |
4 |
|
WSR02 |
20220125 |
Cloudy |
Moderate |
Mid-Ebb |
B |
8.6 |
17:23 |
8.9 |
8.23 |
31.97 |
21.07 |
2.06 |
5 |
|
WSR02 |
20220125 |
Cloudy |
Moderate |
Mid-Ebb |
B |
8.6 |
17:23 |
8.8 |
8.15 |
31.93 |
20.99 |
2.28 |
4 |
|
WSR02 |
20220127 |
Cloudy |
Moderate |
Mid-Ebb |
S |
1 |
9:50 |
8.17 |
8.13 |
31.33 |
20.69 |
2.51 |
6 |
|
WSR02 |
20220127 |
Cloudy |
Moderate |
Mid-Ebb |
S |
1 |
9:50 |
8.19 |
8.16 |
31.42 |
20.66 |
2.81 |
5 |
|
WSR02 |
20220127 |
Cloudy |
Moderate |
Mid-Ebb |
M |
4.7 |
9:49 |
8.2 |
8.19 |
31.41 |
20.81 |
1.8 |
2.5 |
|
WSR02 |
20220127 |
Cloudy |
Moderate |
Mid-Ebb |
M |
4.7 |
9:49 |
8.25 |
8.18 |
31.33 |
20.65 |
1.92 |
3 |
|
WSR02 |
20220127 |
Cloudy |
Moderate |
Mid-Ebb |
B |
8.4 |
9:48 |
8.23 |
8.17 |
31.48 |
20.66 |
1.88 |
6 |
|
WSR02 |
20220127 |
Cloudy |
Moderate |
Mid-Ebb |
B |
8.4 |
9:48 |
8.15 |
8.11 |
31.39 |
20.66 |
2.02 |
5 |
|
WSR02 |
20220129 |
Cloudy |
Moderate |
Mid-Ebb |
S |
1 |
10:08 |
8.86 |
8.24 |
30.64 |
20.43 |
3.4 |
4 |
|
WSR02 |
20220129 |
Cloudy |
Moderate |
Mid-Ebb |
S |
1 |
10:08 |
8.86 |
8.28 |
30.54 |
20.42 |
3.14 |
5 |
|
WSR02 |
20220129 |
Cloudy |
Moderate |
Mid-Ebb |
M |
4.8 |
10:07 |
8.94 |
8.21 |
30.64 |
20.39 |
2.82 |
4 |
|
WSR02 |
20220129 |
Cloudy |
Moderate |
Mid-Ebb |
M |
4.8 |
10:07 |
8.98 |
8.24 |
30.61 |
20.53 |
2.61 |
3 |
|
WSR02 |
20220129 |
Cloudy |
Moderate |
Mid-Ebb |
B |
8.6 |
10:06 |
8.94 |
8.28 |
30.55 |
20.48 |
2.38 |
6 |
|
WSR02 |
20220129 |
Cloudy |
Moderate |
Mid-Ebb |
B |
8.6 |
10:06 |
8.92 |
8.23 |
30.55 |
20.52 |
2.65 |
3 |
|
WSR02 |
20220131 |
Cloudy |
Moderate |
Mid-Ebb |
S |
1 |
12:06 |
8.75 |
8.02 |
33.14 |
20.16 |
1.97 |
4 |
|
WSR02 |
20220131 |
Cloudy |
Moderate |
Mid-Ebb |
S |
1 |
12:06 |
8.72 |
8.1 |
33.14 |
20.14 |
1.92 |
6 |
|
WSR02 |
20220131 |
Cloudy |
Moderate |
Mid-Ebb |
M |
4.8 |
12:05 |
8.62 |
8.08 |
33.22 |
19.77 |
1.96 |
5 |
|
WSR02 |
20220131 |
Cloudy |
Moderate |
Mid-Ebb |
M |
4.8 |
12:05 |
8.58 |
8.07 |
33.2 |
20.15 |
2.05 |
5 |
|
WSR02 |
20220131 |
Cloudy |
Moderate |
Mid-Ebb |
B |
8.6 |
12:04 |
8.62 |
8.1 |
33.22 |
20.22 |
2.38 |
5 |
|
WSR02 |
20220131 |
Cloudy |
Moderate |
Mid-Ebb |
B |
8.6 |
12:04 |
8.73 |
8.07 |
33.28 |
20.5 |
2.22 |
5 |
|
WSR03 |
20220101 |
Cloudy |
Moderate |
Mid-Ebb |
S |
1 |
10:57 |
8.28 |
8.23 |
32.56 |
22.17 |
2.63 |
2.5 |
|
WSR03 |
20220101 |
Cloudy |
Moderate |
Mid-Ebb |
S |
1 |
10:57 |
8.4 |
8.24 |
32.52 |
22.11 |
2.77 |
3 |
|
Location |
Date |
Weather |
Sea Conidtion |
Tidal |
Water Level |
Depth
(m) |
Time |
DO (mg/L) |
pH |
Sal (ppt) |
Temp (�XC) |
Turbidty (NTU) |
SS
(mg/L) |
|
WSR03 |
20220101 |
Cloudy |
Moderate |
Mid-Ebb |
M |
3.85 |
10:56 |
8.28 |
8.24 |
32.64 |
22.19 |
2.33 |
3 |
|
WSR03 |
20220101 |
Cloudy |
Moderate |
Mid-Ebb |
M |
3.85 |
10:56 |
8.4 |
8.25 |
32.63 |
22.1 |
2.46 |
4 |
|
WSR03 |
20220101 |
Cloudy |
Moderate |
Mid-Ebb |
B |
6.7 |
10:55 |
8.45 |
8.26 |
32.56 |
22.2 |
2.21 |
2.5 |
|
WSR03 |
20220101 |
Cloudy |
Moderate |
Mid-Ebb |
B |
6.7 |
10:55 |
8.27 |
8.24 |
32.47 |
22.19 |
1.94 |
4 |
|
WSR03 |
20220104 |
Sunny |
Moderate |
Mid-Ebb |
S |
1 |
13:18 |
8.66 |
8.22 |
31.97 |
22.7 |
2.45 |
4 |
|
WSR03 |
20220104 |
Sunny |
Moderate |
Mid-Ebb |
S |
1 |
13:18 |
8.57 |
8.26 |
31.81 |
22.61 |
2.14 |
4 |
|
WSR03 |
20220104 |
Sunny |
Moderate |
Mid-Ebb |
M |
4.1 |
13:17 |
8.57 |
8.21 |
31.71 |
22.74 |
2.16 |
3 |
|
WSR03 |
20220104 |
Sunny |
Moderate |
Mid-Ebb |
M |
4.1 |
13:17 |
8.59 |
8.22 |
31.95 |
22.67 |
2.12 |
3 |
|
WSR03 |
20220104 |
Sunny |
Moderate |
Mid-Ebb |
B |
7.2 |
13:16 |
8.7 |
8.27 |
31.75 |
22.74 |
2.11 |
6 |
|
WSR03 |
20220104 |
Sunny |
Moderate |
Mid-Ebb |
B |
7.2 |
13:16 |
8.71 |
8.24 |
31.8 |
22.67 |
2.06 |
3 |
|
WSR03 |
20220106 |
Sunny |
Moderate |
Mid-Ebb |
S |
1 |
15:04 |
8.47 |
8.37 |
32.15 |
22.82 |
2.9 |
3 |
|
WSR03 |
20220106 |
Sunny |
Moderate |
Mid-Ebb |
S |
1 |
15:04 |
8.52 |
8.34 |
32.17 |
22.81 |
3.17 |
6 |
|
WSR03 |
20220106 |
Sunny |
Moderate |
Mid-Ebb |
M |
4.1 |
15:03 |
8.65 |
8.37 |
32.14 |
22.83 |
3.03 |
4 |
|
WSR03 |
20220106 |
Sunny |
Moderate |
Mid-Ebb |
M |
4.1 |
15:03 |
8.6 |
8.33 |
32.25 |
22.78 |
2.99 |
3 |
|
WSR03 |
20220106 |
Sunny |
Moderate |
Mid-Ebb |
B |
7.2 |
15:02 |
8.65 |
8.32 |
32.17 |
22.86 |
2.39 |
4 |
|
WSR03 |
20220106 |
Sunny |
Moderate |
Mid-Ebb |
B |
7.2 |
15:02 |
8.64 |
8.32 |
32.15 |
22.82 |
2.85 |
6 |
|
WSR03 |
20220108 |
Sunny |
Moderate |
Mid-Ebb |
S |
1 |
16:50 |
8.34 |
8.29 |
34.3 |
21.67 |
2.07 |
6 |
|
WSR03 |
20220108 |
Sunny |
Moderate |
Mid-Ebb |
S |
1 |
16:50 |
8.42 |
8.22 |
34.27 |
21.64 |
2.11 |
9 |
|
WSR03 |
20220108 |
Sunny |
Moderate |
Mid-Ebb |
M |
3.7 |
16:49 |
8.45 |
8.26 |
34.2 |
21.71 |
2.44 |
6 |
|
WSR03 |
20220108 |
Sunny |
Moderate |
Mid-Ebb |
M |
3.7 |
16:49 |
8.52 |
8.26 |
34.24 |
21.71 |
2.51 |
5 |
|
WSR03 |
20220108 |
Sunny |
Moderate |
Mid-Ebb |
B |
6.4 |
16:48 |
8.36 |
8.27 |
34.22 |
21.68 |
2.47 |
7 |
|
WSR03 |
20220108 |
Sunny |
Moderate |
Mid-Ebb |
B |
6.4 |
16:48 |
8.38 |
8.2 |
34.16 |
21.7 |
2.19 |
5 |
|
WSR03 |
20220111 |
Sunny |
Moderate |
Mid-Ebb |
S |
1 |
13:27 |
9.61 |
8.38 |
34.38 |
20.44 |
2.08 |
5 |
|
WSR03 |
20220111 |
Sunny |
Moderate |
Mid-Ebb |
S |
1 |
13:27 |
9.62 |
8.3 |
34.41 |
20.47 |
2.38 |
5 |
|
WSR03 |
20220111 |
Sunny |
Moderate |
Mid-Ebb |
M |
4.25 |
13:26 |
9.48 |
8.38 |
34.54 |
20.29 |
1.75 |
3 |
|
WSR03 |
20220111 |
Sunny |
Moderate |
Mid-Ebb |
M |
4.25 |
13:26 |
9.67 |
8.4 |
34.55 |
20.29 |
1.95 |
4 |
|
Location |
Date |
Weather |
Sea Conidtion |
Tidal |
Water Level |
Depth
(m) |
Time |
DO (mg/L) |
pH |
Sal (ppt) |
Temp (�XC) |
Turbidty (NTU) |
SS
(mg/L) |
|
WSR03 |
20220111 |
Sunny |
Moderate |
Mid-Ebb |
B |
7.5 |
13:25 |
9.59 |
8.29 |
34.42 |
20.28 |
1.44 |
6 |
|
WSR03 |
20220111 |
Sunny |
Moderate |
Mid-Ebb |
B |
7.5 |
13:25 |
9.59 |
8.35 |
34.44 |
20.31 |
1.4 |
6 |
|
WSR03 |
20220113 |
Cloudy |
Moderate |
Mid-Ebb |
S |
1 |
9:38 |
8.19 |
8.35 |
32.8 |
20.5 |
3.28 |
4 |
|
WSR03 |
20220113 |
Cloudy |
Moderate |
Mid-Ebb |
S |
1 |
9:38 |
8.3 |
8.25 |
32.73 |
20.39 |
3.49 |
4 |
|
WSR03 |
20220113 |
Cloudy |
Moderate |
Mid-Ebb |
M |
3.75 |
9:37 |
8.35 |
8.34 |
32.76 |
20.52 |
3.12 |
3 |
|
WSR03 |
20220113 |
Cloudy |
Moderate |
Mid-Ebb |
M |
3.75 |
9:37 |
8.26 |
8.35 |
32.79 |
20.33 |
2.89 |
6 |
|
WSR03 |
20220113 |
Cloudy |
Moderate |
Mid-Ebb |
B |
6.5 |
9:36 |
8.34 |
8.24 |
32.8 |
20.36 |
2.6 |
5 |
|
WSR03 |
20220113 |
Cloudy |
Moderate |
Mid-Ebb |
B |
6.5 |
9:36 |
8.35 |
8.33 |
32.74 |
20.47 |
2.74 |
5 |
|
WSR03 |
20220115 |
Cloudy |
Moderate |
Mid-Ebb |
S |
1 |
11:41 |
9.23 |
8.19 |
32.67 |
20.48 |
3.24 |
6 |
|
WSR03 |
20220115 |
Cloudy |
Moderate |
Mid-Ebb |
S |
1 |
11:41 |
9.24 |
8.2 |
32.7 |
20.57 |
3.18 |
7 |
|
WSR03 |
20220115 |
Cloudy |
Moderate |
Mid-Ebb |
M |
3.75 |
11:40 |
9.3 |
8.24 |
32.71 |
20.55 |
3.41 |
12 |
|
WSR03 |
20220115 |
Cloudy |
Moderate |
Mid-Ebb |
M |
3.75 |
11:40 |
9.3 |
8.25 |
32.74 |
20.54 |
3.43 |
15 |
|
WSR03 |
20220115 |
Cloudy |
Moderate |
Mid-Ebb |
B |
6.5 |
11:39 |
9.28 |
8.16 |
32.68 |
20.43 |
3.38 |
2.5 |
|
WSR03 |
20220115 |
Cloudy |
Moderate |
Mid-Ebb |
B |
6.5 |
11:39 |
9.35 |
8.21 |
32.7 |
20.52 |
3.26 |
3 |
|
WSR03 |
20220118 |
Cloudy |
Moderate |
Mid-Ebb |
S |
1 |
11:09 |
8.85 |
8.17 |
34.01 |
20.71 |
3.81 |
4 |
|
WSR03 |
20220118 |
Cloudy |
Moderate |
Mid-Ebb |
S |
1 |
11:09 |
8.75 |
8.11 |
34.03 |
20.67 |
4.53 |
5 |
|
WSR03 |
20220118 |
Cloudy |
Moderate |
Mid-Ebb |
M |
3.95 |
11:08 |
8.75 |
8.2 |
33.88 |
20.66 |
3.7 |
5 |
|
WSR03 |
20220118 |
Cloudy |
Moderate |
Mid-Ebb |
M |
3.95 |
11:08 |
8.83 |
8.2 |
33.98 |
20.92 |
3.64 |
3 |
|
WSR03 |
20220118 |
Cloudy |
Moderate |
Mid-Ebb |
B |
6.9 |
11:07 |
8.8 |
8.2 |
33.98 |
20.82 |
3 |
3 |
|
WSR03 |
20220118 |
Cloudy |
Moderate |
Mid-Ebb |
B |
6.9 |
11:07 |
8.75 |
8.21 |
33.96 |
20.87 |
3.32 |
2.5 |
|
WSR03 |
20220120 |
Sunny |
Moderate |
Mid-Ebb |
S |
1 |
13:20 |
8.46 |
8.2 |
33.13 |
20.99 |
3.89 |
6 |
|
WSR03 |
20220120 |
Sunny |
Moderate |
Mid-Ebb |
S |
1 |
13:20 |
8.52 |
8.22 |
33.06 |
20.95 |
3.86 |
6 |
|
WSR03 |
20220120 |
Sunny |
Moderate |
Mid-Ebb |
M |
4.2 |
13:19 |
8.46 |
8.15 |
32.98 |
20.92 |
3.99 |
4 |
|
WSR03 |
20220120 |
Sunny |
Moderate |
Mid-Ebb |
M |
4.2 |
13:19 |
8.51 |
8.18 |
32.95 |
20.91 |
3.9 |
4 |
|
WSR03 |
20220120 |
Sunny |
Moderate |
Mid-Ebb |
B |
7.4 |
13:18 |
8.46 |
8.21 |
32.86 |
21.01 |
3.42 |
6 |
|
WSR03 |
20220120 |
Sunny |
Moderate |
Mid-Ebb |
B |
7.4 |
13:18 |
8.53 |
8.15 |
32.92 |
20.94 |
3.04 |
5 |
|
Location |
Date |
Weather |
Sea Conidtion |
Tidal |
Water Level |
Depth
(m) |
Time |
DO (mg/L) |
pH |
Sal (ppt) |
Temp (�XC) |
Turbidty (NTU) |
SS
(mg/L) |
|
WSR03 |
20220122 |
Cloudy |
Moderate |
Mid-Ebb |
S |
1 |
14:52 |
8.52 |
8.42 |
33.3 |
20.94 |
3.08 |
4 |
|
WSR03 |
20220122 |
Cloudy |
Moderate |
Mid-Ebb |
S |
1 |
14:52 |
8.51 |
8.36 |
33.51 |
21.06 |
3.27 |
5 |
|
WSR03 |
20220122 |
Cloudy |
Moderate |
Mid-Ebb |
M |
4.2 |
14:51 |
8.38 |
8.44 |
33.4 |
21.04 |
3.14 |
5 |
|
WSR03 |
20220122 |
Cloudy |
Moderate |
Mid-Ebb |
M |
4.2 |
14:51 |
8.51 |
8.39 |
33.48 |
20.97 |
3 |
6 |
|
WSR03 |
20220122 |
Cloudy |
Moderate |
Mid-Ebb |
B |
7.4 |
14:50 |
8.43 |
8.35 |
33.29 |
21.11 |
2.33 |
5 |
|
WSR03 |
20220122 |
Cloudy |
Moderate |
Mid-Ebb |
B |
7.4 |
14:50 |
8.53 |
8.41 |
33.39 |
20.98 |
2.59 |
6 |
|
WSR03 |
20220125 |
Cloudy |
Moderate |
Mid-Ebb |
S |
1 |
17:11 |
8.33 |
8.17 |
31.1 |
20.83 |
2.39 |
3 |
|
WSR03 |
20220125 |
Cloudy |
Moderate |
Mid-Ebb |
S |
1 |
17:11 |
8.41 |
8.24 |
31.18 |
20.9 |
2.58 |
3 |
|
WSR03 |
20220125 |
Cloudy |
Moderate |
Mid-Ebb |
M |
4.2 |
17:10 |
8.29 |
8.22 |
31.05 |
20.84 |
2.13 |
4 |
|
WSR03 |
20220125 |
Cloudy |
Moderate |
Mid-Ebb |
M |
4.2 |
17:10 |
8.38 |
8.16 |
31.2 |
20.83 |
2.25 |
3 |
|
WSR03 |
20220125 |
Cloudy |
Moderate |
Mid-Ebb |
B |
7.4 |
17:09 |
8.33 |
8.21 |
31.15 |
20.88 |
2.01 |
2.5 |
|
WSR03 |
20220125 |
Cloudy |
Moderate |
Mid-Ebb |
B |
7.4 |
17:09 |
8.34 |
8.23 |
31.2 |
20.76 |
2.03 |
3 |
|
WSR03 |
20220127 |
Cloudy |
Moderate |
Mid-Ebb |
S |
1 |
9:34 |
8.51 |
8.03 |
31.27 |
20.75 |
3.38 |
6 |
|
WSR03 |
20220127 |
Cloudy |
Moderate |
Mid-Ebb |
S |
1 |
9:34 |
8.56 |
8.01 |
31.26 |
20.69 |
3.27 |
6 |
|
WSR03 |
20220127 |
Cloudy |
Moderate |
Mid-Ebb |
M |
3.85 |
9:33 |
8.63 |
8 |
31.29 |
20.69 |
2.96 |
8 |
|
WSR03 |
20220127 |
Cloudy |
Moderate |
Mid-Ebb |
M |
3.85 |
9:33 |
8.64 |
7.99 |
31.33 |
20.76 |
2.63 |
8 |
|
WSR03 |
20220127 |
Cloudy |
Moderate |
Mid-Ebb |
B |
6.7 |
9:32 |
8.67 |
7.99 |
31.34 |
20.72 |
2.27 |
5 |
|
WSR03 |
20220127 |
Cloudy |
Moderate |
Mid-Ebb |
B |
6.7 |
9:32 |
8.56 |
7.97 |
31.28 |
20.7 |
2.63 |
5 |
|
WSR03 |
20220129 |
Cloudy |
Moderate |
Mid-Ebb |
S |
1 |
9:53 |
8.81 |
8.29 |
30.06 |
20.13 |
4.24 |
5 |
|
WSR03 |
20220129 |
Cloudy |
Moderate |
Mid-Ebb |
S |
1 |
9:53 |
8.89 |
8.33 |
29.9 |
20.2 |
4.14 |
5 |
|
WSR03 |
20220129 |
Cloudy |
Moderate |
Mid-Ebb |
M |
4 |
9:52 |
8.83 |
8.33 |
30.06 |
20.28 |
3.46 |
4 |
|
WSR03 |
20220129 |
Cloudy |
Moderate |
Mid-Ebb |
M |
4 |
9:52 |
8.84 |
8.36 |
29.98 |
20.1 |
3.21 |
4 |
|
WSR03 |
20220129 |
Cloudy |
Moderate |
Mid-Ebb |
B |
7 |
9:51 |
8.82 |
8.4 |
29.96 |
20.2 |
3.25 |
18 |
|
WSR03 |
20220129 |
Cloudy |
Moderate |
Mid-Ebb |
B |
7 |
9:51 |
8.92 |
8.28 |
30.04 |
20.28 |
3.24 |
20 |
|
WSR03 |
20220131 |
Cloudy |
Moderate |
Mid-Ebb |
S |
1 |
11:50 |
8.85 |
8.03 |
33.62 |
20.23 |
2.87 |
3 |
|
WSR03 |
20220131 |
Cloudy |
Moderate |
Mid-Ebb |
S |
1 |
11:50 |
8.92 |
8.02 |
33.57 |
20.41 |
2.65 |
4 |
|
Location |
Date |
Weather |
Sea Conidtion |
Tidal |
Water Level |
Depth
(m) |
Time |
DO (mg/L) |
pH |
Sal (ppt) |
Temp (�XC) |
Turbidty (NTU) |
SS
(mg/L) |
|
WSR03 |
20220131 |
Cloudy |
Moderate |
Mid-Ebb |
M |
3.9 |
11:49 |
8.92 |
7.99 |
33.45 |
20.36 |
2.33 |
7 |
|
WSR03 |
20220131 |
Cloudy |
Moderate |
Mid-Ebb |
M |
3.9 |
11:49 |
8.82 |
7.94 |
33.53 |
20.39 |
2.08 |
6 |
|
WSR03 |
20220131 |
Cloudy |
Moderate |
Mid-Ebb |
B |
6.8 |
11:48 |
8.96 |
8.04 |
33.57 |
20.42 |
2.74 |
4 |
|
WSR03 |
20220131 |
Cloudy |
Moderate |
Mid-Ebb |
B |
6.8 |
11:48 |
8.85 |
7.98 |
33.64 |
20.33 |
2.47 |
5 |
|
WSR04 |
20220101 |
Cloudy |
Moderate |
Mid-Ebb |
S |
1 |
10:44 |
8.41 |
8.47 |
33.47 |
22.12 |
2.18 |
3 |
|
WSR04 |
20220101 |
Cloudy |
Moderate |
Mid-Ebb |
S |
1 |
10:44 |
8.29 |
8.47 |
33.39 |
22.23 |
1.99 |
4 |
|
WSR04 |
20220101 |
Cloudy |
Moderate |
Mid-Ebb |
M |
3.75 |
10:43 |
8.43 |
8.45 |
33.37 |
22.08 |
1.94 |
3 |
|
WSR04 |
20220101 |
Cloudy |
Moderate |
Mid-Ebb |
M |
3.75 |
10:43 |
8.28 |
8.47 |
33.47 |
22.17 |
2.13 |
4 |
|
WSR04 |
20220101 |
Cloudy |
Moderate |
Mid-Ebb |
B |
6.5 |
10:42 |
8.22 |
8.51 |
33.38 |
22.24 |
1.56 |
3 |
|
WSR04 |
20220101 |
Cloudy |
Moderate |
Mid-Ebb |
B |
6.5 |
10:42 |
8.38 |
8.49 |
33.34 |
22.24 |
1.55 |
3 |
|
WSR04 |
20220104 |
Sunny |
Moderate |
Mid-Ebb |
S |
1 |
13:07 |
9.17 |
8.43 |
32.07 |
22.6 |
2.27 |
5 |
|
WSR04 |
20220104 |
Sunny |
Moderate |
Mid-Ebb |
S |
1 |
13:07 |
9.22 |
8.39 |
32.06 |
22.74 |
2.34 |
5 |
|
WSR04 |
20220104 |
Sunny |
Moderate |
Mid-Ebb |
M |
3.55 |
13:06 |
9.3 |
8.41 |
31.84 |
22.61 |
2.56 |
5 |
|
WSR04 |
20220104 |
Sunny |
Moderate |
Mid-Ebb |
M |
3.55 |
13:06 |
9.17 |
8.39 |
31.94 |
22.65 |
2.3 |
4 |
|
WSR04 |
20220104 |
Sunny |
Moderate |
Mid-Ebb |
B |
6.1 |
13:05 |
9.27 |
8.37 |
31.86 |
22.63 |
2.19 |
7 |
|
WSR04 |
20220104 |
Sunny |
Moderate |
Mid-Ebb |
B |
6.1 |
13:05 |
9.14 |
8.38 |
31.99 |
22.62 |
2.36 |
5 |
|
WSR04 |
20220106 |
Sunny |
Moderate |
Mid-Ebb |
S |
1 |
14:53 |
9.23 |
8.22 |
32.08 |
23.47 |
3.5 |
2.5 |
|
WSR04 |
20220106 |
Sunny |
Moderate |
Mid-Ebb |
S |
1 |
14:53 |
9.09 |
8.19 |
31.9 |
23.39 |
3.46 |
4 |
|
WSR04 |
20220106 |
Sunny |
Moderate |
Mid-Ebb |
M |
3.45 |
14:52 |
9.18 |
8.19 |
32.03 |
23.49 |
3.69 |
4 |
|
WSR04 |
20220106 |
Sunny |
Moderate |
Mid-Ebb |
M |
3.45 |
14:52 |
9.12 |
8.21 |
31.9 |
23.39 |
3.52 |
3 |
|
WSR04 |
20220106 |
Sunny |
Moderate |
Mid-Ebb |
B |
5.9 |
14:51 |
9.25 |
8.2 |
32.01 |
23.45 |
3.17 |
3 |
|
WSR04 |
20220106 |
Sunny |
Moderate |
Mid-Ebb |
B |
5.9 |
14:51 |
9.14 |
8.22 |
32.07 |
23.41 |
3.38 |
4 |
|
WSR04 |
20220108 |
Sunny |
Moderate |
Mid-Ebb |
S |
1 |
16:39 |
8.41 |
8.4 |
34.09 |
21.66 |
2.32 |
5 |
|
WSR04 |
20220108 |
Sunny |
Moderate |
Mid-Ebb |
S |
1 |
16:39 |
8.34 |
8.37 |
33.94 |
21.71 |
2.1 |
5 |
|
WSR04 |
20220108 |
Sunny |
Moderate |
Mid-Ebb |
M |
3.85 |
16:38 |
8.25 |
8.39 |
34.09 |
21.66 |
2.32 |
6 |
|
WSR04 |
20220108 |
Sunny |
Moderate |
Mid-Ebb |
M |
3.85 |
16:38 |
8.42 |
8.38 |
33.96 |
21.69 |
2.36 |
4 |
|
Location |
Date |
Weather |
Sea Conidtion |
Tidal |
Water Level |
Depth
(m) |
Time |
DO (mg/L) |
pH |
Sal (ppt) |
Temp (�XC) |
Turbidty (NTU) |
SS (mg/L) |
|
WSR04 |
20220108 |
Sunny |
Moderate |
Mid-Ebb |
B |
6.7 |
16:37 |
8.27 |
8.36 |
33.99 |
21.7 |
2.05 |
10 |
|
WSR04 |
20220108 |
Sunny |
Moderate |
Mid-Ebb |
B |
6.7 |
16:37 |
8.24 |
8.45 |
34.09 |
21.71 |
2.07 |
10 |
|
WSR04 |
20220111 |
Sunny |
Moderate |
Mid-Ebb |
S |
1 |
13:14 |
8.73 |
8.3 |
34.78 |
20.25 |
2.78 |
12 |
|
WSR04 |
20220111 |
Sunny |
Moderate |
Mid-Ebb |
S |
1 |
13:14 |
8.92 |
8.27 |
34.74 |
20.38 |
2.72 |
12 |
|
WSR04 |
20220111 |
Sunny |
Moderate |
Mid-Ebb |
M |
3.45 |
13:13 |
8.8 |
8.23 |
34.67 |
20.39 |
2.64 |
7 |
|
WSR04 |
20220111 |
Sunny |
Moderate |
Mid-Ebb |
M |
3.45 |
13:13 |
8.81 |
8.27 |
34.77 |
20.32 |
2.23 |
7 |
|
WSR04 |
20220111 |
Sunny |
Moderate |
Mid-Ebb |
B |
5.9 |
13:12 |
8.85 |
8.29 |
34.67 |
20.39 |
1.84 |
12 |
|
WSR04 |
20220111 |
Sunny |
Moderate |
Mid-Ebb |
B |
5.9 |
13:12 |
8.9 |
8.29 |
34.52 |
20.34 |
2.19 |
13 |
|
WSR04 |
20220113 |
Cloudy |
Moderate |
Mid-Ebb |
S |
1 |
9:25 |
8.87 |
8.29 |
33.18 |
20.49 |
3.08 |
2.5 |
|
WSR04 |
20220113 |
Cloudy |
Moderate |
Mid-Ebb |
S |
1 |
9:25 |
8.89 |
8.21 |
33.16 |
20.51 |
3.57 |
2.5 |
|
WSR04 |
20220113 |
Cloudy |
Moderate |
Mid-Ebb |
M |
3.65 |
9:24 |
8.97 |
8.16 |
33.04 |
20.58 |
3.14 |
3 |
|
WSR04 |
20220113 |
Cloudy |
Moderate |
Mid-Ebb |
M |
3.65 |
9:24 |
8.89 |
8.15 |
33.1 |
20.56 |
3.57 |
2.5 |
|
WSR04 |
20220113 |
Cloudy |
Moderate |
Mid-Ebb |
B |
6.3 |
9:23 |
8.78 |
8.15 |
33.05 |
20.63 |
3.09 |
2.5 |
|
WSR04 |
20220113 |
Cloudy |
Moderate |
Mid-Ebb |
B |
6.3 |
9:23 |
8.97 |
8.17 |
33.06 |
20.46 |
2.63 |
2.5 |
|
WSR04 |
20220115 |
Cloudy |
Moderate |
Mid-Ebb |
S |
1 |
11:29 |
8.63 |
8.21 |
33.17 |
20.67 |
3.18 |
3 |
|
WSR04 |
20220115 |
Cloudy |
Moderate |
Mid-Ebb |
S |
1 |
11:29 |
8.53 |
8.25 |
33.15 |
20.72 |
3.09 |
3 |
|
WSR04 |
20220115 |
Cloudy |
Moderate |
Mid-Ebb |
M |
3.45 |
11:28 |
8.66 |
8.2 |
33.08 |
20.81 |
3.27 |
2.5 |
|
WSR04 |
20220115 |
Cloudy |
Moderate |
Mid-Ebb |
M |
3.45 |
11:28 |
8.51 |
8.21 |
33.14 |
20.78 |
3.04 |
4 |
|
WSR04 |
20220115 |
Cloudy |
Moderate |
Mid-Ebb |
B |
5.9 |
11:27 |
8.6 |
8.2 |
33.12 |
20.71 |
3.32 |
3 |
|
WSR04 |
20220115 |
Cloudy |
Moderate |
Mid-Ebb |
B |
5.9 |
11:27 |
8.52 |
8.21 |
33.07 |
20.7 |
2.97 |
4 |
|
WSR04 |
20220118 |
Cloudy |
Moderate |
Mid-Ebb |
S |
1 |
11:00 |
9.1 |
8.3 |
33.22 |
20.89 |
4.41 |
5 |
|
WSR04 |
20220118 |
Cloudy |
Moderate |
Mid-Ebb |
S |
1 |
11:00 |
9.08 |
8.31 |
33.21 |
21.12 |
3.77 |
5 |
|
WSR04 |
20220118 |
Cloudy |
Moderate |
Mid-Ebb |
M |
3.35 |
10:59 |
9.09 |
8.34 |
33.32 |
20.9 |
3.64 |
2.5 |
|
WSR04 |
20220118 |
Cloudy |
Moderate |
Mid-Ebb |
M |
3.35 |
10:59 |
9.08 |
8.28 |
33.24 |
20.96 |
4.05 |
3 |
|
WSR04 |
20220118 |
Cloudy |
Moderate |
Mid-Ebb |
B |
5.7 |
10:58 |
9.18 |
8.33 |
33.28 |
21.1 |
3.57 |
2.5 |
|
WSR04 |
20220118 |
Cloudy |
Moderate |
Mid-Ebb |
B |
5.7 |
10:58 |
9.11 |
8.29 |
33.22 |
20.88 |
3.32 |
3 |
|
Location |
Date |
Weather |
Sea Conidtion |
Tidal |
Water Level |
Depth
(m) |
Time |
DO (mg/L) |
pH |
Sal (ppt) |
Temp (�XC) |
Turbidty (NTU) |
SS
(mg/L) |
|
WSR04 |
20220120 |
Sunny |
Moderate |
Mid-Ebb |
S |
1 |
13:09 |
8.67 |
8.14 |
33.88 |
21.07 |
3.99 |
5 |
|
WSR04 |
20220120 |
Sunny |
Moderate |
Mid-Ebb |
S |
1 |
13:09 |
8.68 |
8.19 |
33.82 |
21.08 |
3.81 |
5 |
|
WSR04 |
20220120 |
Sunny |
Moderate |
Mid-Ebb |
M |
3.9 |
13:08 |
8.64 |
8.18 |
34.07 |
21.08 |
4.04 |
6 |
|
WSR04 |
20220120 |
Sunny |
Moderate |
Mid-Ebb |
M |
3.9 |
13:08 |
8.61 |
8.2 |
33.98 |
21.08 |
4.14 |
6 |
|
WSR04 |
20220120 |
Sunny |
Moderate |
Mid-Ebb |
B |
6.8 |
13:07 |
8.62 |
8.14 |
33.88 |
21.07 |
3.78 |
5 |
|
WSR04 |
20220120 |
Sunny |
Moderate |
Mid-Ebb |
B |
6.8 |
13:07 |
8.71 |
8.14 |
34.08 |
21.02 |
3.5 |
4 |
|
WSR04 |
20220122 |
Cloudy |
Moderate |
Mid-Ebb |
S |
1 |
14:42 |
8.12 |
8.19 |
32.9 |
21.59 |
2.91 |
4 |
|
WSR04 |
20220122 |
Cloudy |
Moderate |
Mid-Ebb |
S |
1 |
14:42 |
8.14 |
8.23 |
32.99 |
21.56 |
3.27 |
5 |
|
WSR04 |
20220122 |
Cloudy |
Moderate |
Mid-Ebb |
M |
3.7 |
14:41 |
8.28 |
8.19 |
33.05 |
21.43 |
2.19 |
7 |
|
WSR04 |
20220122 |
Cloudy |
Moderate |
Mid-Ebb |
M |
3.7 |
14:41 |
8.22 |
8.2 |
33.01 |
21.4 |
2.28 |
5 |
|
WSR04 |
20220122 |
Cloudy |
Moderate |
Mid-Ebb |
B |
6.4 |
14:40 |
8.14 |
8.17 |
32.86 |
21.46 |
2.29 |
4 |
|
WSR04 |
20220122 |
Cloudy |
Moderate |
Mid-Ebb |
B |
6.4 |
14:40 |
8.19 |
8.18 |
32.93 |
21.58 |
2.33 |
5 |
|
WSR04 |
20220125 |
Cloudy |
Moderate |
Mid-Ebb |
S |
1 |
17:00 |
8.49 |
8.1 |
31.2 |
20.95 |
2.82 |
5 |
|
WSR04 |
20220125 |
Cloudy |
Moderate |
Mid-Ebb |
S |
1 |
17:00 |
8.55 |
8.17 |
31.06 |
20.95 |
2.43 |
5 |
|
WSR04 |
20220125 |
Cloudy |
Moderate |
Mid-Ebb |
M |
3.7 |
16:59 |
8.52 |
8.08 |
31.13 |
20.9 |
2.46 |
5 |
|
WSR04 |
20220125 |
Cloudy |
Moderate |
Mid-Ebb |
M |
3.7 |
16:59 |
8.54 |
8.18 |
31.09 |
20.96 |
2.78 |
4 |
|
WSR04 |
20220125 |
Cloudy |
Moderate |
Mid-Ebb |
B |
6.4 |
16:58 |
8.58 |
8.13 |
31.04 |
20.93 |
2.34 |
3 |
|
WSR04 |
20220125 |
Cloudy |
Moderate |
Mid-Ebb |
B |
6.4 |
16:58 |
8.55 |
8.11 |
31.04 |
20.93 |
2.21 |
3 |
|
WSR04 |
20220127 |
Cloudy |
Moderate |
Mid-Ebb |
S |
1 |
9:23 |
9.06 |
8.09 |
30.85 |
21 |
3.25 |
5 |
|
WSR04 |
20220127 |
Cloudy |
Moderate |
Mid-Ebb |
S |
1 |
9:23 |
9.19 |
8.03 |
30.82 |
20.99 |
3.04 |
7 |
|
WSR04 |
20220127 |
Cloudy |
Moderate |
Mid-Ebb |
M |
3.75 |
9:22 |
9.13 |
8.01 |
30.89 |
21.06 |
2.63 |
4 |
|
WSR04 |
20220127 |
Cloudy |
Moderate |
Mid-Ebb |
M |
3.75 |
9:22 |
9.16 |
8.05 |
30.91 |
21.06 |
3.1 |
4 |
|
WSR04 |
20220127 |
Cloudy |
Moderate |
Mid-Ebb |
B |
6.5 |
9:21 |
9.2 |
8.02 |
30.81 |
21.05 |
2.95 |
6 |
|
WSR04 |
20220127 |
Cloudy |
Moderate |
Mid-Ebb |
B |
6.5 |
9:21 |
9.07 |
8.06 |
30.87 |
21.02 |
2.82 |
5 |
|
WSR04 |
20220129 |
Cloudy |
Moderate |
Mid-Ebb |
S |
1 |
9:40 |
9.69 |
8.38 |
30.34 |
19.94 |
3.39 |
28 |
|
WSR04 |
20220129 |
Cloudy |
Moderate |
Mid-Ebb |
S |
1 |
9:40 |
9.62 |
8.35 |
30.57 |
19.95 |
3.65 |
28 |
|
Location |
Date |
Weather |
Sea Conidtion |
Tidal |
Water Level |
Depth
(m) |
Time |
DO (mg/L) |
pH |
Sal (ppt) |
Temp (�XC) |
Turbidty (NTU) |
SS
(mg/L) |
|
WSR04 |
20220129 |
Cloudy |
Moderate |
Mid-Ebb |
M |
3.7 |
9:39 |
9.59 |
8.36 |
30.34 |
20.02 |
2.99 |
11 |
|
WSR04 |
20220129 |
Cloudy |
Moderate |
Mid-Ebb |
M |
3.7 |
9:39 |
9.63 |
8.35 |
30.46 |
20.11 |
3.38 |
11 |
|
WSR04 |
20220129 |
Cloudy |
Moderate |
Mid-Ebb |
B |
6.4 |
9:38 |
9.67 |
8.39 |
30.44 |
20 |
2.75 |
18 |
|
WSR04 |
20220129 |
Cloudy |
Moderate |
Mid-Ebb |
B |
6.4 |
9:38 |
9.62 |
8.29 |
30.48 |
20.07 |
3.12 |
18 |
|
WSR04 |
20220131 |
Cloudy |
Moderate |
Mid-Ebb |
S |
1 |
11:36 |
8.58 |
8.06 |
33.06 |
20.16 |
2.86 |
4 |
|
WSR04 |
20220131 |
Cloudy |
Moderate |
Mid-Ebb |
S |
1 |
11:36 |
8.46 |
8 |
33.15 |
20.11 |
2.65 |
4 |
|
WSR04 |
20220131 |
Cloudy |
Moderate |
Mid-Ebb |
M |
3.4 |
11:35 |
8.45 |
8.02 |
33.07 |
20.16 |
2.54 |
4 |
|
WSR04 |
20220131 |
Cloudy |
Moderate |
Mid-Ebb |
M |
3.4 |
11:35 |
8.49 |
7.97 |
33.2 |
20.09 |
2.18 |
4 |
|
WSR04 |
20220131 |
Cloudy |
Moderate |
Mid-Ebb |
B |
5.8 |
11:34 |
8.54 |
7.97 |
33.12 |
20.11 |
1.89 |
4 |
|
WSR04 |
20220131 |
Cloudy |
Moderate |
Mid-Ebb |
B |
5.8 |
11:34 |
8.59 |
8.02 |
33.17 |
20.16 |
1.92 |
4 |
|
WSR16 |
20220101 |
Cloudy |
Moderate |
Mid-Ebb |
S |
1 |
9:46 |
8.23 |
8.4 |
33.34 |
22.13 |
2.19 |
5 |
|
WSR16 |
20220101 |
Cloudy |
Moderate |
Mid-Ebb |
S |
1 |
9:46 |
8.13 |
8.42 |
33.45 |
21.98 |
1.95 |
4 |
|
WSR16 |
20220101 |
Cloudy |
Moderate |
Mid-Ebb |
M |
7.95 |
9:45 |
8.03 |
8.4 |
33.41 |
22.04 |
1.91 |
4 |
|
WSR16 |
20220101 |
Cloudy |
Moderate |
Mid-Ebb |
M |
7.95 |
9:45 |
8.2 |
8.4 |
33.37 |
22.12 |
1.84 |
4 |
|
WSR16 |
20220101 |
Cloudy |
Moderate |
Mid-Ebb |
B |
14.9 |
9:44 |
8.12 |
8.4 |
33.31 |
22.14 |
1.9 |
8 |
|
WSR16 |
20220101 |
Cloudy |
Moderate |
Mid-Ebb |
B |
14.9 |
9:44 |
8.18 |
8.39 |
33.36 |
21.98 |
1.88 |
5 |
|
WSR16 |
20220104 |
Sunny |
Moderate |
Mid-Ebb |
S |
1 |
12:08 |
9.04 |
8.39 |
31.28 |
22.51 |
2.71 |
3 |
|
WSR16 |
20220104 |
Sunny |
Moderate |
Mid-Ebb |
S |
1 |
12:08 |
9.06 |
8.34 |
31.32 |
22.5 |
2.45 |
4 |
|
WSR16 |
20220104 |
Sunny |
Moderate |
Mid-Ebb |
M |
7.95 |
12:07 |
9.23 |
8.35 |
31.37 |
22.48 |
2.47 |
2.5 |
|
WSR16 |
20220104 |
Sunny |
Moderate |
Mid-Ebb |
M |
7.95 |
12:07 |
9.2 |
8.35 |
31.3 |
22.44 |
2.15 |
3 |
|
WSR16 |
20220104 |
Sunny |
Moderate |
Mid-Ebb |
B |
14.9 |
12:06 |
9.1 |
8.36 |
31.23 |
22.42 |
2.09 |
3 |
|
WSR16 |
20220104 |
Sunny |
Moderate |
Mid-Ebb |
B |
14.9 |
12:06 |
9.21 |
8.35 |
31.3 |
22.51 |
1.89 |
2.5 |
|
WSR16 |
20220106 |
Sunny |
Moderate |
Mid-Ebb |
S |
1 |
13:53 |
8.1 |
8.35 |
32.91 |
22.95 |
3.63 |
4 |
|
WSR16 |
20220106 |
Sunny |
Moderate |
Mid-Ebb |
S |
1 |
13:53 |
8.21 |
8.33 |
33 |
22.86 |
3.6 |
3 |
|
WSR16 |
20220106 |
Sunny |
Moderate |
Mid-Ebb |
M |
7.9 |
13:52 |
8.2 |
8.36 |
32.98 |
22.82 |
3.7 |
13 |
|
WSR16 |
20220106 |
Sunny |
Moderate |
Mid-Ebb |
M |
7.9 |
13:52 |
8.12 |
8.38 |
32.87 |
22.92 |
3.11 |
13 |
|
Location |
Date |
Weather |
Sea Conidtion |
Tidal |
Water Level |
Depth
(m) |
Time |
DO (mg/L) |
pH |
Sal (ppt) |
Temp (�XC) |
Turbidty (NTU) |
SS
(mg/L) |
|
WSR16 |
20220106 |
Sunny |
Moderate |
Mid-Ebb |
B |
14.8 |
13:51 |
8.22 |
8.34 |
33 |
22.89 |
2.86 |
2.5 |
|
WSR16 |
20220106 |
Sunny |
Moderate |
Mid-Ebb |
B |
14.8 |
13:51 |
8.02 |
8.34 |
32.87 |
22.92 |
3.39 |
3 |
|
WSR16 |
20220108 |
Sunny |
Moderate |
Mid-Ebb |
S |
1 |
15:38 |
8.42 |
8.31 |
34.7 |
22.18 |
2.93 |
5 |
|
WSR16 |
20220108 |
Sunny |
Moderate |
Mid-Ebb |
S |
1 |
15:38 |
8.47 |
8.32 |
34.68 |
22.16 |
2.96 |
4 |
|
WSR16 |
20220108 |
Sunny |
Moderate |
Mid-Ebb |
M |
8.4 |
15:37 |
8.36 |
8.37 |
34.63 |
22.13 |
2.28 |
5 |
|
WSR16 |
20220108 |
Sunny |
Moderate |
Mid-Ebb |
M |
8.4 |
15:37 |
8.34 |
8.37 |
34.79 |
22.17 |
2.58 |
8 |
|
WSR16 |
20220108 |
Sunny |
Moderate |
Mid-Ebb |
B |
15.8 |
15:36 |
8.34 |
8.31 |
34.75 |
22.14 |
2.14 |
5 |
|
WSR16 |
20220108 |
Sunny |
Moderate |
Mid-Ebb |
B |
15.8 |
15:36 |
8.33 |
8.3 |
34.66 |
22.1 |
2.38 |
6 |
|
WSR16 |
20220111 |
Sunny |
Moderate |
Mid-Ebb |
S |
1 |
12:01 |
9.25 |
8.4 |
34.33 |
20.37 |
2.54 |
8 |
|
WSR16 |
20220111 |
Sunny |
Moderate |
Mid-Ebb |
S |
1 |
12:01 |
9.2 |
8.32 |
34.29 |
20.29 |
2.62 |
8 |
|
WSR16 |
20220111 |
Sunny |
Moderate |
Mid-Ebb |
M |
8.15 |
12:00 |
9.16 |
8.37 |
34.46 |
20.32 |
2.46 |
5 |
|
WSR16 |
20220111 |
Sunny |
Moderate |
Mid-Ebb |
M |
8.15 |
12:00 |
9.35 |
8.28 |
34.46 |
20.37 |
2.23 |
5 |
|
WSR16 |
20220111 |
Sunny |
Moderate |
Mid-Ebb |
B |
15.3 |
11:59 |
9.33 |
8.34 |
34.27 |
20.36 |
2.29 |
3 |
|
WSR16 |
20220111 |
Sunny |
Moderate |
Mid-Ebb |
B |
15.3 |
11:59 |
9.32 |
8.29 |
34.27 |
20.42 |
2.31 |
4 |
|
WSR16 |
20220113 |
Cloudy |
Moderate |
Mid-Ebb |
S |
1 |
8:22 |
8.42 |
8.24 |
33.29 |
20.55 |
3.31 |
2.5 |
|
WSR16 |
20220113 |
Cloudy |
Moderate |
Mid-Ebb |
S |
1 |
8:22 |
8.49 |
8.22 |
33.3 |
20.61 |
2.8 |
4 |
|
WSR16 |
20220113 |
Cloudy |
Moderate |
Mid-Ebb |
M |
7.8 |
8:21 |
8.36 |
8.16 |
33.25 |
20.45 |
2.65 |
2.5 |
|
WSR16 |
20220113 |
Cloudy |
Moderate |
Mid-Ebb |
M |
7.8 |
8:21 |
8.38 |
8.23 |
33.17 |
20.48 |
2.47 |
4 |
|
WSR16 |
20220113 |
Cloudy |
Moderate |
Mid-Ebb |
B |
14.6 |
8:20 |
8.46 |
8.15 |
33.27 |
20.6 |
2.77 |
2.5 |
|
WSR16 |
20220113 |
Cloudy |
Moderate |
Mid-Ebb |
B |
14.6 |
8:20 |
8.4 |
8.21 |
33.22 |
20.59 |
2.6 |
6 |
|
WSR16 |
20220115 |
Cloudy |
Moderate |
Mid-Ebb |
S |
1 |
10:28 |
8.98 |
8.29 |
33.07 |
20.44 |
3.42 |
3 |
|
WSR16 |
20220115 |
Cloudy |
Moderate |
Mid-Ebb |
S |
1 |
10:28 |
8.93 |
8.28 |
33.11 |
20.55 |
3.22 |
3 |
|
WSR16 |
20220115 |
Cloudy |
Moderate |
Mid-Ebb |
M |
8.35 |
10:27 |
8.89 |
8.22 |
33.12 |
20.43 |
3.18 |
8 |
|
WSR16 |
20220115 |
Cloudy |
Moderate |
Mid-Ebb |
M |
8.35 |
10:27 |
8.89 |
8.23 |
33.07 |
20.43 |
3.24 |
8 |
|
WSR16 |
20220115 |
Cloudy |
Moderate |
Mid-Ebb |
B |
15.7 |
10:26 |
8.99 |
8.21 |
33.01 |
20.47 |
3.42 |
3 |
|
WSR16 |
20220115 |
Cloudy |
Moderate |
Mid-Ebb |
B |
15.7 |
10:26 |
8.92 |
8.24 |
33.12 |
20.48 |
3.18 |
3 |
|
Location |
Date |
Weather |
Sea Conidtion |
Tidal |
Water Level |
Depth
(m) |
Time |
DO (mg/L) |
pH |
Sal (ppt) |
Temp (�XC) |
Turbidty (NTU) |
SS
(mg/L) |
|
WSR16 |
20220118 |
Cloudy |
Moderate |
Mid-Ebb |
S |
1 |
10:06 |
9.27 |
8.27 |
33.97 |
20.82 |
3.83 |
3 |
|
WSR16 |
20220118 |
Cloudy |
Moderate |
Mid-Ebb |
S |
1 |
10:06 |
9.24 |
8.28 |
33.91 |
20.85 |
3.35 |
3 |
|
WSR16 |
20220118 |
Cloudy |
Moderate |
Mid-Ebb |
M |
8.25 |
10:05 |
9.26 |
8.29 |
33.86 |
20.74 |
3.27 |
2.5 |
|
WSR16 |
20220118 |
Cloudy |
Moderate |
Mid-Ebb |
M |
8.25 |
10:05 |
9.23 |
8.29 |
33.87 |
20.59 |
3.67 |
2.5 |
|
WSR16 |
20220118 |
Cloudy |
Moderate |
Mid-Ebb |
B |
15.5 |
10:04 |
9.32 |
8.24 |
33.95 |
20.76 |
3.59 |
2.5 |
|
WSR16 |
20220118 |
Cloudy |
Moderate |
Mid-Ebb |
B |
15.5 |
10:04 |
9.28 |
8.24 |
33.91 |
20.78 |
3.38 |
2.5 |
|
WSR16 |
20220120 |
Sunny |
Moderate |
Mid-Ebb |
S |
1 |
12:20 |
8.01 |
8.3 |
33.68 |
21.02 |
3.99 |
4 |
|
WSR16 |
20220120 |
Sunny |
Moderate |
Mid-Ebb |
S |
1 |
12:20 |
8.04 |
8.28 |
33.46 |
21.01 |
3.66 |
6 |
|
WSR16 |
20220120 |
Sunny |
Moderate |
Mid-Ebb |
M |
7.75 |
12:19 |
8.1 |
8.24 |
33.35 |
20.96 |
3.58 |
7 |
|
WSR16 |
20220120 |
Sunny |
Moderate |
Mid-Ebb |
M |
7.75 |
12:19 |
8.12 |
8.27 |
33.7 |
21.01 |
3.04 |
8 |
|
WSR16 |
20220120 |
Sunny |
Moderate |
Mid-Ebb |
B |
14.5 |
12:18 |
8.01 |
8.32 |
33.67 |
20.92 |
3.17 |
10 |
|
WSR16 |
20220120 |
Sunny |
Moderate |
Mid-Ebb |
B |
14.5 |
12:18 |
8.07 |
8.27 |
33.53 |
20.94 |
3.59 |
8 |
|
WSR16 |
20220122 |
Cloudy |
Moderate |
Mid-Ebb |
S |
1 |
13:45 |
8.39 |
8.36 |
33 |
20.95 |
2.88 |
7 |
|
WSR16 |
20220122 |
Cloudy |
Moderate |
Mid-Ebb |
S |
1 |
13:45 |
8.44 |
8.36 |
32.95 |
20.79 |
2.83 |
6 |
|
WSR16 |
20220122 |
Cloudy |
Moderate |
Mid-Ebb |
M |
8.3 |
13:44 |
8.48 |
8.37 |
32.77 |
20.87 |
2.89 |
6 |
|
WSR16 |
20220122 |
Cloudy |
Moderate |
Mid-Ebb |
M |
8.3 |
13:44 |
8.38 |
8.35 |
32.84 |
20.91 |
2.54 |
5 |
|
WSR16 |
20220122 |
Cloudy |
Moderate |
Mid-Ebb |
B |
15.6 |
13:43 |
8.46 |
8.33 |
33 |
20.86 |
2.62 |
2.5 |
|
WSR16 |
20220122 |
Cloudy |
Moderate |
Mid-Ebb |
B |
15.6 |
13:43 |
8.52 |
8.37 |
32.97 |
20.76 |
2.92 |
2.5 |
|
WSR16 |
20220125 |
Cloudy |
Moderate |
Mid-Ebb |
S |
1 |
16:04 |
8.89 |
8.28 |
32.05 |
20.81 |
2.44 |
5 |
|
WSR16 |
20220125 |
Cloudy |
Moderate |
Mid-Ebb |
S |
1 |
16:04 |
8.99 |
8.27 |
31.93 |
20.87 |
2.83 |
5 |
|
WSR16 |
20220125 |
Cloudy |
Moderate |
Mid-Ebb |
M |
8 |
16:03 |
8.95 |
8.17 |
31.99 |
20.72 |
2.29 |
5 |
|
WSR16 |
20220125 |
Cloudy |
Moderate |
Mid-Ebb |
M |
8 |
16:03 |
8.92 |
8.2 |
31.93 |
20.81 |
1.96 |
3 |
|
WSR16 |
20220125 |
Cloudy |
Moderate |
Mid-Ebb |
B |
15 |
16:02 |
8.9 |
8.19 |
32.02 |
20.75 |
2.15 |
4 |
|
WSR16 |
20220125 |
Cloudy |
Moderate |
Mid-Ebb |
B |
15 |
16:02 |
9 |
8.21 |
31.94 |
20.76 |
2.24 |
3 |
|
WSR16 |
20220127 |
Cloudy |
Moderate |
Mid-Ebb |
S |
1 |
8:22 |
8.79 |
8.02 |
31.54 |
20.44 |
3.17 |
4 |
|
WSR16 |
20220127 |
Cloudy |
Moderate |
Mid-Ebb |
S |
1 |
8:22 |
8.73 |
8.04 |
31.54 |
20.56 |
2.87 |
4 |
|
Location |
Date |
Weather |
Sea Conidtion |
Tidal |
Water Level |
Depth
(m) |
Time |
DO (mg/L) |
pH |
Sal (ppt) |
Temp (�XC) |
Turbidty (NTU) |
SS
(mg/L) |
|
WSR16 |
20220127 |
Cloudy |
Moderate |
Mid-Ebb |
M |
7.7 |
8:21 |
8.74 |
7.97 |
31.62 |
20.57 |
2.71 |
6 |
|
WSR16 |
20220127 |
Cloudy |
Moderate |
Mid-Ebb |
M |
7.7 |
8:21 |
8.82 |
8.01 |
31.67 |
20.5 |
3.02 |
5 |
|
WSR16 |
20220127 |
Cloudy |
Moderate |
Mid-Ebb |
B |
14.4 |
8:20 |
8.8 |
7.99 |
31.69 |
20.57 |
2.42 |
3 |
|
WSR16 |
20220127 |
Cloudy |
Moderate |
Mid-Ebb |
B |
14.4 |
8:20 |
8.83 |
8 |
31.65 |
20.49 |
2.86 |
6 |
|
WSR16 |
20220129 |
Cloudy |
Moderate |
Mid-Ebb |
S |
1 |
8:38 |
9.31 |
8.29 |
30.23 |
20.71 |
3.58 |
5 |
|
WSR16 |
20220129 |
Cloudy |
Moderate |
Mid-Ebb |
S |
1 |
8:38 |
9.36 |
8.26 |
30.26 |
20.8 |
3.12 |
4 |
|
WSR16 |
20220129 |
Cloudy |
Moderate |
Mid-Ebb |
M |
8.05 |
8:37 |
9.37 |
8.27 |
30.08 |
20.75 |
2.94 |
12 |
|
WSR16 |
20220129 |
Cloudy |
Moderate |
Mid-Ebb |
M |
8.05 |
8:37 |
9.33 |
8.27 |
30.04 |
20.65 |
3.25 |
12 |
|
WSR16 |
20220129 |
Cloudy |
Moderate |
Mid-Ebb |
B |
15.1 |
8:36 |
9.34 |
8.32 |
30.14 |
20.8 |
2.91 |
4 |
|
WSR16 |
20220129 |
Cloudy |
Moderate |
Mid-Ebb |
B |
15.1 |
8:36 |
9.3 |
8.29 |
30.18 |
20.69 |
2.63 |
2.5 |
|
WSR16 |
20220131 |
Cloudy |
Moderate |
Mid-Ebb |
S |
1 |
10:30 |
7.93 |
7.94 |
34.05 |
19.87 |
2.39 |
2.5 |
|
WSR16 |
20220131 |
Cloudy |
Moderate |
Mid-Ebb |
S |
1 |
10:30 |
7.88 |
7.99 |
33.98 |
19.84 |
2.74 |
6 |
|
WSR16 |
20220131 |
Cloudy |
Moderate |
Mid-Ebb |
M |
8.4 |
10:29 |
7.91 |
7.98 |
34.03 |
19.86 |
2.32 |
4 |
|
WSR16 |
20220131 |
Cloudy |
Moderate |
Mid-Ebb |
M |
8.4 |
10:29 |
8.01 |
7.99 |
33.95 |
19.91 |
2.02 |
6 |
|
WSR16 |
20220131 |
Cloudy |
Moderate |
Mid-Ebb |
B |
15.8 |
10:28 |
7.98 |
7.88 |
33.98 |
19.83 |
2.1 |
5 |
|
WSR16 |
20220131 |
Cloudy |
Moderate |
Mid-Ebb |
B |
15.8 |
10:28 |
8.08 |
7.92 |
34.05 |
19.91 |
1.99 |
4 |
|
WSR33 |
20220101 |
Cloudy |
Moderate |
Mid-Ebb |
S |
1 |
10:32 |
8.2 |
8.23 |
33.46 |
21.94 |
2.58 |
6 |
|
WSR33 |
20220101 |
Cloudy |
Moderate |
Mid-Ebb |
S |
1 |
10:32 |
8.09 |
8.28 |
33.44 |
21.97 |
2.88 |
6 |
|
WSR33 |
20220101 |
Cloudy |
Moderate |
Mid-Ebb |
M |
3.75 |
10:31 |
8.2 |
8.27 |
33.34 |
21.91 |
2.6 |
5 |
|
WSR33 |
20220101 |
Cloudy |
Moderate |
Mid-Ebb |
M |
3.75 |
10:31 |
8.22 |
8.26 |
33.41 |
21.91 |
2.28 |
4 |
|
WSR33 |
20220101 |
Cloudy |
Moderate |
Mid-Ebb |
B |
6.5 |
10:30 |
8.09 |
8.28 |
33.46 |
21.96 |
2.51 |
4 |
|
WSR33 |
20220101 |
Cloudy |
Moderate |
Mid-Ebb |
B |
6.5 |
10:30 |
8.15 |
8.22 |
33.45 |
21.84 |
2.14 |
6 |
|
WSR33 |
20220104 |
Sunny |
Moderate |
Mid-Ebb |
S |
1 |
12:52 |
8.49 |
8.3 |
32.14 |
22.5 |
2.13 |
2.5 |
|
WSR33 |
20220104 |
Sunny |
Moderate |
Mid-Ebb |
S |
1 |
12:52 |
8.31 |
8.28 |
32.18 |
22.54 |
2.27 |
2.5 |
|
WSR33 |
20220104 |
Sunny |
Moderate |
Mid-Ebb |
M |
3.7 |
12:51 |
8.4 |
8.32 |
32.28 |
22.6 |
2.43 |
7 |
|
WSR33 |
20220104 |
Sunny |
Moderate |
Mid-Ebb |
M |
3.7 |
12:51 |
8.43 |
8.34 |
32.19 |
22.6 |
2.42 |
7 |
|
Location |
Date |
Weather |
Sea Conidtion |
Tidal |
Water Level |
Depth
(m) |
Time |
DO (mg/L) |
pH |
Sal (ppt) |
Temp (�XC) |
Turbidty (NTU) |
SS
(mg/L) |
|
WSR33 |
20220104 |
Sunny |
Moderate |
Mid-Ebb |
B |
6.4 |
12:50 |
8.36 |
8.3 |
32.16 |
22.6 |
2.36 |
6 |
|
WSR33 |
20220104 |
Sunny |
Moderate |
Mid-Ebb |
B |
6.4 |
12:50 |
8.44 |
8.33 |
32.27 |
22.6 |
2.15 |
6 |
|
WSR33 |
20220106 |
Sunny |
Moderate |
Mid-Ebb |
S |
1 |
14:40 |
8.57 |
8.22 |
32.03 |
23.26 |
3.96 |
3 |
|
WSR33 |
20220106 |
Sunny |
Moderate |
Mid-Ebb |
S |
1 |
14:40 |
8.67 |
8.23 |
32.05 |
23.18 |
3.77 |
4 |
|
WSR33 |
20220106 |
Sunny |
Moderate |
Mid-Ebb |
M |
3.85 |
14:39 |
8.66 |
8.23 |
31.92 |
23.21 |
3.19 |
3 |
|
WSR33 |
20220106 |
Sunny |
Moderate |
Mid-Ebb |
M |
3.85 |
14:39 |
8.63 |
8.2 |
31.98 |
23.26 |
3.49 |
3 |
|
WSR33 |
20220106 |
Sunny |
Moderate |
Mid-Ebb |
B |
6.7 |
14:38 |
8.62 |
8.23 |
31.91 |
23.29 |
3.46 |
14 |
|
WSR33 |
20220106 |
Sunny |
Moderate |
Mid-Ebb |
B |
6.7 |
14:38 |
8.69 |
8.18 |
32.04 |
23.25 |
3.16 |
14 |
|
WSR33 |
20220108 |
Sunny |
Moderate |
Mid-Ebb |
S |
1 |
16:26 |
8.38 |
8.38 |
33.9 |
22.06 |
2.85 |
4 |
|
WSR33 |
20220108 |
Sunny |
Moderate |
Mid-Ebb |
S |
1 |
16:26 |
8.36 |
8.35 |
33.87 |
22 |
2.6 |
5 |
|
WSR33 |
20220108 |
Sunny |
Moderate |
Mid-Ebb |
M |
3.85 |
16:25 |
8.32 |
8.36 |
33.84 |
21.99 |
1.98 |
5 |
|
WSR33 |
20220108 |
Sunny |
Moderate |
Mid-Ebb |
M |
3.85 |
16:25 |
8.31 |
8.37 |
33.76 |
21.97 |
2.31 |
7 |
|
WSR33 |
20220108 |
Sunny |
Moderate |
Mid-Ebb |
B |
6.7 |
16:24 |
8.48 |
8.31 |
33.79 |
21.99 |
2.52 |
4 |
|
WSR33 |
20220108 |
Sunny |
Moderate |
Mid-Ebb |
B |
6.7 |
16:24 |
8.42 |
8.35 |
33.9 |
21.97 |
2.22 |
5 |
|
WSR33 |
20220111 |
Sunny |
Moderate |
Mid-Ebb |
S |
1 |
12:55 |
8.51 |
8.3 |
34.11 |
20.1 |
2.23 |
3 |
|
WSR33 |
20220111 |
Sunny |
Moderate |
Mid-Ebb |
S |
1 |
12:55 |
8.63 |
8.27 |
34.09 |
20.11 |
2.19 |
3 |
|
WSR33 |
20220111 |
Sunny |
Moderate |
Mid-Ebb |
M |
3.85 |
12:54 |
8.7 |
8.33 |
34.14 |
20.11 |
1.94 |
4 |
|
WSR33 |
20220111 |
Sunny |
Moderate |
Mid-Ebb |
M |
3.85 |
12:54 |
8.62 |
8.34 |
34.08 |
19.92 |
2.11 |
3 |
|
WSR33 |
20220111 |
Sunny |
Moderate |
Mid-Ebb |
B |
6.7 |
12:53 |
8.71 |
8.32 |
34.26 |
19.9 |
2.05 |
5 |
|
WSR33 |
20220111 |
Sunny |
Moderate |
Mid-Ebb |
B |
6.7 |
12:53 |
8.76 |
8.3 |
34.32 |
19.97 |
1.75 |
5 |
|
WSR33 |
20220113 |
Cloudy |
Moderate |
Mid-Ebb |
S |
1 |
9:10 |
8.07 |
8.11 |
32.57 |
20.46 |
3.27 |
6 |
|
WSR33 |
20220113 |
Cloudy |
Moderate |
Mid-Ebb |
S |
1 |
9:10 |
8.33 |
8.22 |
32.49 |
20.3 |
3.13 |
4 |
|
WSR33 |
20220113 |
Cloudy |
Moderate |
Mid-Ebb |
M |
3.8 |
9:09 |
8 |
8.17 |
32.49 |
20.3 |
3.17 |
5 |
|
WSR33 |
20220113 |
Cloudy |
Moderate |
Mid-Ebb |
M |
3.8 |
9:09 |
8.08 |
8.14 |
32.47 |
20.42 |
2.74 |
3 |
|
WSR33 |
20220113 |
Cloudy |
Moderate |
Mid-Ebb |
B |
6.6 |
9:08 |
8 |
8.22 |
32.44 |
20.28 |
2.33 |
5 |
|
WSR33 |
20220113 |
Cloudy |
Moderate |
Mid-Ebb |
B |
6.6 |
9:08 |
8.49 |
8.21 |
32.46 |
20.39 |
2.48 |
2.5 |
|
Location |
Date |
Weather |
Sea Conidtion |
Tidal |
Water Level |
Depth
(m) |
Time |
DO (mg/L) |
pH |
Sal (ppt) |
Temp (�XC) |
Turbidty (NTU) |
SS
(mg/L) |
|
WSR33 |
20220115 |
Cloudy |
Moderate |
Mid-Ebb |
S |
1 |
11:15 |
8.34 |
8.28 |
32.49 |
20.86 |
2.96 |
2.5 |
|
WSR33 |
20220115 |
Cloudy |
Moderate |
Mid-Ebb |
S |
1 |
11:15 |
8.42 |
8.25 |
32.48 |
20.91 |
2.85 |
2.5 |
|
WSR33 |
20220115 |
Cloudy |
Moderate |
Mid-Ebb |
M |
3.55 |
11:14 |
8.44 |
8.29 |
32.56 |
20.96 |
2.56 |
2.5 |
|
WSR33 |
20220115 |
Cloudy |
Moderate |
Mid-Ebb |
M |
3.55 |
11:14 |
8.44 |
8.28 |
32.46 |
20.84 |
2.99 |
2.5 |
|
WSR33 |
20220115 |
Cloudy |
Moderate |
Mid-Ebb |
B |
6.1 |
11:13 |
8.33 |
8.27 |
32.47 |
20.94 |
2.58 |
4 |
|
WSR33 |
20220115 |
Cloudy |
Moderate |
Mid-Ebb |
B |
6.1 |
11:13 |
8.33 |
8.26 |
32.52 |
20.84 |
2.53 |
4 |
|
WSR33 |
20220118 |
Cloudy |
Moderate |
Mid-Ebb |
S |
1 |
10:47 |
8.85 |
8.14 |
34.05 |
20.98 |
4.11 |
2.5 |
|
WSR33 |
20220118 |
Cloudy |
Moderate |
Mid-Ebb |
S |
1 |
10:47 |
8.81 |
8.1 |
33.87 |
20.92 |
3.8 |
3 |
|
WSR33 |
20220118 |
Cloudy |
Moderate |
Mid-Ebb |
M |
3.7 |
10:46 |
8.86 |
8.07 |
33.9 |
20.87 |
4.15 |
2.5 |
|
WSR33 |
20220118 |
Cloudy |
Moderate |
Mid-Ebb |
M |
3.7 |
10:46 |
8.91 |
8.14 |
33.95 |
20.94 |
4.21 |
3 |
|
WSR33 |
20220118 |
Cloudy |
Moderate |
Mid-Ebb |
B |
6.4 |
10:45 |
8.85 |
8.14 |
33.93 |
20.99 |
3.91 |
6 |
|
WSR33 |
20220118 |
Cloudy |
Moderate |
Mid-Ebb |
B |
6.4 |
10:45 |
8.85 |
8.04 |
33.89 |
21 |
3.31 |
6 |
|
WSR33 |
20220120 |
Sunny |
Moderate |
Mid-Ebb |
S |
1 |
12:57 |
8.61 |
8.28 |
33.95 |
21.01 |
3.3 |
10 |
|
WSR33 |
20220120 |
Sunny |
Moderate |
Mid-Ebb |
S |
1 |
12:57 |
8.6 |
8.23 |
34.21 |
20.96 |
3.29 |
11 |
|
WSR33 |
20220120 |
Sunny |
Moderate |
Mid-Ebb |
M |
3.65 |
12:56 |
8.6 |
8.26 |
34.06 |
21 |
3.17 |
8 |
|
WSR33 |
20220120 |
Sunny |
Moderate |
Mid-Ebb |
M |
3.65 |
12:56 |
8.66 |
8.24 |
33.92 |
20.92 |
3.57 |
9 |
|
WSR33 |
20220120 |
Sunny |
Moderate |
Mid-Ebb |
B |
6.3 |
12:55 |
8.65 |
8.31 |
33.95 |
20.97 |
2.48 |
8 |
|
WSR33 |
20220120 |
Sunny |
Moderate |
Mid-Ebb |
B |
6.3 |
12:55 |
8.57 |
8.31 |
34.08 |
20.95 |
2.8 |
6 |
|
WSR33 |
20220122 |
Cloudy |
Moderate |
Mid-Ebb |
S |
1 |
14:27 |
8.83 |
8.21 |
32.94 |
21.44 |
2.72 |
2.5 |
|
WSR33 |
20220122 |
Cloudy |
Moderate |
Mid-Ebb |
S |
1 |
14:27 |
8.87 |
8.27 |
32.97 |
21.55 |
2.8 |
2.5 |
|
WSR33 |
20220122 |
Cloudy |
Moderate |
Mid-Ebb |
M |
3.65 |
14:26 |
8.72 |
8.21 |
33.11 |
21.56 |
2.1 |
5 |
|
WSR33 |
20220122 |
Cloudy |
Moderate |
Mid-Ebb |
M |
3.65 |
14:26 |
8.84 |
8.26 |
33.02 |
21.56 |
2.2 |
4 |
|
WSR33 |
20220122 |
Cloudy |
Moderate |
Mid-Ebb |
B |
6.3 |
14:25 |
8.83 |
8.21 |
33.1 |
21.55 |
2.31 |
7 |
|
WSR33 |
20220122 |
Cloudy |
Moderate |
Mid-Ebb |
B |
6.3 |
14:25 |
8.82 |
8.25 |
33.06 |
21.57 |
2.11 |
8 |
|
WSR33 |
20220125 |
Cloudy |
Moderate |
Mid-Ebb |
S |
1 |
16:46 |
9 |
8.16 |
31.72 |
21.11 |
2.65 |
4 |
|
WSR33 |
20220125 |
Cloudy |
Moderate |
Mid-Ebb |
S |
1 |
16:46 |
9.02 |
8.05 |
31.8 |
21.05 |
2.43 |
3 |
|
Location |
Date |
Weather |
Sea Conidtion |
Tidal |
Water Level |
Depth
(m) |
Time |
DO (mg/L) |
pH |
Sal (ppt) |
Temp (�XC) |
Turbidty (NTU) |
SS
(mg/L) |
|
WSR33 |
20220125 |
Cloudy |
Moderate |
Mid-Ebb |
M |
3.85 |
16:45 |
8.96 |
8.1 |
31.63 |
21.06 |
2.65 |
2.5 |
|
WSR33 |
20220125 |
Cloudy |
Moderate |
Mid-Ebb |
M |
3.85 |
16:45 |
8.96 |
8.08 |
31.72 |
21.08 |
2.67 |
2.5 |
|
WSR33 |
20220125 |
Cloudy |
Moderate |
Mid-Ebb |
B |
6.7 |
16:44 |
9.06 |
8.12 |
31.68 |
21.01 |
2.12 |
4 |
|
WSR33 |
20220125 |
Cloudy |
Moderate |
Mid-Ebb |
B |
6.7 |
16:44 |
8.95 |
8.02 |
31.81 |
21.06 |
2.28 |
5 |
|
WSR33 |
20220127 |
Cloudy |
Moderate |
Mid-Ebb |
S |
1 |
9:09 |
9.03 |
8.12 |
31.21 |
20.45 |
3.18 |
16 |
|
WSR33 |
20220127 |
Cloudy |
Moderate |
Mid-Ebb |
S |
1 |
9:09 |
9.02 |
8.12 |
31.14 |
20.45 |
3.07 |
16 |
|
WSR33 |
20220127 |
Cloudy |
Moderate |
Mid-Ebb |
M |
3.7 |
9:08 |
8.92 |
8.11 |
31.16 |
20.51 |
2.33 |
6 |
|
WSR33 |
20220127 |
Cloudy |
Moderate |
Mid-Ebb |
M |
3.7 |
9:08 |
9.02 |
8.03 |
31.09 |
20.43 |
2.71 |
4 |
|
WSR33 |
20220127 |
Cloudy |
Moderate |
Mid-Ebb |
B |
6.4 |
9:07 |
8.93 |
8.15 |
31.12 |
20.43 |
2.23 |
10 |
|
WSR33 |
20220127 |
Cloudy |
Moderate |
Mid-Ebb |
B |
6.4 |
9:07 |
9.12 |
8.05 |
31.26 |
20.49 |
2.04 |
10 |
|
WSR33 |
20220129 |
Cloudy |
Moderate |
Mid-Ebb |
S |
1 |
9:26 |
9.37 |
8.2 |
30.42 |
20.23 |
3.05 |
3 |
|
WSR33 |
20220129 |
Cloudy |
Moderate |
Mid-Ebb |
S |
1 |
9:26 |
9.28 |
8.2 |
30.38 |
20.12 |
2.86 |
3 |
|
WSR33 |
20220129 |
Cloudy |
Moderate |
Mid-Ebb |
M |
3.6 |
9:25 |
9.35 |
8.3 |
30.5 |
20.07 |
3.32 |
5 |
|
WSR33 |
20220129 |
Cloudy |
Moderate |
Mid-Ebb |
M |
3.6 |
9:25 |
9.39 |
8.24 |
30.51 |
20.05 |
3.32 |
4 |
|
WSR33 |
20220129 |
Cloudy |
Moderate |
Mid-Ebb |
B |
6.2 |
9:24 |
9.27 |
8.26 |
30.56 |
20.1 |
2.69 |
10 |
|
WSR33 |
20220129 |
Cloudy |
Moderate |
Mid-Ebb |
B |
6.2 |
9:24 |
9.29 |
8.21 |
30.61 |
20.23 |
2.42 |
8 |
|
WSR33 |
20220131 |
Cloudy |
Moderate |
Mid-Ebb |
S |
1 |
11:20 |
8.72 |
7.95 |
33.41 |
20.15 |
2.66 |
4 |
|
WSR33 |
20220131 |
Cloudy |
Moderate |
Mid-Ebb |
S |
1 |
11:20 |
8.73 |
7.99 |
33.31 |
20.42 |
2.58 |
3 |
|
WSR33 |
20220131 |
Cloudy |
Moderate |
Mid-Ebb |
M |
3.65 |
11:19 |
8.62 |
8.02 |
33.4 |
20.22 |
2.06 |
12 |
|
WSR33 |
20220131 |
Cloudy |
Moderate |
Mid-Ebb |
M |
3.65 |
11:19 |
8.78 |
7.97 |
33.39 |
20.21 |
2.41 |
12 |
|
WSR33 |
20220131 |
Cloudy |
Moderate |
Mid-Ebb |
B |
6.3 |
11:18 |
8.81 |
7.94 |
33.44 |
20.23 |
2.25 |
5 |
|
WSR33 |
20220131 |
Cloudy |
Moderate |
Mid-Ebb |
B |
6.3 |
11:18 |
8.68 |
7.96 |
33.27 |
20.42 |
2.22 |
3 |
|
WSR36 |
20220101 |
Cloudy |
Moderate |
Mid-Ebb |
S |
1 |
10:19 |
8.64 |
8.22 |
33.32 |
22.21 |
3.02 |
5 |
|
WSR36 |
20220101 |
Cloudy |
Moderate |
Mid-Ebb |
S |
1 |
10:19 |
8.48 |
8.24 |
33.29 |
22.08 |
3.09 |
5 |
|
WSR36 |
20220101 |
Cloudy |
Moderate |
Mid-Ebb |
M |
3.05 |
10:19 |
8.44 |
8.25 |
33.4 |
22.15 |
2.54 |
5 |
|
WSR36 |
20220101 |
Cloudy |
Moderate |
Mid-Ebb |
M |
3.05 |
10:19 |
8.62 |
8.25 |
33.22 |
22.06 |
2.4 |
6 |
|
Location |
Date |
Weather |
Sea Conidtion |
Tidal |
Water Level |
Depth
(m) |
Time |
DO (mg/L) |
pH |
Sal (ppt) |
Temp (�XC) |
Turbidty (NTU) |
SS
(mg/L) |
|
WSR36 |
20220101 |
Cloudy |
Moderate |
Mid-Ebb |
B |
5.1 |
10:18 |
8.45 |
8.22 |
33.27 |
22.23 |
1.99 |
6 |
|
WSR36 |
20220101 |
Cloudy |
Moderate |
Mid-Ebb |
B |
5.1 |
10:18 |
8.65 |
8.24 |
33.25 |
22.09 |
2.31 |
5 |
|
WSR36 |
20220104 |
Sunny |
Moderate |
Mid-Ebb |
S |
1 |
12:39 |
8.28 |
8.27 |
32.11 |
22.92 |
2.79 |
4 |
|
WSR36 |
20220104 |
Sunny |
Moderate |
Mid-Ebb |
S |
1 |
12:39 |
8.21 |
8.21 |
32.02 |
22.88 |
2.41 |
3 |
|
WSR36 |
20220104 |
Sunny |
Moderate |
Mid-Ebb |
M |
3.4 |
12:39 |
8.21 |
8.26 |
31.93 |
22.8 |
2.16 |
4 |
|
WSR36 |
20220104 |
Sunny |
Moderate |
Mid-Ebb |
M |
3.4 |
12:39 |
8.37 |
8.27 |
32.11 |
22.82 |
2.04 |
8 |
|
WSR36 |
20220104 |
Sunny |
Moderate |
Mid-Ebb |
B |
5.8 |
12:38 |
8.26 |
8.21 |
31.92 |
22.87 |
1.9 |
6 |
|
WSR36 |
20220104 |
Sunny |
Moderate |
Mid-Ebb |
B |
5.8 |
12:38 |
8.36 |
8.23 |
31.98 |
22.78 |
1.83 |
6 |
|
WSR36 |
20220106 |
Sunny |
Moderate |
Mid-Ebb |
S |
1 |
14:27 |
8.56 |
8.16 |
31.74 |
23.12 |
4.01 |
3 |
|
WSR36 |
20220106 |
Sunny |
Moderate |
Mid-Ebb |
S |
1 |
14:27 |
8.36 |
8.13 |
31.75 |
23.04 |
3.71 |
5 |
|
WSR36 |
20220106 |
Sunny |
Moderate |
Mid-Ebb |
M |
3.05 |
14:27 |
8.4 |
8.13 |
31.86 |
23.07 |
3.53 |
7 |
|
WSR36 |
20220106 |
Sunny |
Moderate |
Mid-Ebb |
M |
3.05 |
14:27 |
8.5 |
8.14 |
31.75 |
23.02 |
3.25 |
7 |
|
WSR36 |
20220106 |
Sunny |
Moderate |
Mid-Ebb |
B |
5.1 |
14:26 |
8.37 |
8.1 |
31.78 |
23.11 |
3.02 |
5 |
|
WSR36 |
20220106 |
Sunny |
Moderate |
Mid-Ebb |
B |
5.1 |
14:26 |
8.45 |
8.16 |
31.86 |
23.12 |
3.49 |
3 |
|
WSR36 |
20220108 |
Sunny |
Moderate |
Mid-Ebb |
S |
1 |
16:11 |
8.76 |
8.41 |
34.05 |
22.06 |
2.54 |
4 |
|
WSR36 |
20220108 |
Sunny |
Moderate |
Mid-Ebb |
S |
1 |
16:11 |
8.79 |
8.41 |
33.9 |
22.03 |
2.72 |
6 |
|
WSR36 |
20220108 |
Sunny |
Moderate |
Mid-Ebb |
M |
3.55 |
16:11 |
8.83 |
8.38 |
33.92 |
22.04 |
2.63 |
4 |
|
WSR36 |
20220108 |
Sunny |
Moderate |
Mid-Ebb |
M |
3.55 |
16:11 |
8.71 |
8.41 |
33.96 |
22.11 |
2.21 |
4 |
|
WSR36 |
20220108 |
Sunny |
Moderate |
Mid-Ebb |
B |
6.1 |
16:10 |
8.74 |
8.38 |
33.96 |
22.11 |
2.54 |
4 |
|
WSR36 |
20220108 |
Sunny |
Moderate |
Mid-Ebb |
B |
6.1 |
16:10 |
8.69 |
8.37 |
33.98 |
22.04 |
2.21 |
5 |
|
WSR36 |
20220111 |
Sunny |
Moderate |
Mid-Ebb |
S |
1 |
12:41 |
8.9 |
8.32 |
34.48 |
20 |
2.44 |
5 |
|
WSR36 |
20220111 |
Sunny |
Moderate |
Mid-Ebb |
S |
1 |
12:41 |
8.82 |
8.38 |
34.72 |
19.89 |
2.87 |
4 |
|
WSR36 |
20220111 |
Sunny |
Moderate |
Mid-Ebb |
M |
3.4 |
12:41 |
8.88 |
8.35 |
34.51 |
19.96 |
2.4 |
3 |
|
WSR36 |
20220111 |
Sunny |
Moderate |
Mid-Ebb |
M |
3.4 |
12:41 |
8.86 |
8.35 |
34.65 |
19.96 |
2.77 |
4 |
|
WSR36 |
20220111 |
Sunny |
Moderate |
Mid-Ebb |
B |
5.8 |
12:40 |
8.79 |
8.34 |
34.74 |
19.87 |
2.3 |
4 |
|
WSR36 |
20220111 |
Sunny |
Moderate |
Mid-Ebb |
B |
5.8 |
12:40 |
8.85 |
8.38 |
34.63 |
19.98 |
2.06 |
3 |
|
Location |
Date |
Weather |
Sea Conidtion |
Tidal |
Water Level |
Depth
(m) |
Time |
DO (mg/L) |
pH |
Sal (ppt) |
Temp (�XC) |
Turbidty (NTU) |
SS
(mg/L) |
|
WSR36 |
20220113 |
Cloudy |
Moderate |
Mid-Ebb |
S |
1 |
8:54 |
8.51 |
8.16 |
33.04 |
20.36 |
3.2 |
4 |
|
WSR36 |
20220113 |
Cloudy |
Moderate |
Mid-Ebb |
S |
1 |
8:54 |
8.53 |
8.24 |
32.93 |
20.35 |
3.46 |
2.5 |
|
WSR36 |
20220113 |
Cloudy |
Moderate |
Mid-Ebb |
M |
3.3 |
8:54 |
8.54 |
8.22 |
32.95 |
20.22 |
2.9 |
2.5 |
|
WSR36 |
20220113 |
Cloudy |
Moderate |
Mid-Ebb |
M |
3.3 |
8:54 |
8.6 |
8.25 |
32.97 |
20.29 |
3.11 |
3 |
|
WSR36 |
20220113 |
Cloudy |
Moderate |
Mid-Ebb |
B |
5.6 |
8:53 |
8.5 |
8.29 |
33.05 |
20.19 |
2.62 |
4 |
|
WSR36 |
20220113 |
Cloudy |
Moderate |
Mid-Ebb |
B |
5.6 |
8:53 |
8.58 |
8.19 |
32.95 |
20.28 |
2.37 |
3 |
|
WSR36 |
20220115 |
Cloudy |
Moderate |
Mid-Ebb |
S |
1 |
11:01 |
8.74 |
8.22 |
32.39 |
21.22 |
3.48 |
2.5 |
|
WSR36 |
20220115 |
Cloudy |
Moderate |
Mid-Ebb |
S |
1 |
11:01 |
8.73 |
8.2 |
32.36 |
21.16 |
3.11 |
2.5 |
|
WSR36 |
20220115 |
Cloudy |
Moderate |
Mid-Ebb |
M |
3.2 |
11:01 |
8.76 |
8.24 |
32.35 |
21.16 |
3.32 |
3 |
|
WSR36 |
20220115 |
Cloudy |
Moderate |
Mid-Ebb |
M |
3.2 |
11:01 |
8.75 |
8.24 |
32.36 |
21.22 |
3.5 |
3 |
|
WSR36 |
20220115 |
Cloudy |
Moderate |
Mid-Ebb |
B |
5.4 |
11:00 |
8.84 |
8.21 |
32.43 |
21.22 |
3.11 |
2.5 |
|
WSR36 |
20220115 |
Cloudy |
Moderate |
Mid-Ebb |
B |
5.4 |
11:00 |
8.85 |
8.17 |
32.34 |
21.23 |
2.72 |
2.5 |
|
WSR36 |
20220118 |
Cloudy |
Moderate |
Mid-Ebb |
S |
1 |
10:34 |
8.37 |
8.22 |
32.98 |
21.05 |
3.47 |
3 |
|
WSR36 |
20220118 |
Cloudy |
Moderate |
Mid-Ebb |
S |
1 |
10:34 |
8.37 |
8.16 |
32.8 |
20.88 |
3.81 |
2.5 |
|
WSR36 |
20220118 |
Cloudy |
Moderate |
Mid-Ebb |
M |
3.7 |
10:34 |
8.36 |
8.22 |
32.87 |
20.8 |
3.47 |
6 |
|
WSR36 |
20220118 |
Cloudy |
Moderate |
Mid-Ebb |
M |
3.7 |
10:34 |
8.36 |
8.26 |
32.89 |
20.87 |
3.25 |
6 |
|
WSR36 |
20220118 |
Cloudy |
Moderate |
Mid-Ebb |
B |
6.4 |
10:33 |
8.42 |
8.24 |
32.88 |
21.03 |
3.18 |
2.5 |
|
WSR36 |
20220118 |
Cloudy |
Moderate |
Mid-Ebb |
B |
6.4 |
10:33 |
8.38 |
8.19 |
32.99 |
20.88 |
3.35 |
3 |
|
WSR36 |
20220120 |
Sunny |
Moderate |
Mid-Ebb |
S |
1 |
12:46 |
8.43 |
8.18 |
33.66 |
20.83 |
4.01 |
7 |
|
WSR36 |
20220120 |
Sunny |
Moderate |
Mid-Ebb |
S |
1 |
12:46 |
8.44 |
8.15 |
33.75 |
20.84 |
3.9 |
5 |
|
WSR36 |
20220120 |
Sunny |
Moderate |
Mid-Ebb |
M |
3.7 |
12:46 |
8.46 |
8.17 |
33.92 |
20.89 |
4.02 |
9 |
|
WSR36 |
20220120 |
Sunny |
Moderate |
Mid-Ebb |
M |
3.7 |
12:46 |
8.46 |
8.18 |
33.89 |
20.82 |
3.84 |
7 |
|
WSR36 |
20220120 |
Sunny |
Moderate |
Mid-Ebb |
B |
6.4 |
12:45 |
8.47 |
8.22 |
33.75 |
20.92 |
3.32 |
5 |
|
WSR36 |
20220120 |
Sunny |
Moderate |
Mid-Ebb |
B |
6.4 |
12:45 |
8.46 |
8.19 |
33.63 |
20.89 |
3.46 |
7 |
|
WSR36 |
20220122 |
Cloudy |
Moderate |
Mid-Ebb |
S |
1 |
14:14 |
8.06 |
8.34 |
32.7 |
21.12 |
3.03 |
3 |
|
WSR36 |
20220122 |
Cloudy |
Moderate |
Mid-Ebb |
S |
1 |
14:14 |
8.12 |
8.37 |
32.58 |
21.11 |
3.3 |
3 |
|
Location |
Date |
Weather |
Sea Conidtion |
Tidal |
Water Level |
Depth
(m) |
Time |
DO (mg/L) |
pH |
Sal (ppt) |
Temp (�XC) |
Turbidty (NTU) |
SS
(mg/L) |
|
WSR36 |
20220122 |
Cloudy |
Moderate |
Mid-Ebb |
M |
3.25 |
14:14 |
8.05 |
8.35 |
32.73 |
21.31 |
3.08 |
5 |
|
WSR36 |
20220122 |
Cloudy |
Moderate |
Mid-Ebb |
M |
3.25 |
14:14 |
8.05 |
8.38 |
32.58 |
21.3 |
3.15 |
5 |
|
WSR36 |
20220122 |
Cloudy |
Moderate |
Mid-Ebb |
B |
5.5 |
14:13 |
8.09 |
8.34 |
32.64 |
21.17 |
2.05 |
3 |
|
WSR36 |
20220122 |
Cloudy |
Moderate |
Mid-Ebb |
B |
5.5 |
14:13 |
8.06 |
8.34 |
32.67 |
21.32 |
2.37 |
3 |
|
WSR36 |
20220125 |
Cloudy |
Moderate |
Mid-Ebb |
S |
1 |
16:34 |
8.76 |
8.23 |
31.54 |
21.01 |
3.14 |
3 |
|
WSR36 |
20220125 |
Cloudy |
Moderate |
Mid-Ebb |
S |
1 |
16:34 |
8.79 |
8.13 |
31.5 |
21.14 |
3.47 |
4 |
|
WSR36 |
20220125 |
Cloudy |
Moderate |
Mid-Ebb |
M |
3.65 |
16:34 |
8.7 |
8.14 |
31.46 |
21.06 |
2.9 |
3 |
|
WSR36 |
20220125 |
Cloudy |
Moderate |
Mid-Ebb |
M |
3.65 |
16:34 |
8.78 |
8.12 |
31.57 |
21.03 |
2.85 |
3 |
|
WSR36 |
20220125 |
Cloudy |
Moderate |
Mid-Ebb |
B |
6.3 |
16:33 |
8.82 |
8.16 |
31.59 |
21.09 |
2.76 |
8 |
|
WSR36 |
20220125 |
Cloudy |
Moderate |
Mid-Ebb |
B |
6.3 |
16:33 |
8.82 |
8.25 |
31.56 |
21.02 |
2.94 |
7 |
|
WSR36 |
20220127 |
Cloudy |
Moderate |
Mid-Ebb |
S |
1 |
8:56 |
8.46 |
8.02 |
31.53 |
20.54 |
2.1 |
4 |
|
WSR36 |
20220127 |
Cloudy |
Moderate |
Mid-Ebb |
S |
1 |
8:56 |
8.33 |
7.94 |
31.49 |
20.5 |
2.49 |
4 |
|
WSR36 |
20220127 |
Cloudy |
Moderate |
Mid-Ebb |
M |
3.75 |
8:56 |
8.39 |
7.98 |
31.51 |
20.41 |
1.85 |
3 |
|
WSR36 |
20220127 |
Cloudy |
Moderate |
Mid-Ebb |
M |
3.75 |
8:56 |
8.34 |
7.94 |
31.4 |
20.37 |
1.84 |
4 |
|
WSR36 |
20220127 |
Cloudy |
Moderate |
Mid-Ebb |
B |
6.5 |
8:55 |
8.38 |
7.96 |
31.55 |
20.43 |
1.91 |
4 |
|
WSR36 |
20220127 |
Cloudy |
Moderate |
Mid-Ebb |
B |
6.5 |
8:55 |
8.33 |
8.04 |
31.45 |
20.37 |
2.03 |
6 |
|
WSR36 |
20220129 |
Cloudy |
Moderate |
Mid-Ebb |
S |
1 |
9:12 |
8.95 |
8.15 |
29.9 |
19.94 |
3.42 |
3 |
|
WSR36 |
20220129 |
Cloudy |
Moderate |
Mid-Ebb |
S |
1 |
9:12 |
9.01 |
8.12 |
30.1 |
19.9 |
3.42 |
5 |
|
WSR36 |
20220129 |
Cloudy |
Moderate |
Mid-Ebb |
M |
3.1 |
9:12 |
9.01 |
8.13 |
30.07 |
19.95 |
3.31 |
9 |
|
WSR36 |
20220129 |
Cloudy |
Moderate |
Mid-Ebb |
M |
3.1 |
9:12 |
8.93 |
8.2 |
30.06 |
19.85 |
3.32 |
9 |
|
WSR36 |
20220129 |
Cloudy |
Moderate |
Mid-Ebb |
B |
5.2 |
9:11 |
8.96 |
8.1 |
30.06 |
19.89 |
3.34 |
5 |
|
WSR36 |
20220129 |
Cloudy |
Moderate |
Mid-Ebb |
B |
5.2 |
9:11 |
8.94 |
8.13 |
30.04 |
19.83 |
2.86 |
4 |
|
WSR36 |
20220131 |
Cloudy |
Moderate |
Mid-Ebb |
S |
1 |
11:04 |
8.36 |
8.03 |
33.68 |
20.33 |
2.39 |
4 |
|
WSR36 |
20220131 |
Cloudy |
Moderate |
Mid-Ebb |
S |
1 |
11:04 |
8.38 |
8.01 |
33.83 |
20.36 |
2.6 |
4 |
|
WSR36 |
20220131 |
Cloudy |
Moderate |
Mid-Ebb |
M |
3.1 |
11:04 |
8.5 |
7.99 |
33.72 |
20.36 |
2.44 |
3 |
|
WSR36 |
20220131 |
Cloudy |
Moderate |
Mid-Ebb |
M |
3.1 |
11:04 |
8.32 |
7.98 |
33.72 |
20.33 |
2.47 |
5 |
|
Location |
Date |
Weather |
Sea Conidtion |
Tidal |
Water Level |
Depth
(m) |
Time |
DO (mg/L) |
pH |
Sal (ppt) |
Temp (�XC) |
Turbidty (NTU) |
SS
(mg/L) |
|
WSR36 |
20220131 |
Cloudy |
Moderate |
Mid-Ebb |
B |
5.2 |
11:03 |
8.38 |
7.99 |
33.67 |
20.33 |
2.51 |
5 |
|
WSR36 |
20220131 |
Cloudy |
Moderate |
Mid-Ebb |
B |
5.2 |
11:03 |
8.33 |
8.04 |
33.78 |
20.42 |
2.58 |
4 |
|
WSR37 |
20220101 |
Cloudy |
Moderate |
Mid-Ebb |
S |
1 |
10:07 |
8.49 |
8.27 |
32.57 |
22.1 |
3.09 |
15 |
|
WSR37 |
20220101 |
Cloudy |
Moderate |
Mid-Ebb |
S |
1 |
10:07 |
8.29 |
8.3 |
32.55 |
22.14 |
3.14 |
15 |
|
WSR37 |
20220101 |
Cloudy |
Moderate |
Mid-Ebb |
M |
4.2 |
10:06 |
8.42 |
8.25 |
32.65 |
22.2 |
2.75 |
7 |
|
WSR37 |
20220101 |
Cloudy |
Moderate |
Mid-Ebb |
M |
4.2 |
10:06 |
8.42 |
8.3 |
32.56 |
22.16 |
2.75 |
6 |
|
WSR37 |
20220101 |
Cloudy |
Moderate |
Mid-Ebb |
B |
7.4 |
10:05 |
8.47 |
8.24 |
32.61 |
22.21 |
1.95 |
7 |
|
WSR37 |
20220101 |
Cloudy |
Moderate |
Mid-Ebb |
B |
7.4 |
10:05 |
8.26 |
8.3 |
32.69 |
22.2 |
2.13 |
3 |
|
WSR37 |
20220104 |
Sunny |
Moderate |
Mid-Ebb |
S |
1 |
12:27 |
8.7 |
8.28 |
32.2 |
22.67 |
2.77 |
4 |
|
WSR37 |
20220104 |
Sunny |
Moderate |
Mid-Ebb |
S |
1 |
12:27 |
8.63 |
8.29 |
32.06 |
22.73 |
2.7 |
5 |
|
WSR37 |
20220104 |
Sunny |
Moderate |
Mid-Ebb |
M |
3.85 |
12:26 |
8.76 |
8.28 |
32.21 |
22.75 |
2.41 |
4 |
|
WSR37 |
20220104 |
Sunny |
Moderate |
Mid-Ebb |
M |
3.85 |
12:26 |
8.66 |
8.28 |
32.14 |
22.7 |
2.61 |
3 |
|
WSR37 |
20220104 |
Sunny |
Moderate |
Mid-Ebb |
B |
6.7 |
12:25 |
8.81 |
8.3 |
32.29 |
22.72 |
2.33 |
4 |
|
WSR37 |
20220104 |
Sunny |
Moderate |
Mid-Ebb |
B |
6.7 |
12:25 |
8.82 |
8.29 |
32.14 |
22.68 |
2.59 |
4 |
|
WSR37 |
20220106 |
Sunny |
Moderate |
Mid-Ebb |
S |
1 |
14:15 |
8.09 |
8.38 |
32.93 |
23.4 |
3.86 |
4 |
|
WSR37 |
20220106 |
Sunny |
Moderate |
Mid-Ebb |
S |
1 |
14:15 |
8.2 |
8.32 |
32.78 |
23.33 |
3.97 |
4 |
|
WSR37 |
20220106 |
Sunny |
Moderate |
Mid-Ebb |
M |
4.05 |
14:14 |
8.16 |
8.32 |
32.94 |
23.36 |
3.94 |
4 |
|
WSR37 |
20220106 |
Sunny |
Moderate |
Mid-Ebb |
M |
4.05 |
14:14 |
8.12 |
8.37 |
32.88 |
23.35 |
3.95 |
2.5 |
|
WSR37 |
20220106 |
Sunny |
Moderate |
Mid-Ebb |
B |
7.1 |
14:13 |
8.16 |
8.35 |
32.8 |
23.37 |
3.88 |
4 |
|
WSR37 |
20220106 |
Sunny |
Moderate |
Mid-Ebb |
B |
7.1 |
14:13 |
8.06 |
8.37 |
32.9 |
23.31 |
3.31 |
4 |
|
WSR37 |
20220108 |
Sunny |
Moderate |
Mid-Ebb |
S |
1 |
15:59 |
8.73 |
8.4 |
34.26 |
21.48 |
2.9 |
6 |
|
WSR37 |
20220108 |
Sunny |
Moderate |
Mid-Ebb |
S |
1 |
15:59 |
8.68 |
8.36 |
34.16 |
21.42 |
2.54 |
6 |
|
WSR37 |
20220108 |
Sunny |
Moderate |
Mid-Ebb |
M |
4.1 |
15:58 |
8.56 |
8.37 |
34.21 |
21.42 |
2.63 |
15 |
|
WSR37 |
20220108 |
Sunny |
Moderate |
Mid-Ebb |
M |
4.1 |
15:58 |
8.65 |
8.36 |
34.13 |
21.44 |
2.38 |
15 |
|
WSR37 |
20220108 |
Sunny |
Moderate |
Mid-Ebb |
B |
7.2 |
15:57 |
8.58 |
8.32 |
34.18 |
21.44 |
2.13 |
27 |
|
WSR37 |
20220108 |
Sunny |
Moderate |
Mid-Ebb |
B |
7.2 |
15:57 |
8.73 |
8.36 |
34.29 |
21.44 |
2.48 |
26 |
|
Location |
Date |
Weather |
Sea Conidtion |
Tidal |
Water Level |
Depth
(m) |
Time |
DO (mg/L) |
pH |
Sal (ppt) |
Temp (�XC) |
Turbidty (NTU) |
SS
(mg/L) |
|
WSR37 |
20220111 |
Sunny |
Moderate |
Mid-Ebb |
S |
1 |
12:21 |
8.85 |
8.25 |
33.91 |
19.95 |
2.64 |
5 |
|
WSR37 |
20220111 |
Sunny |
Moderate |
Mid-Ebb |
S |
1 |
12:21 |
8.79 |
8.34 |
33.96 |
20.15 |
2.77 |
3 |
|
WSR37 |
20220111 |
Sunny |
Moderate |
Mid-Ebb |
M |
3.95 |
12:20 |
8.92 |
8.34 |
33.91 |
19.96 |
2.7 |
3 |
|
WSR37 |
20220111 |
Sunny |
Moderate |
Mid-Ebb |
M |
3.95 |
12:20 |
8.97 |
8.37 |
33.72 |
20 |
2.6 |
3 |
|
WSR37 |
20220111 |
Sunny |
Moderate |
Mid-Ebb |
B |
6.9 |
12:19 |
8.85 |
8.27 |
33.93 |
19.96 |
2.48 |
3 |
|
WSR37 |
20220111 |
Sunny |
Moderate |
Mid-Ebb |
B |
6.9 |
12:19 |
8.92 |
8.28 |
33.73 |
20.14 |
2.53 |
4 |
|
WSR37 |
20220113 |
Cloudy |
Moderate |
Mid-Ebb |
S |
1 |
8:39 |
8.34 |
8.17 |
33.25 |
20.23 |
3.15 |
2.5 |
|
WSR37 |
20220113 |
Cloudy |
Moderate |
Mid-Ebb |
S |
1 |
8:39 |
8.28 |
8.2 |
33.28 |
20.39 |
3.07 |
2.5 |
|
WSR37 |
20220113 |
Cloudy |
Moderate |
Mid-Ebb |
M |
3.95 |
8:38 |
8.36 |
8.19 |
33.26 |
20.26 |
3.39 |
2.5 |
|
WSR37 |
20220113 |
Cloudy |
Moderate |
Mid-Ebb |
M |
3.95 |
8:38 |
8.42 |
8.16 |
33.31 |
20.21 |
3.65 |
3 |
|
WSR37 |
20220113 |
Cloudy |
Moderate |
Mid-Ebb |
B |
6.9 |
8:37 |
8.27 |
8.25 |
33.26 |
20.4 |
3.27 |
4 |
|
WSR37 |
20220113 |
Cloudy |
Moderate |
Mid-Ebb |
B |
6.9 |
8:37 |
8.29 |
8.18 |
33.35 |
20.33 |
3.36 |
3 |
|
WSR37 |
20220115 |
Cloudy |
Moderate |
Mid-Ebb |
S |
1 |
10:48 |
9.06 |
8.25 |
33.49 |
21.06 |
3.3 |
3 |
|
WSR37 |
20220115 |
Cloudy |
Moderate |
Mid-Ebb |
S |
1 |
10:48 |
9.05 |
8.23 |
33.54 |
21.16 |
3.45 |
3 |
|
WSR37 |
20220115 |
Cloudy |
Moderate |
Mid-Ebb |
M |
4.4 |
10:47 |
9.14 |
8.27 |
33.55 |
21.18 |
3.4 |
3 |
|
WSR37 |
20220115 |
Cloudy |
Moderate |
Mid-Ebb |
M |
4.4 |
10:47 |
9.12 |
8.24 |
33.49 |
21.2 |
3.68 |
3 |
|
WSR37 |
20220115 |
Cloudy |
Moderate |
Mid-Ebb |
B |
7.8 |
10:46 |
9.07 |
8.28 |
33.55 |
21.19 |
3.22 |
8 |
|
WSR37 |
20220115 |
Cloudy |
Moderate |
Mid-Ebb |
B |
7.8 |
10:46 |
9.14 |
8.26 |
33.58 |
21.18 |
2.96 |
8 |
|
WSR37 |
20220118 |
Cloudy |
Moderate |
Mid-Ebb |
S |
1 |
10:23 |
8.63 |
8.24 |
33.05 |
20.56 |
3.5 |
5 |
|
WSR37 |
20220118 |
Cloudy |
Moderate |
Mid-Ebb |
S |
1 |
10:23 |
8.65 |
8.14 |
32.99 |
20.4 |
3.71 |
4 |
|
WSR37 |
20220118 |
Cloudy |
Moderate |
Mid-Ebb |
M |
4.15 |
10:22 |
8.65 |
8.15 |
33.05 |
20.6 |
3.86 |
3 |
|
WSR37 |
20220118 |
Cloudy |
Moderate |
Mid-Ebb |
M |
4.15 |
10:22 |
8.66 |
8.21 |
33.16 |
20.63 |
3.47 |
4 |
|
WSR37 |
20220118 |
Cloudy |
Moderate |
Mid-Ebb |
B |
7.3 |
10:21 |
8.72 |
8.21 |
33.07 |
20.59 |
3.76 |
3 |
|
WSR37 |
20220118 |
Cloudy |
Moderate |
Mid-Ebb |
B |
7.3 |
10:21 |
8.72 |
8.16 |
33.01 |
20.58 |
3.61 |
2.5 |
|
WSR37 |
20220120 |
Sunny |
Moderate |
Mid-Ebb |
S |
1 |
12:37 |
8.58 |
8.3 |
33.63 |
21.01 |
3.57 |
7 |
|
WSR37 |
20220120 |
Sunny |
Moderate |
Mid-Ebb |
S |
1 |
12:37 |
8.65 |
8.3 |
33.6 |
21.01 |
3.9 |
9 |
|
WSR37 |
20220120 |
Sunny |
Moderate |
Mid-Ebb |
M |
3.9 |
12:36 |
8.59 |
8.24 |
33.26 |
21.03 |
3.04 |
4 |
|
WSR37 |
20220120 |
Sunny |
Moderate |
Mid-Ebb |
M |
3.9 |
12:36 |
8.61 |
8.27 |
33.39 |
20.98 |
3.18 |
6 |
|
WSR37 |
20220120 |
Sunny |
Moderate |
Mid-Ebb |
B |
6.8 |
12:35 |
8.55 |
8.23 |
33.46 |
21.04 |
2.84 |
10 |
|
Location |
Date |
Weather |
Sea Conidtion |
Tidal |
Water Level |
Depth
(m) |
Time |
DO (mg/L) |
pH |
Sal (ppt) |
Temp (�XC) |
Turbidty (NTU) |
SS
(mg/L) |
|
WSR37 |
20220120 |
Sunny |
Moderate |
Mid-Ebb |
B |
6.8 |
12:35 |
8.54 |
8.28 |
33.34 |
21.04 |
3.27 |
11 |
|
WSR37 |
20220122 |
Cloudy |
Moderate |
Mid-Ebb |
S |
1 |
14:02 |
8.7 |
8.2 |
32.84 |
21.28 |
2.5 |
3 |
|
WSR37 |
20220122 |
Cloudy |
Moderate |
Mid-Ebb |
S |
1 |
14:02 |
8.76 |
8.24 |
32.76 |
21.38 |
2.65 |
2.5 |
|
WSR37 |
20220122 |
Cloudy |
Moderate |
Mid-Ebb |
M |
4.25 |
14:01 |
8.63 |
8.25 |
32.82 |
21.23 |
1.91 |
4 |
|
WSR37 |
20220122 |
Cloudy |
Moderate |
Mid-Ebb |
M |
4.25 |
14:01 |
8.63 |
8.24 |
32.78 |
21.28 |
1.63 |
4 |
|
WSR37 |
20220122 |
Cloudy |
Moderate |
Mid-Ebb |
B |
7.5 |
14:00 |
8.72 |
8.23 |
32.74 |
21.31 |
1.6 |
3 |
|
WSR37 |
20220122 |
Cloudy |
Moderate |
Mid-Ebb |
B |
7.5 |
14:00 |
8.71 |
8.17 |
32.72 |
21.44 |
1.88 |
3 |
|
WSR37 |
20220125 |
Cloudy |
Moderate |
Mid-Ebb |
S |
1 |
16:22 |
8.69 |
8.24 |
31.33 |
21.09 |
2.73 |
3 |
|
WSR37 |
20220125 |
Cloudy |
Moderate |
Mid-Ebb |
S |
1 |
16:22 |
8.81 |
8.21 |
31.27 |
20.97 |
2.36 |
4 |
|
WSR37 |
20220125 |
Cloudy |
Moderate |
Mid-Ebb |
M |
3.8 |
16:21 |
8.71 |
8.15 |
31.28 |
20.94 |
2.85 |
4 |
|
WSR37 |
20220125 |
Cloudy |
Moderate |
Mid-Ebb |
M |
3.8 |
16:21 |
8.72 |
8.21 |
31.33 |
21.03 |
2.71 |
3 |
|
WSR37 |
20220125 |
Cloudy |
Moderate |
Mid-Ebb |
B |
6.6 |
16:20 |
8.82 |
8.25 |
31.24 |
21.05 |
1.9 |
9 |
|
WSR37 |
20220125 |
Cloudy |
Moderate |
Mid-Ebb |
B |
6.6 |
16:20 |
8.83 |
8.2 |
31.24 |
21.09 |
1.96 |
10 |
|
WSR37 |
20220127 |
Cloudy |
Moderate |
Mid-Ebb |
S |
1 |
8:43 |
9.28 |
8.01 |
31.58 |
20.55 |
2.99 |
4 |
|
WSR37 |
20220127 |
Cloudy |
Moderate |
Mid-Ebb |
S |
1 |
8:43 |
9.23 |
7.94 |
31.64 |
20.6 |
3.46 |
4 |
|
WSR37 |
20220127 |
Cloudy |
Moderate |
Mid-Ebb |
M |
4.4 |
8:42 |
9.33 |
8.03 |
31.63 |
20.6 |
3.07 |
4 |
|
WSR37 |
20220127 |
Cloudy |
Moderate |
Mid-Ebb |
M |
4.4 |
8:42 |
9.29 |
8 |
31.64 |
20.57 |
2.73 |
4 |
|
WSR37 |
20220127 |
Cloudy |
Moderate |
Mid-Ebb |
B |
7.8 |
8:41 |
9.2 |
8.02 |
31.49 |
20.57 |
2.42 |
3 |
|
WSR37 |
20220127 |
Cloudy |
Moderate |
Mid-Ebb |
B |
7.8 |
8:41 |
9.27 |
7.97 |
31.51 |
20.56 |
2.73 |
4 |
|
WSR37 |
20220129 |
Cloudy |
Moderate |
Mid-Ebb |
S |
1 |
8:59 |
9.28 |
8.22 |
30.28 |
20.25 |
3.05 |
3 |
|
WSR37 |
20220129 |
Cloudy |
Moderate |
Mid-Ebb |
S |
1 |
8:59 |
9.23 |
8.26 |
30.25 |
20.3 |
3.07 |
3 |
|
WSR37 |
20220129 |
Cloudy |
Moderate |
Mid-Ebb |
M |
3.85 |
8:58 |
9.33 |
8.29 |
30.16 |
20.26 |
3.36 |
2.5 |
|
WSR37 |
20220129 |
Cloudy |
Moderate |
Mid-Ebb |
M |
3.85 |
8:58 |
9.26 |
8.17 |
30.2 |
20.25 |
3.22 |
2.5 |
|
WSR37 |
20220129 |
Cloudy |
Moderate |
Mid-Ebb |
B |
6.7 |
8:57 |
9.32 |
8.22 |
30.15 |
20.2 |
3.2 |
4 |
|
WSR37 |
20220129 |
Cloudy |
Moderate |
Mid-Ebb |
B |
6.7 |
8:57 |
9.27 |
8.18 |
30.12 |
20.19 |
3.03 |
2.5 |
|
WSR37 |
20220131 |
Cloudy |
Moderate |
Mid-Ebb |
S |
1 |
10:51 |
7.97 |
8.15 |
33.14 |
20.31 |
2.58 |
5 |
|
WSR37 |
20220131 |
Cloudy |
Moderate |
Mid-Ebb |
S |
1 |
10:51 |
8.11 |
8.21 |
33.19 |
20.27 |
2.51 |
4 |
|
WSR37 |
20220131 |
Cloudy |
Moderate |
Mid-Ebb |
M |
4.35 |
10:50 |
7.97 |
8.16 |
33.06 |
20.13 |
2.56 |
3 |
|
WSR37 |
20220131 |
Cloudy |
Moderate |
Mid-Ebb |
M |
4.35 |
10:50 |
7.99 |
8.11 |
33.14 |
20.17 |
2.31 |
5 |
|
WSR37 |
20220131 |
Cloudy |
Moderate |
Mid-Ebb |
B |
7.7 |
10:49 |
7.92 |
8.12 |
33.16 |
20.17 |
1.94 |
3 |
|
WSR37 |
20220131 |
Cloudy |
Moderate |
Mid-Ebb |
B |
7.7 |
10:49 |
7.91 |
8.17 |
33.13 |
20.17 |
1.8 |
4 |
Appendix M
HOKLAS Laboratory Certificate
Appendix N
Water Quality and
Landfill Gas Equipment Calibration Certificate
|
Equipment |
Model |
Serial Number |
Calibration Date |
Calibration Expiry
Date* |
|
Multi-Functional Meter |
Horiba U-53 |
NEKVM2XU |
15/12/2021 |
14/01/2022 |
|
Multi-Functional Meter |
Horiba U-53 |
S2A98W8H |
11/01/2022 |
10/02/2022 |
Remarks*: All in situ monitoring instruments will be
checked, calibrated and certified by laboratory accredited under HOKLAS or any
other international accreditation scheme before use, and subsequently re-calibrated at monthly
intervals throughout the stages of water quality
monitoring, as per requirements in the EM&A
Manual Clause 5.1.3.
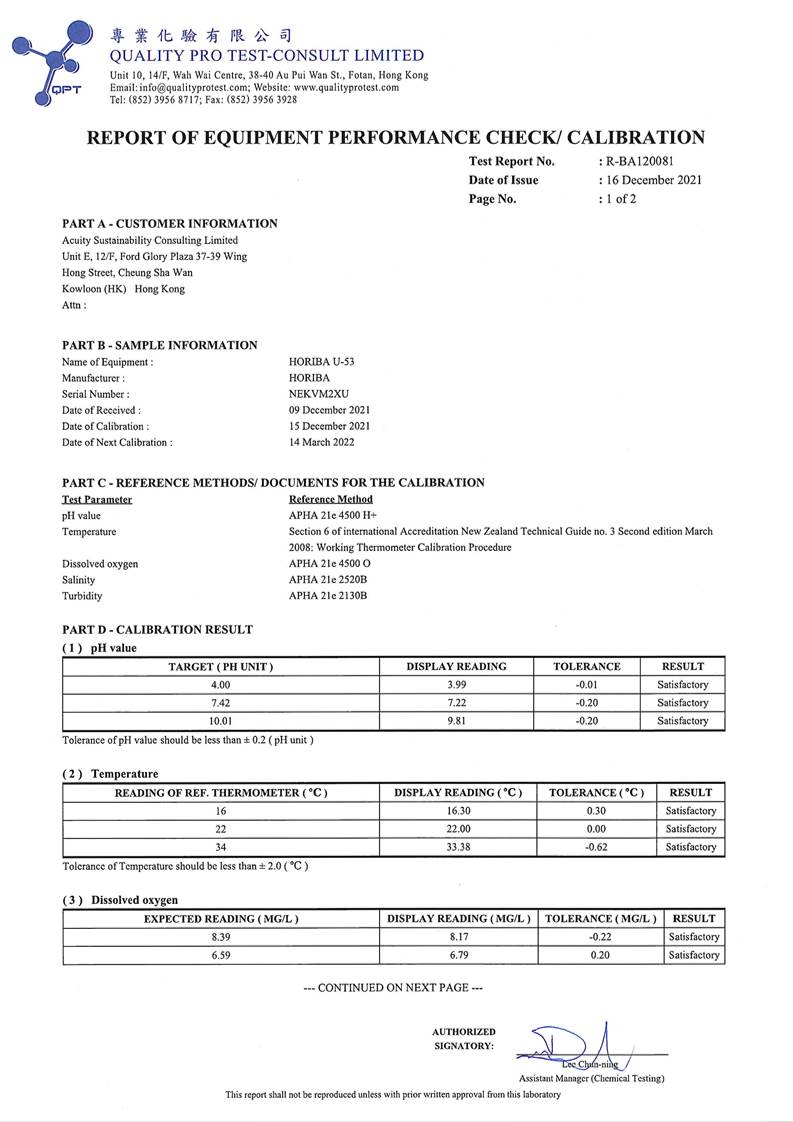
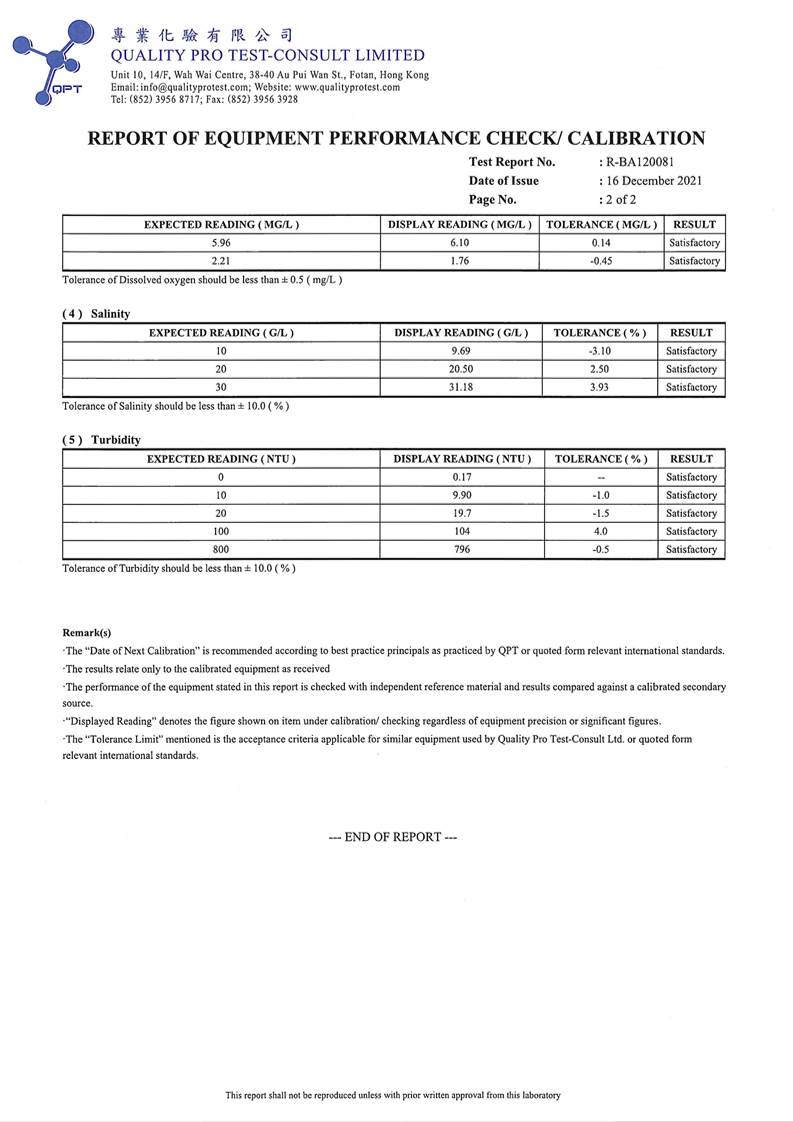
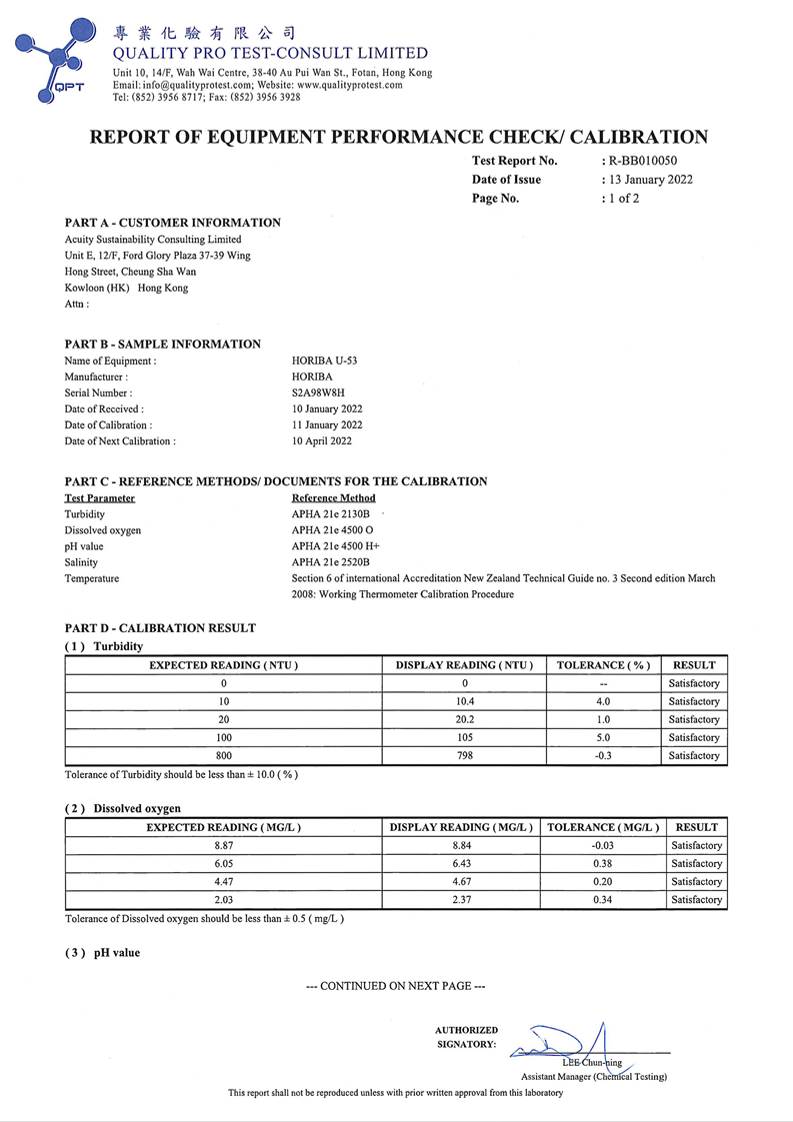
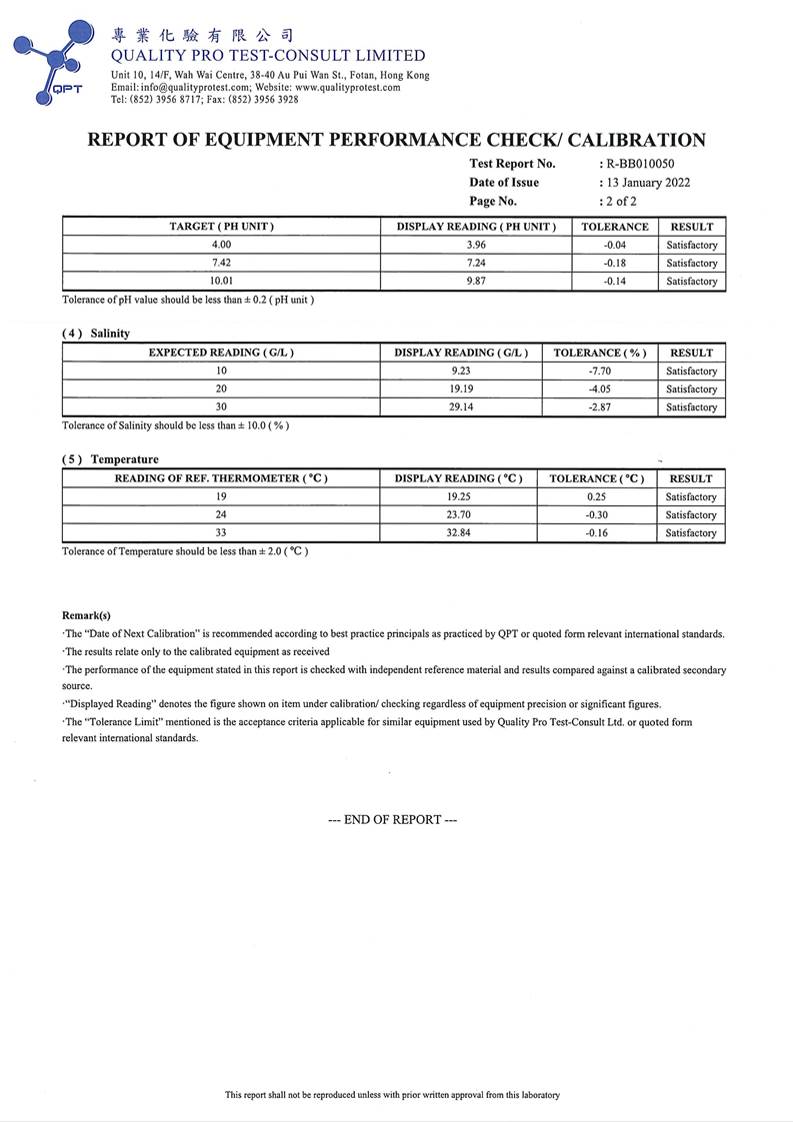
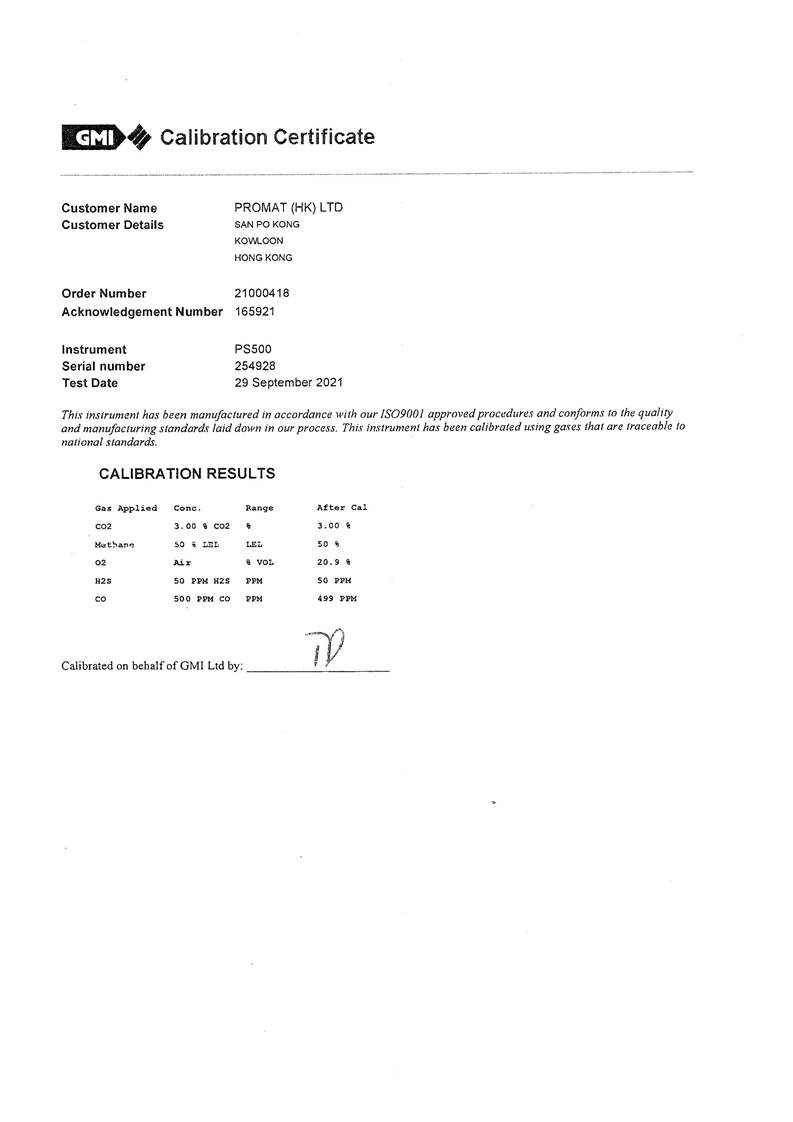
Appendix O
Exceedance Report(s)
Incident Report
on Action Level
or Limit Level Non-Compliance
|
Project |
Design, Build
and Operate First Stage of Tseung Kwan
O Desalination Plant |
|||
|
Date |
01 January 2022 (Lab result
received on 07 January 2022) |
|||
|
Time |
14:34-18:04 (Mid-Flood) and 09:24-12:54 (Mid-Ebb) |
|||
|
Mid-Flood |
||||
|
Monitoring Location |
WSR37
|
|||
|
Parameter |
Suspended
Solid (SS) |
|||
|
Action & Limit Levels |
Action Level |
Limit Level |
||
|
> 7.8 mg/L |
> 8.5 mg/L |
|||
|
Measurement Level |
Impact
Station(s) of Exceedance |
Control Stations |
Impact
Station(s) without Exceedance |
|
|
8.8 mg/L
(WSR 37) |
6.5 mg/L
(CF) 5.2 mg/L
(CE) |
6.3 mg/L (WSR1) 4.8 mg/L
(WSR 2) 3.2
mg/L (WSR 3) 3.3
mg/L (WSR 4) 5.0 mg/L
(WSR16) 5.2
mg/L (WSR 33) 5.3
mg/L (WSR 36) |
||
|
Possible reason for Action or Limit Level
Non-compliance |
Outfall Shaft Area: marine construction activities, namely 1)
Idling all day but manned to monitor clean seepage water
pumping Intake Shaft Area:
marine construction activities, namely 1) Idling
all day Marine construction activities with contact with water: 1) Idling all day but manned to monitor clean
seepage water pumping Marine vessels on 01 January 2022: -
Derrick barge
x 1 (Intake Shaft) -
Derrick barge x 1 (Outfall Shaft) Dominating sea current direction was found to be from
Southeast to Northwest at waters to the west side of Tit Cham Chau; and
from Northeast to Southwest at waters to the
east side of Tit Cham Chau. |
|||
|
|
It was noted that pumping of the clean
seepage of marine water within the silt curtain was conducted on 01 January 2022. As advised by Main contractor,
two separate pumping
systems were constructed for respectively the
unpolluted water ingress
through the edge
of the caisson and surface water/
washings from the
rock drilling/ chain
cutting work. For
unpolluted marine water ingress, it will be piped to an isolated metal skip where appropriate-sized submersible
pumps sink in to pump out the ��clean�� water into an abandoned tremie
pipe out of the caisson. The discharge point
shall be enclosed by a silt
curtain setup. Since
the seepage marine
water was unpolluted, the seepage water
can be discharged to water bodies
without a water
discharge license. For surface water/washings, it will be directly
pumped at the local low point all the way up to the water treatment facilities/water sedimentation tank in place
on the derrick barge aside. The expected silty water will be treated
by water treatment facilities/water sedimentation
tank before being piped to discharge within silt curtain area. It was recommended that regular checking of the
seepage marine water quality should be conducted. According to the field observation by
sampling team during sampling event, no silt
plume was observed in the Project site on
01 January 2022. Conditions of the
protective silt curtain at the inland water outfall was satisfactory on 01 January 2022. |
|||
|
Mid-Ebb |
||||
|
Monitoring Location |
WSR2,
WSR3, WSR4, WSR16, WSR37
|
|||
|
Parameter |
Suspended
Solid (SS) |
|||
|
Action & Limit Levels |
Action Level |
Limit Level |
||
|
> 5.2 mg/L |
> 6.0 mg/L |
|||
|
Measurement Level |
Impact
Station(s) of Exceedance |
Control Stations |
Impact
Station(s) without Exceedance |
|
|
5.7 mg/L (WSR2) 8.3 mg/L (WSR3) 6.2 mg/L (WSR4) 8.3 mg/L (WSR16) 6.5 mg/L (WSR37) |
4.3 mg/L
(CE) 4.8 mg/L
(CF) |
4.5 mg/L (WSR1) 4.0 mg/L (WSR33) 4.7 mg/L (WSR36) |
||
|
Possible reason for Action or Limit Level
Non-compliance |
Outfall Shaft Area: marine construction activities, namely 1)
Idling all day but manned to monitor clean seepage water
pumping |
|||
|
|
Intake Shaft
Area: marine construction activities, namely 1) Idling all day Marine construction activities with contact with water: 1) Idling all day but manned to monitor clean
seepage water pumping Marine vessels on 01 January 2022: -
Derrick barge
x 1 (Intake Shaft) -
Derrick barge x 1 (Outfall Shaft) Dominating sea current direction was
found to be from Northwest to Southeast at waters to the west side of Tit Cham Chau; and
from West to East at waters to the east side of Tit Cham Chau. Stations WSR2, WSR3, WSR4 and WSR16 were
located distant from the construction site and the possibility of being affected by marine construction activities was considered limited. SS exceedances were
however observed at WSR2 (5.7 mg/L), WSR3
(8.3 mg/L), WSR4 (6.2 mg/L) and WSR16 (8.3 mg/L). The SS level at WSR37 (6.5 mg/L) was lower than stations that
located further from the construction site
(WSR3, WSR16). It was noted that pumping of the clean
seepage of marine
water within the silt curtain was conducted on 01
January 2022. As advised by Main contractor, two separate pumping systems
were constructed for respectively the unpolluted water
ingress through the edge of the caisson and surface water/ washings
from the rock drilling/ chain
cutting work. For unpolluted marine water ingress, it will be piped to an isolated metal skip where
appropriate-sized submersible pumps
sink in to pump out the ��clean�� water
into an abandoned tremie pipe out
of the caisson. The discharge point
shall be enclosed by a
silt curtain setup. Since the seepage marine water was unpolluted, the seepage water can be discharged to water bodies
without a water
discharge license. For
surface water/washings, it will be directly pumped at the local low
point all the way up to the water
treatment facilities/water sedimentation tank in place on the derrick barge aside. The expected silty water will be
treated by water treatment
facilities/water sedimentation tank
before being piped to discharge within silt curtain area. It was recommended that regular checking of the
seepage marine water quality should be conducted. According to the field observation by
sampling team during sampling event, no silt
plume was observed in the Project site on
01 January 2022. Conditions of the protective silt curtain at the inland
water outfall was satisfactory on 01
January 2022. |
|
Remarks |
Current
direction during mid-flood sampling on 01 January 2022
Current direction during
mid-ebb sampling on 01 January 2022:
(Sourced from http://current.hydro.gov.hk/en/map.html) |
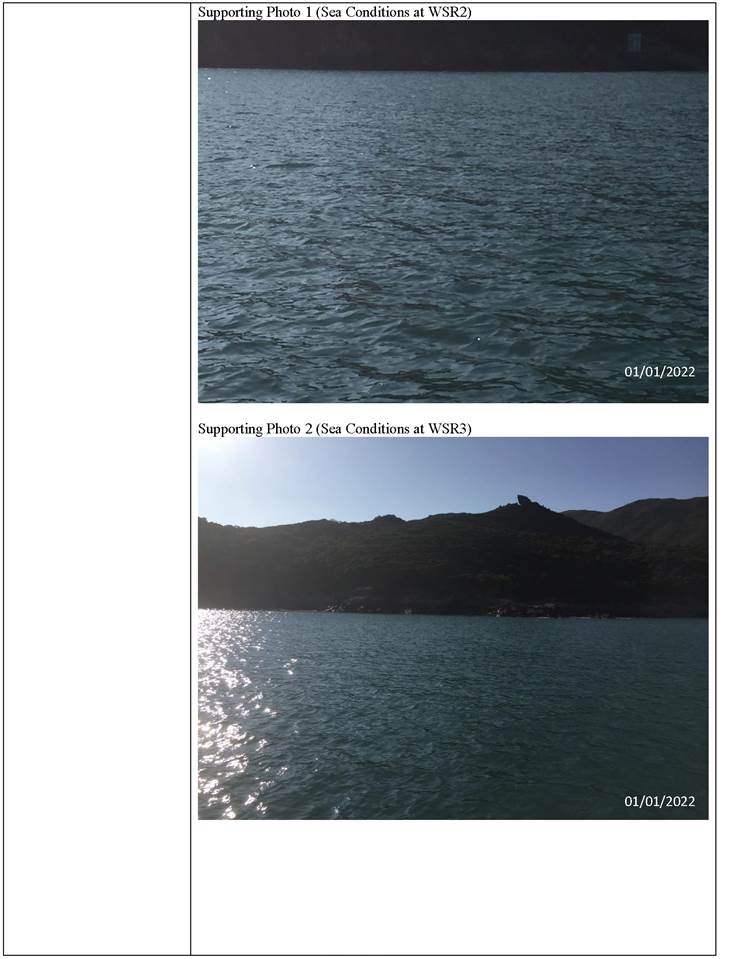
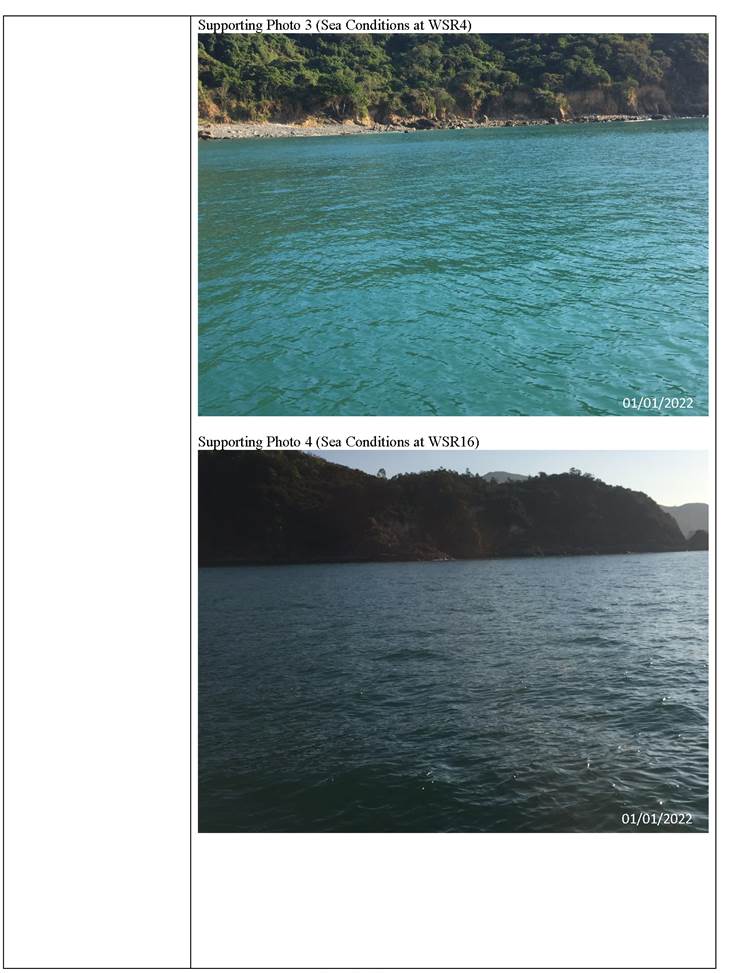
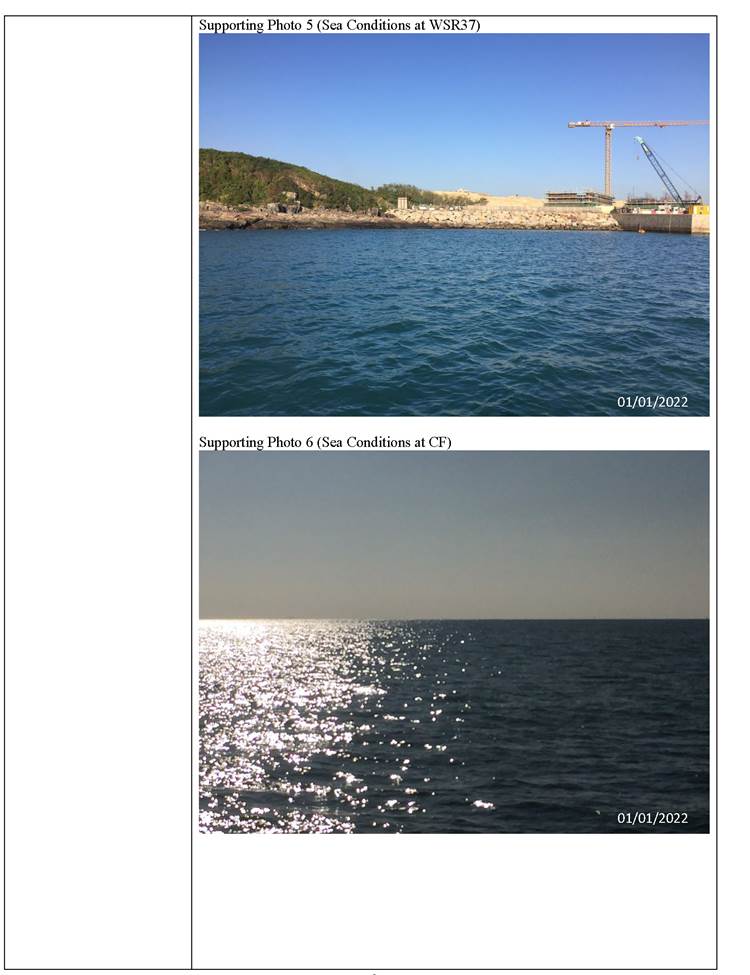
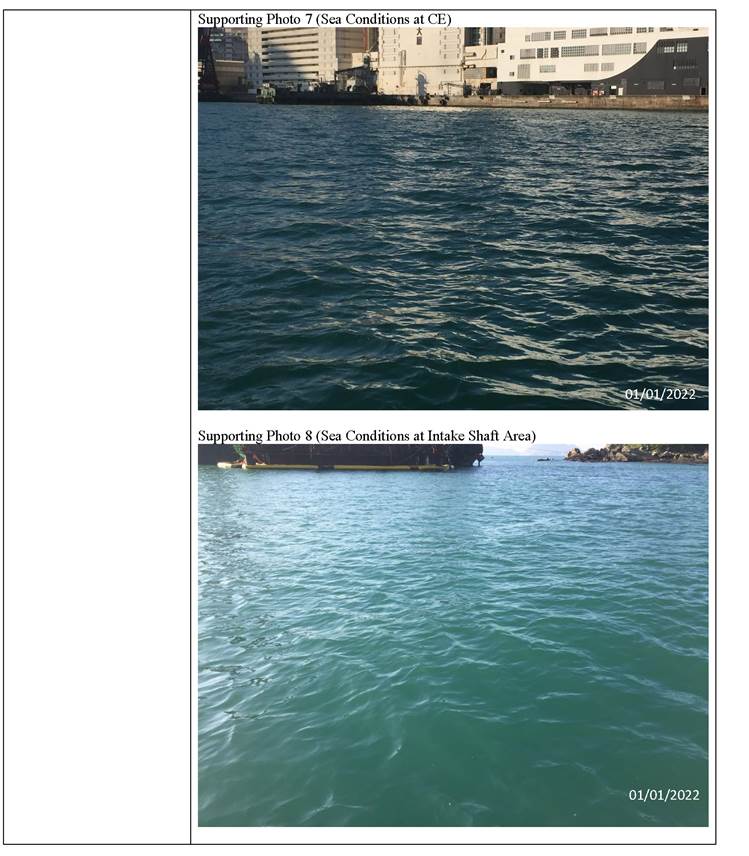
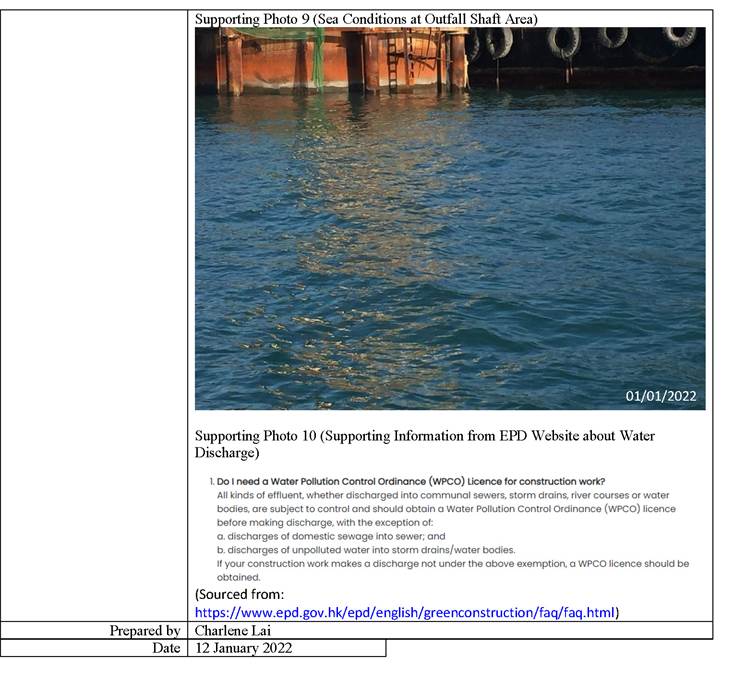
Incident Report
on Action Level or Limit Level Non-Compliance
|
Project |
Design, Build
and Operate First Stage of Tseung Kwan O Desalination
Plant |
|||
|
Date |
04 January 2022 (Lab result
received on 10 January 2022) |
|||
|
Time |
08:00 - 10:04
(Mid-Flood) and 11:46 - 15:16
(Mid-Ebb) |
|||
|
Mid-flood |
||||
|
Monitoring Location |
WSR1, WSR33,
WSR36, WSR37
|
|||
|
Parameter |
Suspended
Solid (SS) |
|||
|
Action &
Limit Levels |
Action Level |
Limit Level |
||
|
> 5.0 mg/L |
> 6.0 mg/L |
|||
|
Measurement Level |
Impact Station(s) of Exceedance |
Control Stations |
Impact Station(s) without Exceedance |
|
|
5.3 mg/L
(WSR1) 6.3 mg/L
(WSR33) 5.7 mg/L
(WSR36) 12.3 mg/L
(WSR37) |
4.3 mg/L
(CE) 3.3 mg/L
(CF) |
4.4 mg/L
(WSR2) 3.6 mg/L
(WSR3) 4.5 mg/L
(WSR4) 4.8 mg/L
(WSR16) |
||
|
Possible reason for Action or Limit Level
Non-compliance |
Outfall Shaft Area: marine construction activities, namely
1) 1st derrick
barge supported material lifting for rock coring and
pumping clean seepage water within silt
curtain area (0800
-
2200 hrs); 2) 2nd chain-cut the bed rock inside
the caisson (0800 - 1900 hrs) Intake Shaft
Area: marine construction activities, namely 1) derrick barge for fitting in waling
and welding inside the shaft (double silt curtain in place). (0800 - 1800 hrs) Marine
construction activities with contact with water: 1) 1st derrick barge
supported material lifting
for rock coring
and pumping clean
seepage water within
silt curtain area
(0800 - 2200 hrs); 2) 2nd chain-cut the bed rock inside
the caisson (0800
-
1900 hrs) Marine
vessels on 04 January 2022: -
Derrick barge x 1 (Intake Shaft) -
Derrick barge
x 1, chain-cutting machine x 1 inside
the caisson (Outfall Shaft) |
|||
|
|
Dominant sea current direction was found to
be from Southeast to Northwest at waters to
the west side of Tit Cham Chau; and from Northeast to Southwest at waters to
the east side of Tit Cham Chau. Station
WSR1 was located
distant from the construction site
and the possibility of being affected by marine construction
activities was considered limited. SS exceedance was however observed at WSR1 (5.3 mg/L) and was similar to the SS
level at WSR36 (5.7 mg/L). No
marine construction activity with contact with water was conducted at WSR36. SS exceedance was however
observed at WSR36 (5.7 mg/L). An upstream station,
WSR33 (6.3 mg/L), was recorded with higher SS level than that of WSR36, where
marine construction activities was conducted at WSR36. It was noted
that pumping of the clean seepage
of marine water within the silt curtain was conducted on 04 January 2022. As advised by Main
contractor, two separate pumping systems were constructed for respectively the unpolluted water
ingress through the edge of the caisson
and surface water/ washings from the rock drilling/ chain cutting
work. For unpolluted marine water
ingress, it will be piped to an isolated metal skip where appropriate-sized submersible pumps sink in to pump out the ��clean�� water
into an abandoned tremie pipe out of the caisson. The discharge
point shall be enclosed by a silt curtain setup. Since the seepage marine
water was unpolluted, the seepage water
can be discharged to water bodies without a water discharge license. For surface
water/washings resulted from rock cutting activities, it will be
directly pumped at the local low point all the way up to the water treatment facilities/water
sedimentation tank in place on the derrick barge aside. The expected silty
water will be treated by water treatment facilities/water sedimentation
tank before being piped to discharge within silt curtain area. As been advised
by the Main
Contractor, on-site operative verified the unpolluted seepage water was
visually clear on 04
January 2022. According to the field observation by
sampling team during sampling event, no silt
plume was observed in the Project
site on 04 January 2022. Conditions of the protective silt curtain
at the inland water outfall was satisfactory on 04 January 2022. |
|
Remarks |
Current direction during
mid-flood sampling on 04 January
2022:
(Sourced from http://current.hydro.gov.hk/en/map.html) |
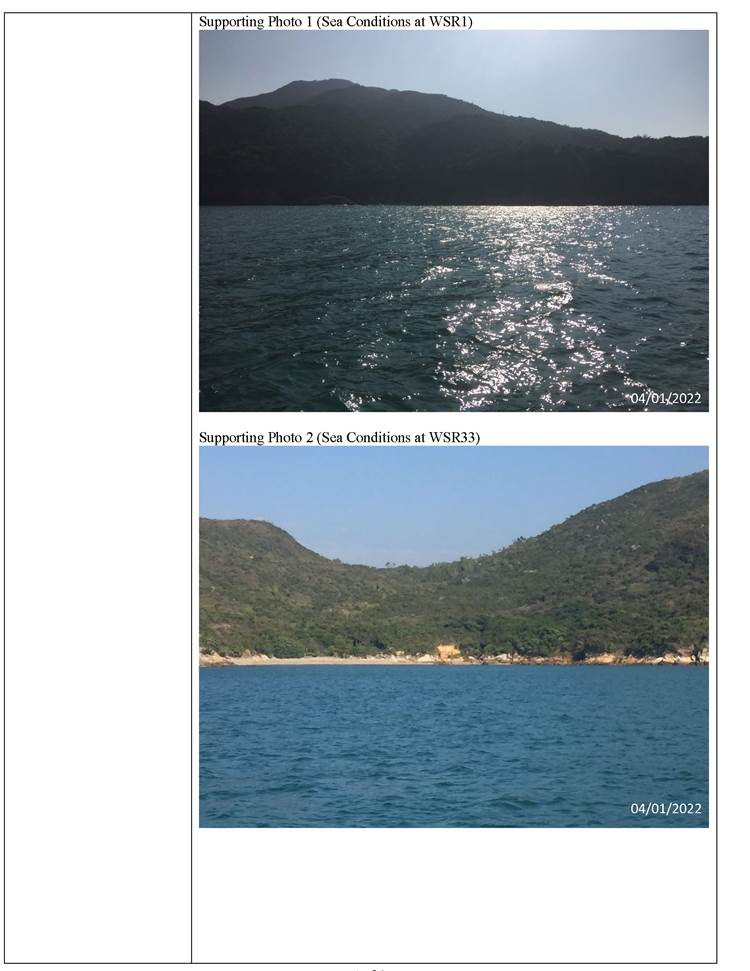
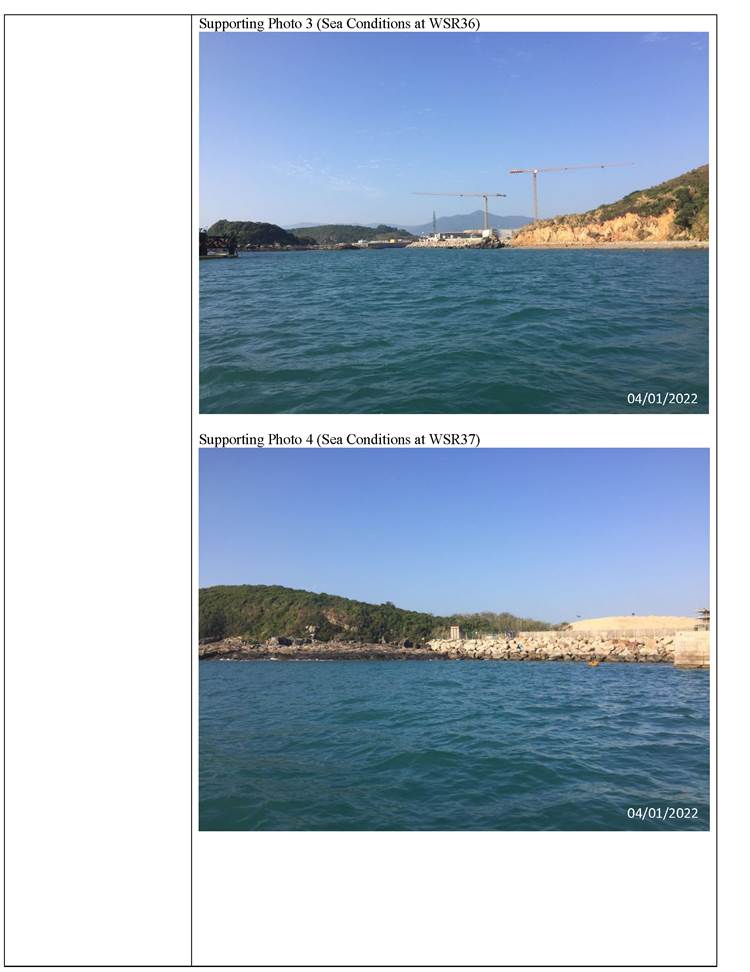
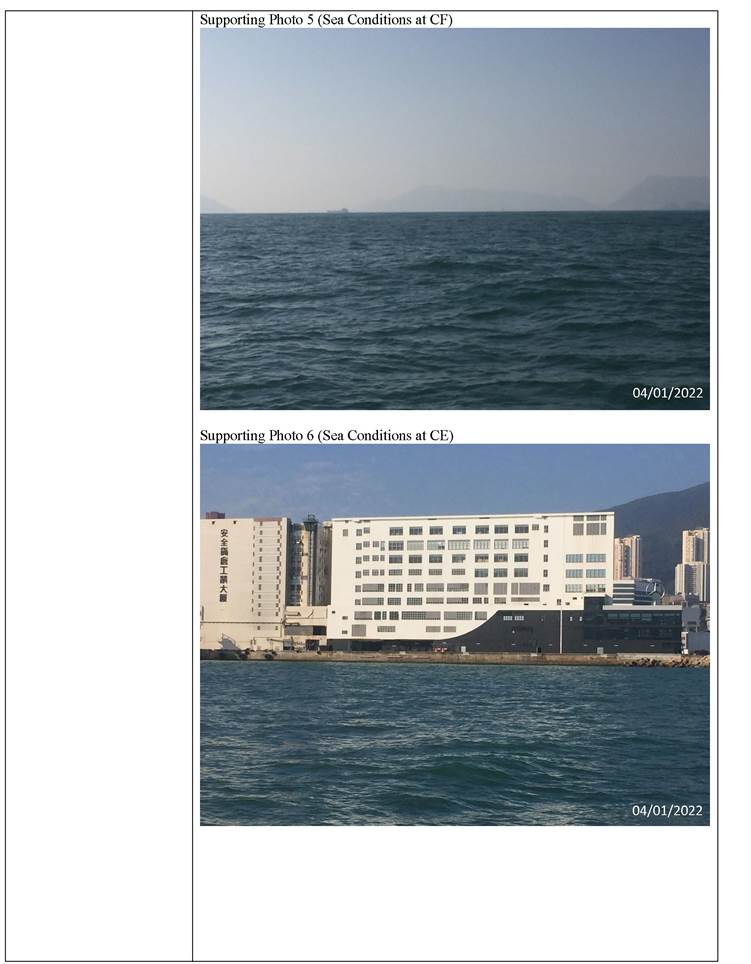
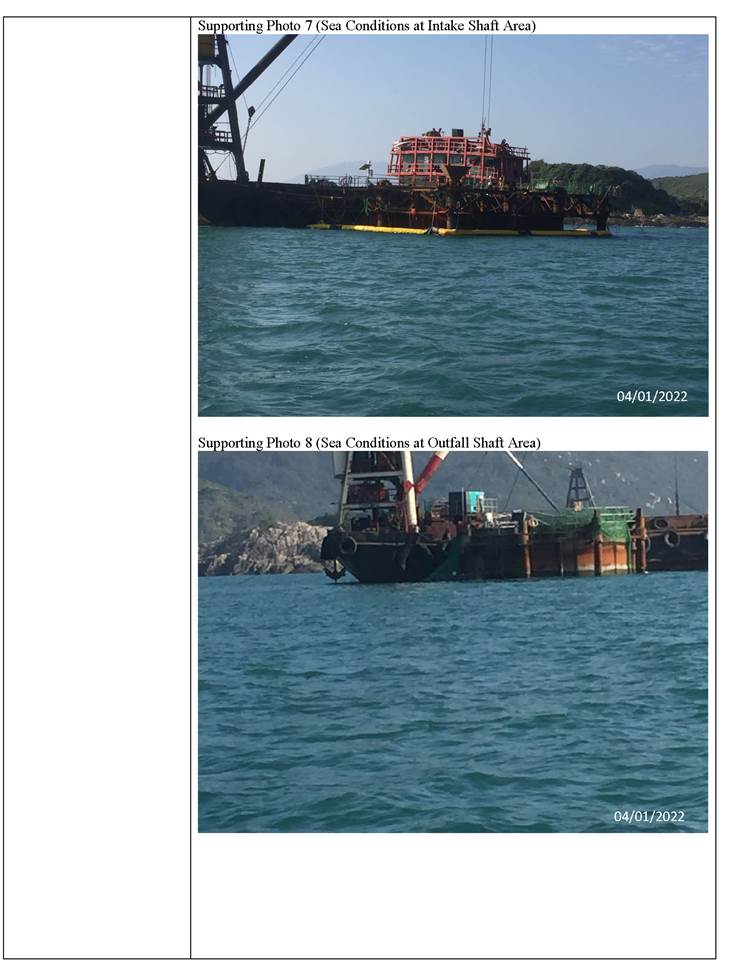
|
|
Supporting Photo
9 (Overview from
inside the caisson at Outfall Shaft Area)
|
|
|
Prepared by |
Jack Chow |
|
|
Date |
20 January 2022 |
|
Incident Report
on Action Level or Limit Level Non-Compliance
|
Project |
Design, Build
and Operate First Stage of Tseung Kwan O Desalination
Plant |
|||
|
Date |
06 January 2022 (Lab result
received on 12 January 2022) |
|||
|
Time |
08:05 - 11:35
(Mid-Flood) and 13:28 - 16:58
(Mid-Ebb) |
|||
|
Mid-ebb |
||||
|
Monitoring Location |
WSR1, WSR16,
WSR33
|
|||
|
Parameter |
Suspended
Solid (SS) |
|||
|
Action &
Limit Levels |
Action Level |
Limit Level |
||
|
> 5.0 mg/L |
> 6.0 mg/L |
|||
|
Measurement Level |
Impact Station(s) of Exceedance |
Control Stations |
Impact Station(s) without Exceedance |
|
|
5.3 mg/L
(WSR1) 6.4 mg/L
(WSR16) 6.8 mg/L (WSR33) |
3.5 mg/L
(CE) 5.0 mg/L
(CF) |
4.2
mg/L (WSR2) 4.3
mg/L (WSR3) 3.4 mg/L
(WSR4) 5.0 mg/L
(WSR36) 3.8 mg/L (WSR37) |
||
|
Possible reason for Action or Limit Level
Non-compliance |
Outfall Shaft Area: marine construction activities, namely
1) 1st derrick
barge supported material lifting for rock cutting work
and pumping clean seepage water within silt
curtain area. (0800
-
2200 hrs); 2) 2nd chain-cut the bed rock inside the caisson (0800 - 1900 hrs) Intake Shaft
Area: marine construction activities, namely 1) derrick barge supported diver��s work on welding waling brackets
inside the shaft (double silt curtain in place). (0800 - 1800 hrs) Marine
construction activities with contact with water: 1) 1st derrick barge
supported material lifting for rock
cutting work and pumping clean seepage water within silt curtain
area. (0800 - 2200 hrs); 2) 2nd chain-cut the bed rock inside the caisson (0800 -
1900 hrs); 3) derrick barge
supported diver��s work on welding
waling brackets inside
the shaft (double silt curtain in place). (0800 - 1800 hrs) |
|||
|
|
Marine
vessels on 06 January 2022: -
Derrick barge x 1 (Intake Shaft) -
Derrick barge
x 1, chain-cutting machine x 1 inside
the caisson (Outfall Shaft) Dominant sea current direction
was found to be from Northwest to Southeast at waters to the west side of Tit Cham Chau; and from West to East at
waters to the east side of Tit Cham Chau. Station WSR1 and WSR 16 were located
distant from the construction site and the
possibility of being affected by marine construction activities was
considered limited. SS exceedance
was however observed at WSR1 (5.3 mg/L) and WSR 16 (6.4 mg/L). With reference to the construction
schedule provided by the Main Contractor, marine construction activities were conducted at WSR36 and WSR37
during mid-ebb tide on 06 January 2022. No SS exceedances were
observed at WSR36
(5.0 mg/L) and
WSR37 (3.8 mg/L). A
downstream station, WSR33 (6.8 mg/L), has a similar SS level to that of WSR16 (6.4 mg/L), where WSR16 was
located further from the construction site. In view of the inverse relation between distance to marine works
and SS level, the SS exceedance is concluded not project relevant. According to the field
observation by sampling team during sampling event, no silt plume was observed in the Project
site on 06 January 2022. Conditions of the protective
silt curtain at the inland water outfall was satisfactory on 06 January 2022. |
|
Remarks |
Current direction during
mid-flood sampling on 06 January
2022:
(Sourced from http://current.hydro.gov.hk/en/map.html) |
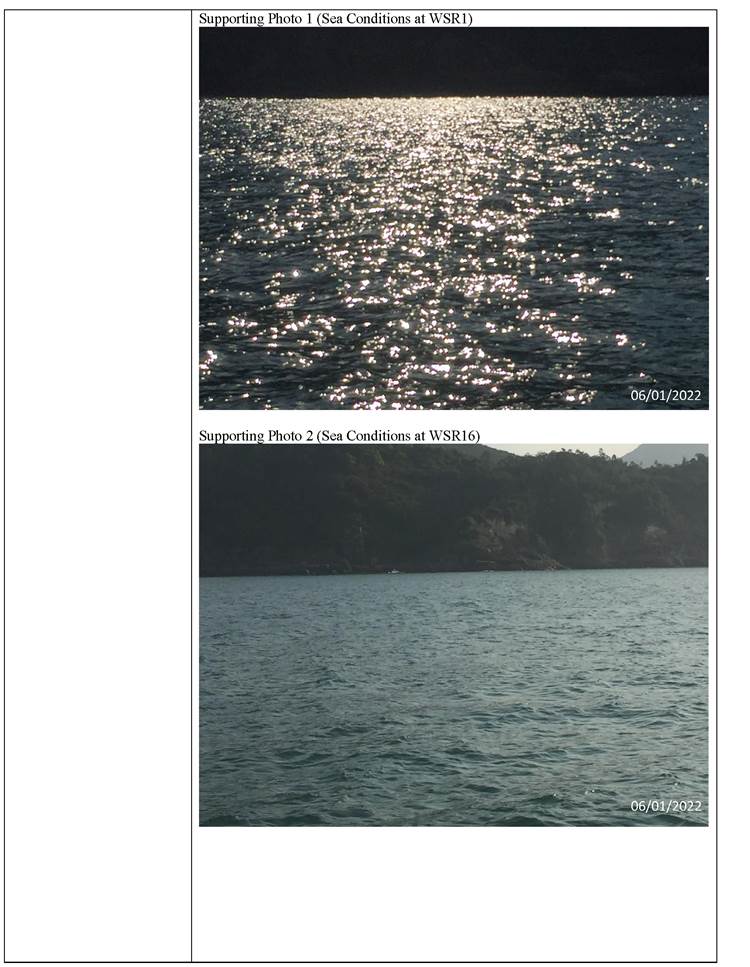
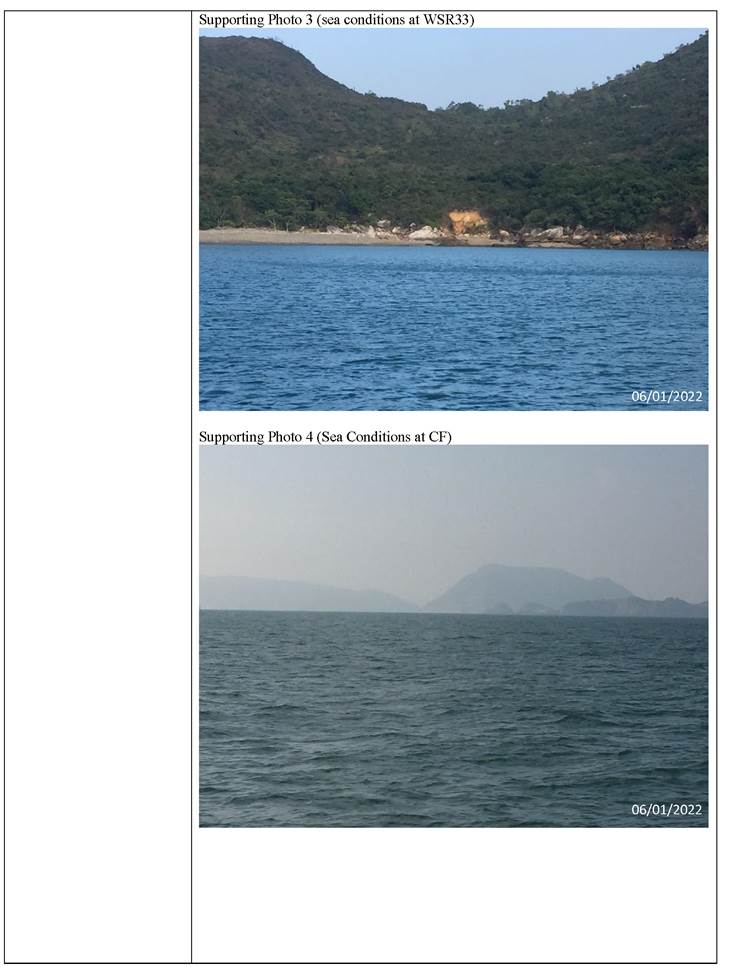
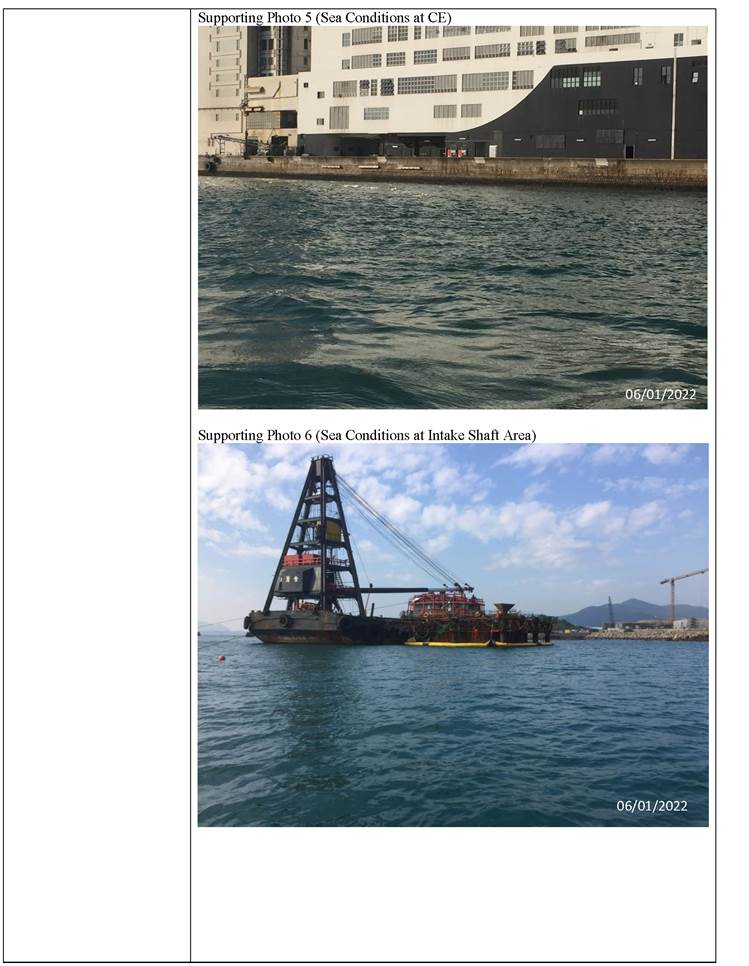
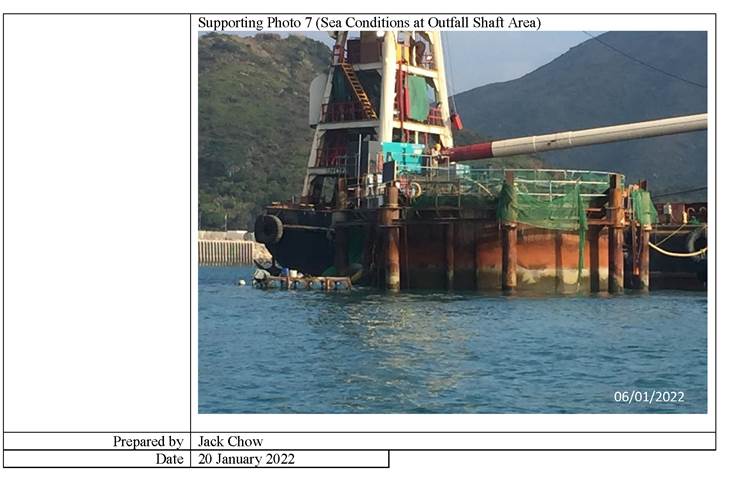
Incident Report
on Action Level
or Limit Level Non-Compliance
|
Project |
Design, Build
and Operate First Stage of Tseung Kwan
O Desalination Plant |
|||
|
Date |
08 January 2022 (Lab result
received on 14 January 2022) |
|||
|
Time |
09:31 - 13:01 (Mid-Flood) and 15:15-18:45 (Mid-Ebb) |
|||
|
Mid-Flood |
||||
|
Monitoring Location |
WSR2, WSR3, WSR4, WSR16,
WSR36, WSR37
|
|||
|
Parameter |
Suspended
Solid (SS) |
|||
|
Action & Limit Levels |
Action Level |
Limit Level |
||
|
> 6.2 mg/L |
> 6.7 mg/L |
|||
|
Measurement Level |
Impact
Station(s) of Exceedance |
Control Stations |
Impact
Station(s) without Exceedance |
|
|
13.7 mg/L (WSR
2) 17.5 mg/L (WSR
3) 19.7 mg/L (WSR
4) 9.0 mg/L
(WSR16) 7.0 mg/L
(WSR 36) 6.3 mg/L
(WSR 37) |
4.3 mg/L
(CE) 5.2 mg/L
(CF) |
4.8 mg/L (WSR1) 5.3 mg/L
(WSR 33) |
||
|
Possible reason for Action or Limit Level
Non-compliance |
Outfall Shaft Area: marine construction activities, namely
1) 1st derrick
barge supported material lifting for rock cutting
and pumping clean
seepage water within
silt curtain area
(0800 - 2200 hrs);
2) chain-cut the bed
rock inside the caisson (0800 - 1900 hrs). Intake Shaft Area: marine
construction activities, namely 1) 1st derrick barge for incepting non-MD excavated from inside the shaft (double
silt curtain in place) (0800 - 2000
hrs); 2) grab dredger to excavate non-MD inside the shaft and to load onto
the derrick barge (double silt
curtain and tarpaulin sheeting beneath the moving grab in place)
(0800 - 2000 hrs). Marine construction
activities with contact with water: 1) 1st derrick barge supported material lifting for rock cutting and
pumping clean seepage water within silt curtain area. (0800 - 2200 hrs);
2) chain-cut the
bed rock inside
the caisson (0800
- 1900 hrs); 3) grab dredger to excavate
non-MD inside the shaft and to load onto the derrick barge (double silt curtain and tarpaulin
sheeting beneath the moving grab in place) (0800 - 2000 hrs). |
|||
|
|
Marine vessels on 08 January 2022: -
Derrick barge
x 1, grab dredger x 1 (Intake Shaft) -
Derrick barge
x 1, chain-cutting machine x 1 inside
the caisson (Outfall Shaft) Dominating sea current direction was found to be from
Southeast to Northwest at waters to the west side of Tit Cham Chau; and
from Northeast to Southwest at waters to the
east side of Tit Cham Chau. Stations WSR2, WSR3, WSR4 and WSR16 were
located distant from the construction site and the possibility of being affected by marine construction activities was considered limited. SS exceedances were
however observed at WSR2 (13.7 mg/L), WSR4
(17.5 mg/L), WSR4 (19.7 mg/L) and WSR16 (9.0 mg/L). With reference to the construction activity schedule provided
by the Main Contractor, marine construction
activities with contact with water were
conducted at WSR36
and WSR37 on 08 January 2022. The SS levels at WSR36 (7.0
mg/L) and WSR37
(6.3 mg/L) were
however lower than that of stations that located
further from the construction site (WSR2, WSR3, WSR4 and WSR16). In view of the inverse relation between
distance to marine works and SS level, the SS exceedance is
concluded not project relevant. According to the field
observation by sampling team during sampling event, no silt plume
was observed in the Project site on
08 January 2022. Conditions of the protective silt curtain at the inland
water outfall was satisfactory on 08
January 2022. |
|||
|
Mid-Ebb |
||||
|
Monitoring Location |
WSR1,
WSR2, WSR3, WSR4, WSR16, WSR37
|
|||
|
Parameter |
Suspended
Solid (SS) |
|||
|
Action & Limit Levels |
Action Level |
Limit Level |
||
|
> 5.0 mg/L |
> 6.0 mg/L |
|||
|
Measurement Level |
Impact
Station(s) of Exceedance |
Control Stations |
Impact
Station(s) without Exceedance |
|
|
5.5 mg/L (WSR1) 5.7 mg/L (WSR2) 6.3 mg/L (WSR3) 6.7 mg/L (WSR4) 5.5 mg/L
(WSR16) 15.8 mg/L (WSR37) |
4.2 mg/L
(CE) 5.3 mg/L
(CF) |
5.0 mg/L (WSR33) 4.5 mg/L (WSR36) |
||
|
Possible reason for Action or Limit Level
Non-compliance |
Outfall Shaft Area: marine construction activities, namely
1) 1st derrick
barge supported material lifting for rock cutting and
pumping clean seepage water within silt curtain area. (0800 - 2200 hrs);
2) chain-cut the
bed rock inside
the caisson (0800
- 1900 hrs). Intake Shaft Area: marine
construction activities, namely 1) 1st
derrick barge for incepting non-MD
excavated from inside
the shaft (double
silt curtain in place) (0800 - 2000
hrs); 2) grab dredger to excavate non-MD inside the shaft and to load onto
the derrick barge (double silt
curtain and tarpaulin sheeting beneath the moving grab in place)
(0800 - 2000 hrs). Marine construction
activities with contact with water: 1) 1st derrick barge supported material lifting for rock cutting and
pumping clean seepage water within silt curtain area. (0800 - 2200 hrs);
2) chain-cut the
bed rock inside
the caisson (0800
- 1900 hrs); 3) grab dredger to excavate
non-MD inside the shaft and to load onto the derrick barge (double silt curtain and tarpaulin
sheeting beneath the moving grab in place) (0800 - 2000 hrs). Marine vessels on 08 January 2022: -
Derrick barge
x 1, grab dredger x 1 (Intake Shaft) -
Derrick barge
x 1, chain-cutting machine x 1 inside
the caisson (Outfall Shaft) Dominating sea current direction was
found to be from Northwest to Southeast at waters to the west side of Tit Cham Chau; and
from West to East at waters to the east side of Tit Cham Chau. Stations WSR1, WSR2, WSR3, WSR4 and WSR16
were located distant from the construction
site and the possibility of being affected by marine construction activities was considered limited. SS exceedances
were however noted at WSR1 (5.5 mg/L), WSR2 (5.7
mg/L), WSR3 (6.3 mg/L), WSR4
(6.7 mg/L) and WSR16 (5.5
mg/L). It was noted that pumping of the
clean seepage of marine water within the silt curtain was conducted on 08 January 2022 at Outfall
Shaft Area. As advised by Main contractor,
two separate pumping systems were constructed for respectively the
unpolluted water ingress through
the edge of the caisson and surface water/ washings from the rock drilling/ chain cutting work. For
unpolluted marine water ingress, it will be piped to an isolated metal skip where
appropriate-sized submersible pumps
sink in to pump out the ��clean�� water
into an abandoned tremie pipe out
of the caisson. The discharge point
shall be enclosed by a silt
curtain setup. Since the seepage marine water was unpolluted, the seepage water can be discharged to water bodies
without a water
discharge license. For surface
water/washings, it will be directly pumped at the local low point all the way
up to the water treatment
facilities/water sedimentation tank in place on the derrick barge aside. The expected silty water will be
treated by water treatment facilities/water
sedimentation tank before being piped to discharge within silt curtain
area. As been advised by the Main Contractor, on-site
operative verified the unpolluted seepage water was visually
clear on 08 January 2022. A downstream station, WSR36, has showed no SS exceedance (4.5 mg/L) during mid-ebb
tide on 08 January 2022, where marine dredging works were conducted. In view of the isolated properties of the marine seepage
water at Outfall Shaft caisson, the SS exceedance observed at WSR37
may hence be suggested to result
from other natural factors, such as the accumulation of marine substance which was temporary stored
in the isolated skip. According to the
field observation by sampling team
during sampling event,
no silt plume
was observed in the Project site on
08 January 2022. Conditions of the protective silt curtain at the inland
water outfall was satisfactory on 08
January 2022. |
|
Remarks |
Current direction during
mid-flood sampling on 08
January 2022
Current direction during
mid-ebb sampling on 08 January 2022:
(Sourced from http://current.hydro.gov.hk/en/map.html) |
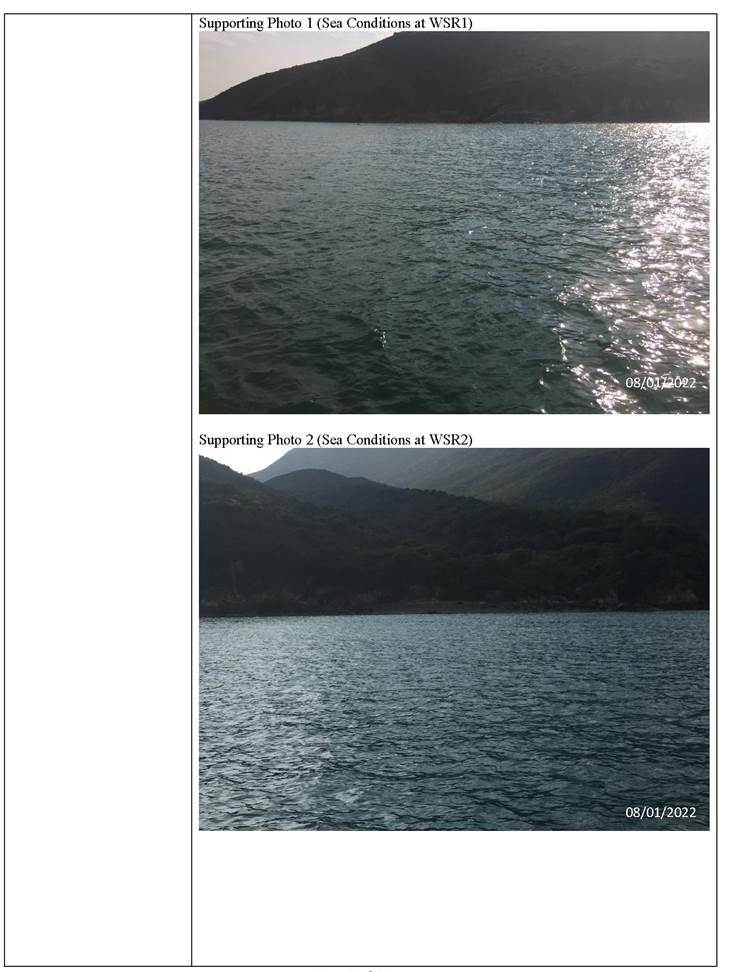
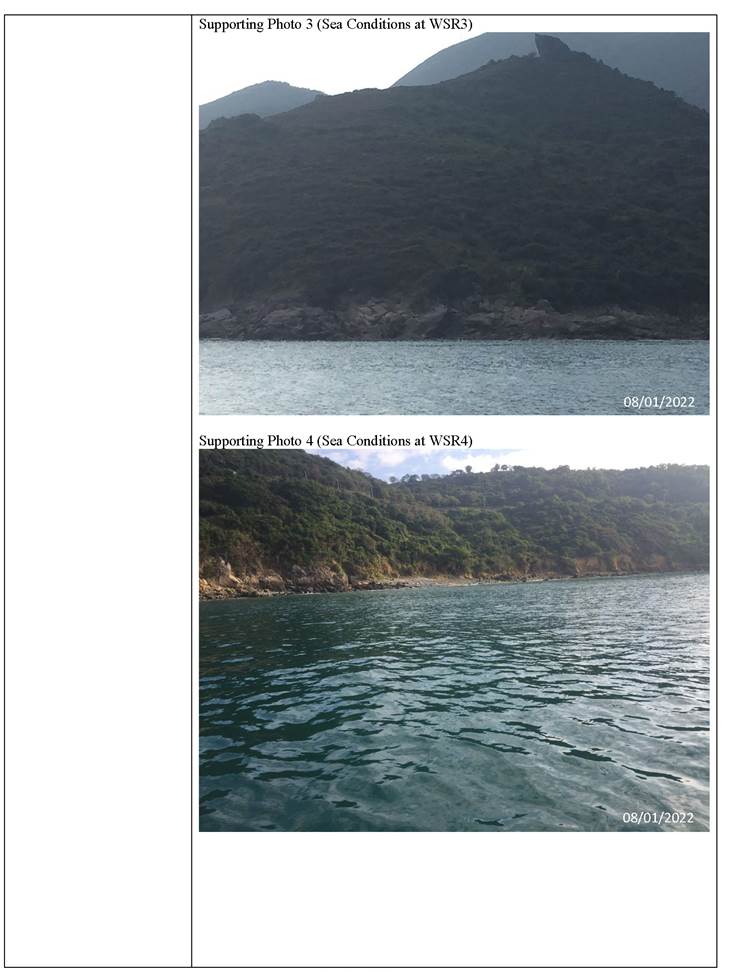
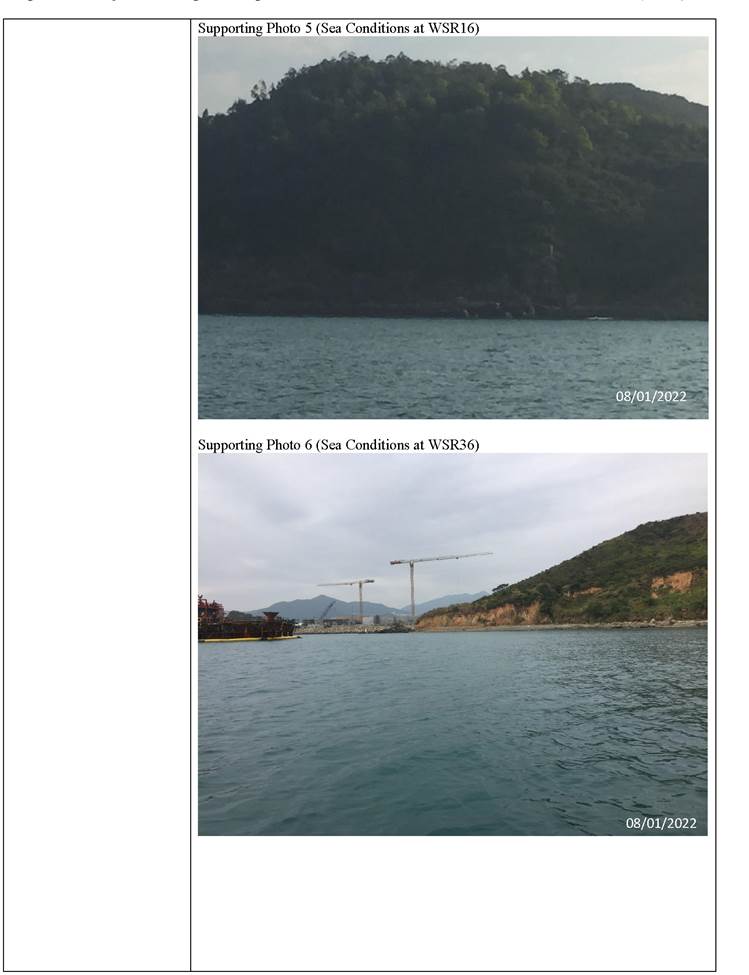
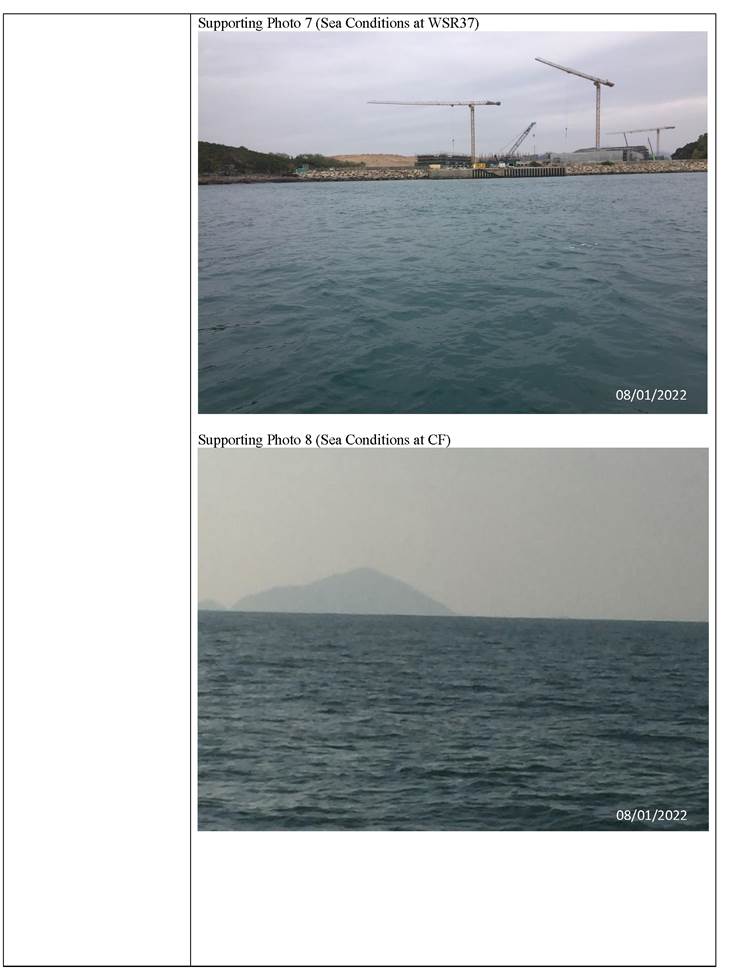
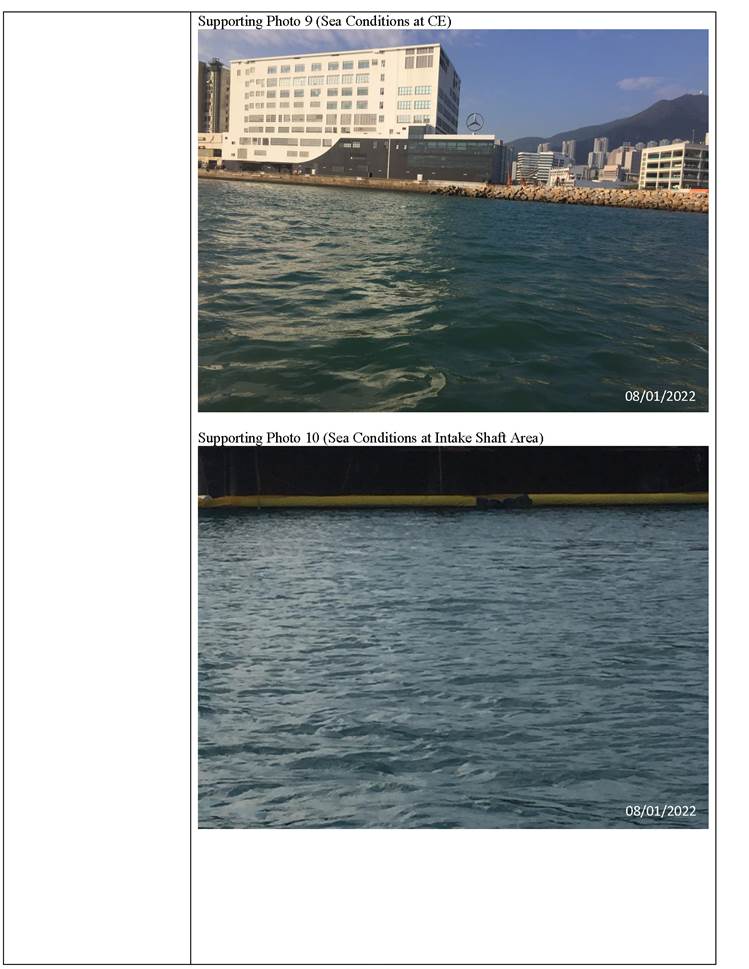
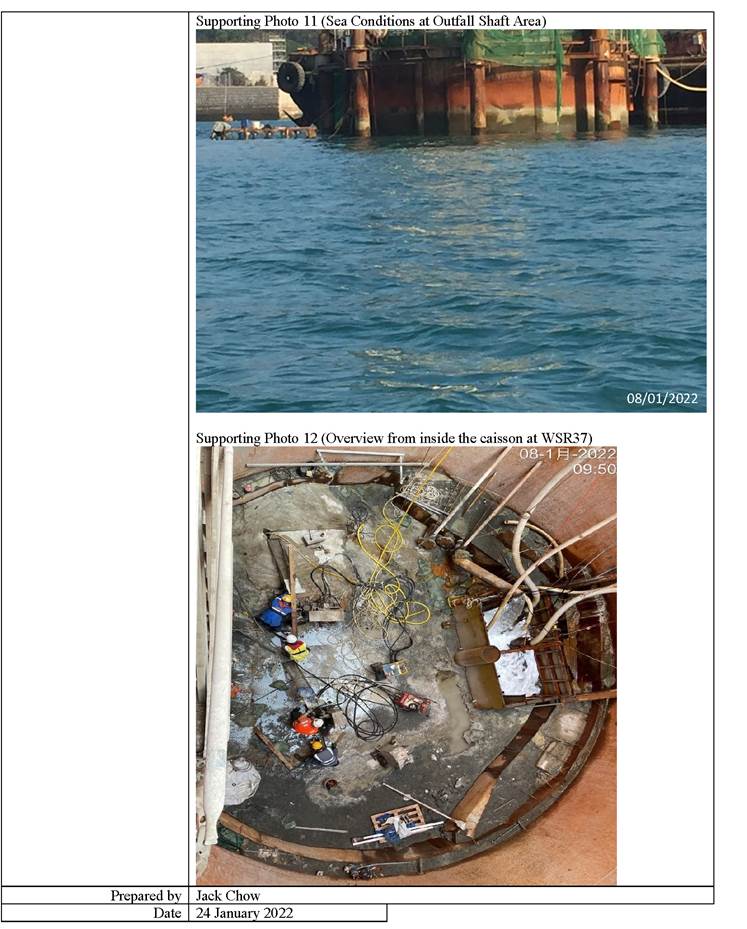
Incident Report
on Action Level
or Limit Level Non-Compliance
|
Project |
Design, Build
and Operate First Stage of Tseung Kwan
O Desalination Plant |
|||
|
Date |
11 January 2022 (Lab result
received on 17 January 2022) |
|||
|
Time |
17:40 - 19:00 (Mid-Flood) and 11:41-15:11 (Mid-Ebb) |
|||
|
Mid-Flood |
||||
|
Monitoring Location |
WSR3, WSR36
|
|||
|
Parameter |
Suspended
Solid (SS) |
|||
|
Action & Limit Levels |
Action Level |
Limit Level |
||
|
> 6.9 mg/L |
> 7.5 mg/L |
|||
|
Measurement Level |
Impact
Station(s) of Exceedance |
Control Stations |
Impact
Station(s) without Exceedance |
|
|
7.2 mg/L
(WSR 3) 7.2 mg/L
(WSR 36) |
3.7 mg/L
(CE) 5.8 mg/L
(CF) |
3.8 mg/L (WSR1) 4.0 mg/L
(WSR 2) 4.7 mg/L
(WSR 4) 5.8 mg/L
(WSR16) 5.3 mg/L
(WSR 33) 5.8 mg/L
(WSR 37) |
||
|
Possible reason for Action or Limit Level
Non-compliance |
Outfall Shaft
Area: marine construction activities, namely 1) derrick barge supported material lifting for rock cutting
and pumping clean
seepage water within
silt curtain area
(0800 - 2200 hrs);
2) chain-cut the bed rock
inside the caisson
(no contact with
outside water body) (0800
- 1900 hrs) Intake Shaft
Area: marine construction activities, namely 1) derrick barge
for incepting non-MD excavated from inside the shaft
(double silt curtain in place) (0800 - 2000 hrs); 2) grab
dredger to excavate non-MD inside the shaft and to load onto the derrick barge (double silt curtain and tarpaulin sheeting beneath the moving
grab in place)
(0800 - 2000 hrs);
3) derrick barge and grab dredger be intermittently re-positioned by tug boat
(1445 - 1900 hrs) Marine construction
activities with contact with water: 1) derrick barge supported material lifting for rock cutting and pumping clean
seepage water within
silt curtain area
(0800 - 2200 hrs);
2) chain-cut the bed rock
inside the caisson
(no contact with outside water body) (0800
- 1900 hrs);
3) grab dredger
to excavate non-MD
inside the shaft
and |
|||
|
|
to load onto the derrick
barge (double silt
curtain and tarpaulin sheeting beneath the moving grab
in place) (0800 - 2000 hrs) Marine vessels on 11 January 2022: -
Derrick barge
x 1, grab dredger x 1,
tug boat x 1 (Intake Shaft) -
Derrick barge
x 1, chain-cutting machine
x 1 (Outfall Shaft) Dominating sea current direction was found to be from
Southeast to Northwest at waters to the west side of Tit Cham Chau; and
from Northeast to Southwest at waters to the
east side of Tit Cham Chau. Station WSR3 was located distant from the construction site
and the possibility of being affected by marine construction
activities was considered limited. SS exceedance was however observed at WSR3 (7.2 mg/L). With reference to the
work schedule provided by the Main
Contractor, marine construction works were conducted at WSR36 and WSR37
on 11 January
2022. The SS level at WSR36 (7.2
mg/L) was however
the same to that at WSR3, which located further
from the construction site. No SS exceedance
was observed at WSR37 (5.8 mg/L), where
marine construction activities were conducted. In
view of the inverse relation between distance to marine works and SS level,
the SS exceedance is concluded not project
relevant. According to the field observation by
sampling team during sampling event, no silt
plume was observed in the Project site on
11 January 2022. Conditions of the protective silt curtain at the inland water
outfall was satisfactory on 11
January 2022. |
|||
|
Mid-Ebb |
||||
|
Monitoring Location |
WSR4, WSR16
|
|||
|
Parameter |
Suspended
Solid (SS) |
|||
|
Action & Limit Levels |
Action Level |
Limit Level |
||
|
> 5.0 mg/L |
> 6.0 mg/L |
|||
|
Measurement Level |
Impact
Station(s) of Exceedance |
Control Stations |
Impact
Station(s) without Exceedance |
|
|
10.5 mg/L
(WSR4) 5.5 mg/L (WSR16) |
3.3 mg/L
(CE) 4.2 mg/L
(CF) |
4.0 mg/L (WSR1) 4.0 mg/L (WSR2) 4.8 mg/L (WSR3) 3.8 mg/L (WSR33) 3.8 mg/L (WSR36) 3.5 mg/L (WSR37) |
||
|
Possible reason for Action or Limit Level
Non-compliance |
Outfall Shaft
Area: marine construction activities, namely 1) derrick barge supported material lifting for rock cutting
and pumping clean
seepage water within
silt curtain area
(0800 - 2200 hrs);
2) chain-cut the bed rock
inside the caisson
(no contact with
outside water body) (0800
- 1900 hrs) Intake Shaft
Area: marine construction activities, namely 1) derrick barge
for incepting non-MD excavated from inside the shaft
(double silt curtain in place) (0800 - 2000 hrs); 2) grab
dredger to excavate non-MD inside the shaft and to load onto the derrick barge (double silt curtain and tarpaulin sheeting beneath the moving
grab in place)
(0800 - 2000 hrs); 3) derrick
barge and grab dredger be intermittently re-positioned by tug boat
(1445 - 1900 hrs) Marine construction
activities with contact with water: 1) derrick barge supported material lifting for rock cutting and pumping clean
seepage water within
silt curtain area
(0800 - 2200 hrs);
2) chain-cut the bed rock
inside the caisson
(no contact with
outside water body)
(0800 - 1900
hrs); 3) grab
dredger to excavate non-MD inside the
shaft and to load onto the derrick barge (double
silt curtain and tarpaulin sheeting beneath the moving grab in place) (0800 - 2000 hrs) Marine vessels on 11
January 2022: -
Derrick barge
x 1, grab dredger x 1, tug boat x 1 (Intake Shaft) -
Derrick barge
x 1, chain-cutting machine x 1 (Outfall Shaft) Dominating sea current direction was
found to be from Northwest to Southeast at waters to the west side of Tit Cham Chau; and
from West to East at waters to the east side of Tit Cham Chau. Stations WSR4 and WSR16 were located
distant from the construction site and the
possibility of being affected by marine construction activities was
considered limited. SS exceedances were however noted
at WSR4 (10.5
mg/L) and WSR16
(5.5 mg/L). No
SS exceedances were observed at WSR36 (3.8 mg/L) and WSR37 (3.5 mg/L),
where marine construction
activities were conducted. In view of the inverse relation between distance to marine works and SS level,
the SS exceedance is concluded not project
relevant. According to the field observation by
sampling team during sampling event, no silt
plume was observed in the Project site on
11 January 2022. Conditions of the protective silt
curtain at the inland water
outfall was satisfactory on 11 January 2022. |
|
Remarks |
Current direction during mid-ebb sampling on 11 January 2022:
Current direction during mid-flood sampling on 11 January 2022:
(Sourced from http://current.hydro.gov.hk/en/map.html) |

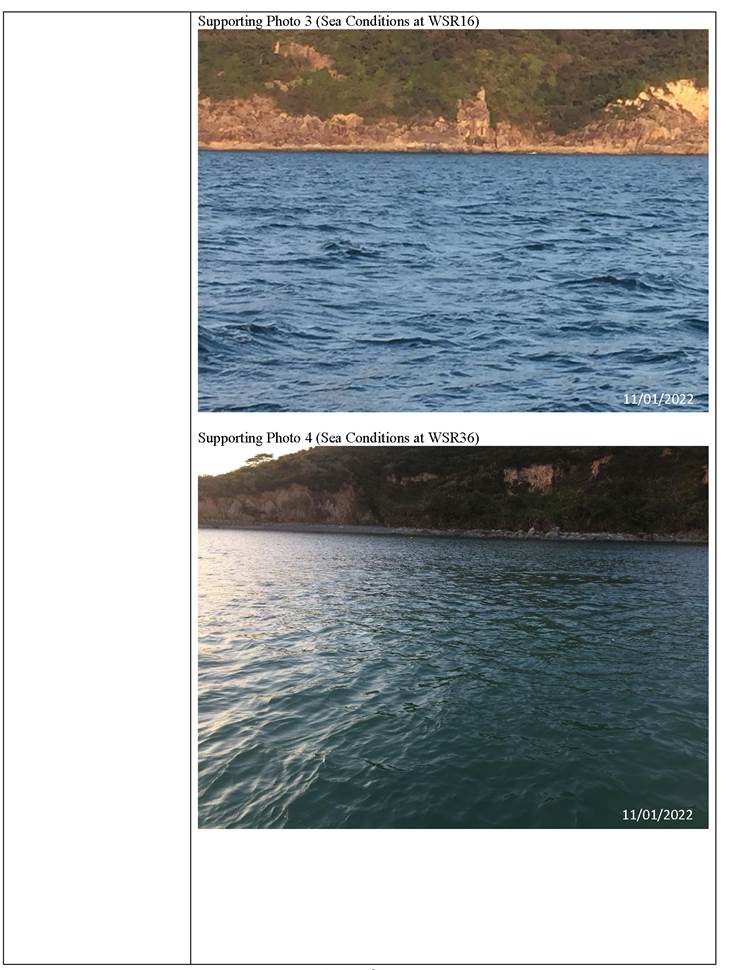
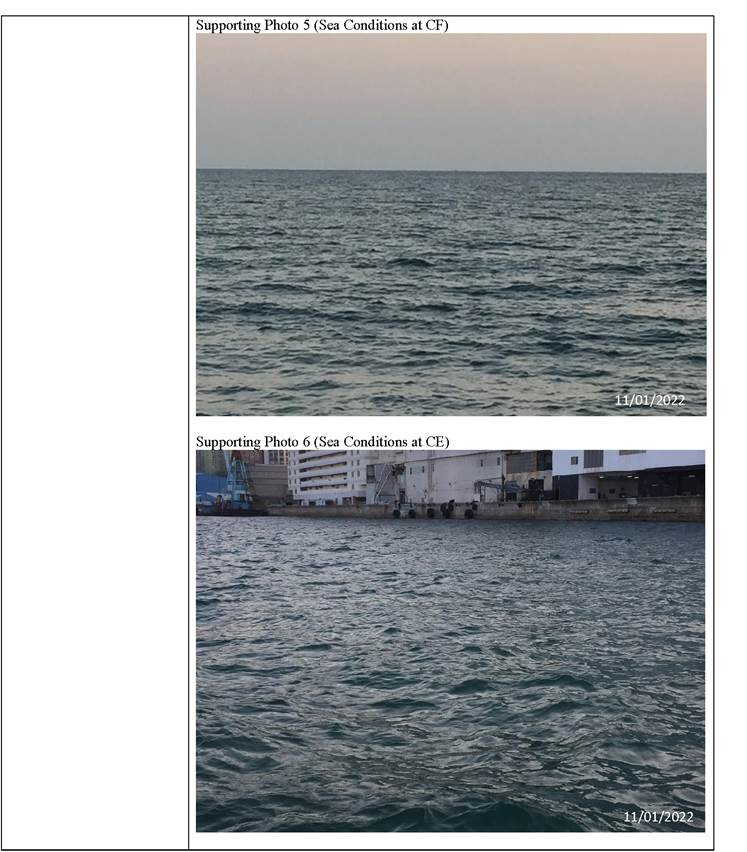
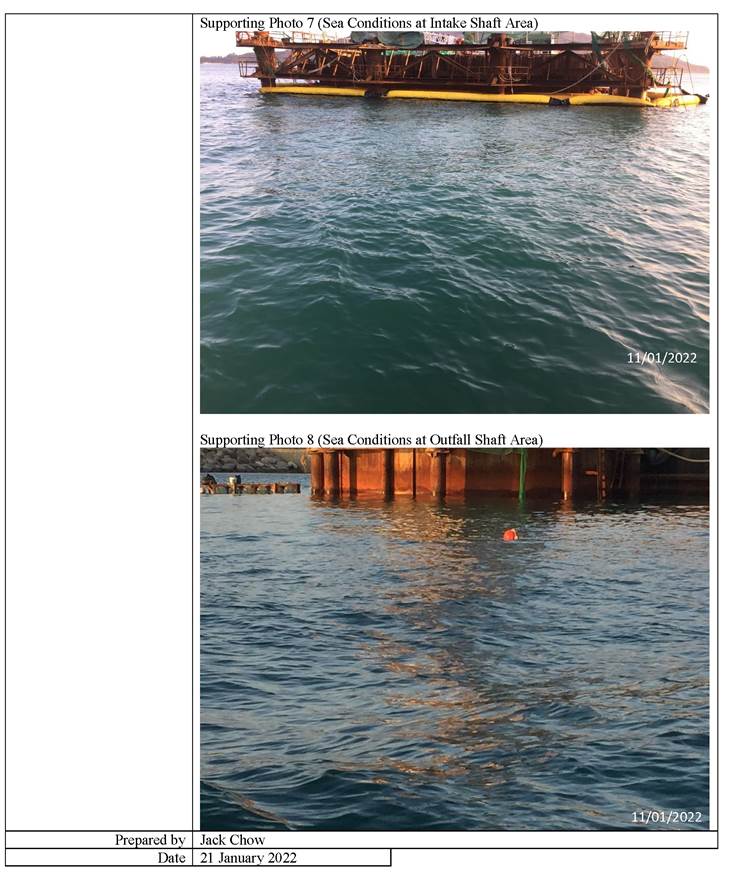
Incident Report
on Action Level or Limit Level Non-Compliance
|
Project |
Design, Build
and Operate First Stage of Tseung Kwan O Desalination
Plant |
|||
|
Date |
15 January 2022 (Lab result
received on 21 January 2022) |
|||
|
Time |
14:05-17:35 (Mid-Flood) and 09:15-12:45 (Mid-Ebb) |
|||
|
Mid-Ebb |
||||
|
Monitoring Location |
WSR3
|
|||
|
Parameter |
Suspended
Solid (SS) |
|||
|
Action &
Limit Levels |
Action Level |
Limit Level |
||
|
> 6.6 mg/L |
> 7.2 mg/L |
|||
|
Measurement Level |
Impact Station(s) of Exceedance |
Control Stations |
Impact Station(s) without Exceedance |
|
|
7.6 mg/L
(WSR 3) |
5.5 mg/L
(CE) 4.6 mg/L
(CF) |
5.0 mg/L (WSR1) 4.2 mg/L ( (WSR 2) 3.3 mg/L
(WSR 4) 4.7 mg/L
(WSR16) 3.0 mg/L
(WSR 33) 2.7 mg/L
(WSR 36) 4.7 mg/L
(WSR 37) |
||
|
Possible reason for Action or Limit
Level Non-compliance |
Outfall Shaft Area: marine
construction activities, 1) derrick barge supported material lifting
for rock cutting
and pumping clean seepage water within silt curtain area (0800 -2200 hrs); 2) chain-cut the bed rock
inside the caisson (0800 - 1900 hrs) Intake Shaft
Area: marine construction activities, namely 1) derrick barge assisted material lifting for the Blinding layer
concreting works inside the shaft (double silt curtain in place)
(0800 - 1900 hrs); 2) 1st roro
barge carrying 8 nr. concrete trucks (1st trip) for concreting Blinding layer
inside the shaft (double silt curtain in place) (0800 - 1400 hrs); 3) 1st roro barge carrying next 8 nr. Concrete trucks
(2nd trip) for concreting Blinding layer inside the shaft (double
silt curtain in place) (1400 - 1930
hrs); 4) 2nd roro barge (no loading) moored aside to stand by. No
involvement on any works (0800 - 1800 hrs); 5) tug boats and anchor boat assisted
positioning of working
barges (0800 - 1800 hrs) |
|||
|
|
Marine
construction activities with contact with water: 1) derrick barge supported material lifting for rock
cutting and pumping
clean seepage water
within silt curtain
area (0800 - 2200 hrs);
2) chain-cut the bed
rock inside the caisson (0800
- 1900 hrs) Marine
vessels on 15 January 2022: -
Derrick barge
x 1; roro barge x 2; tug boat x 2; anchor
boat x 1; concrete trucks
on roro barge
(Intake Shaft) -
Derrick barge
x 1, chain-cutting machine
x 1 inside the caisson (Outfall Shaft) Dominating sea current direction was found
to be from
Northwest to Southeast at waters to the west side of Tit Cham Chau; and
from West to East at waters to the east side of Tit Cham Chau. Station
WSR3 was located
distant from the construction site
and the possibility of being affected by marine construction
activities was considered limited. SS exceedance was however observed at WSR3 (7.6 mg/L). With reference to the
work schedule provided by the Main
Contractor, marine construction works were conducted at WSR36 (2.7 mg/L) and WSR37 (4.7 mg/L). No SS
exceedances were however observed at WSR36
and WSR37. In view of the inverse relation between distance to marine
works and SS level, the SS
exceedance is concluded not project relevant. According to the field observation by
sampling team during sampling event, no silt
plume was observed in the Contract site on 15 January 2022. Conditions of the protective silt curtain at the inland
water outfall was satisfactory on 15 January 2022. |
|
Remarks |
Current direction during
mid-ebb sampling on 15
January 2022:
(Sourced from http://current.hydro.gov.hk/en/map.html) |
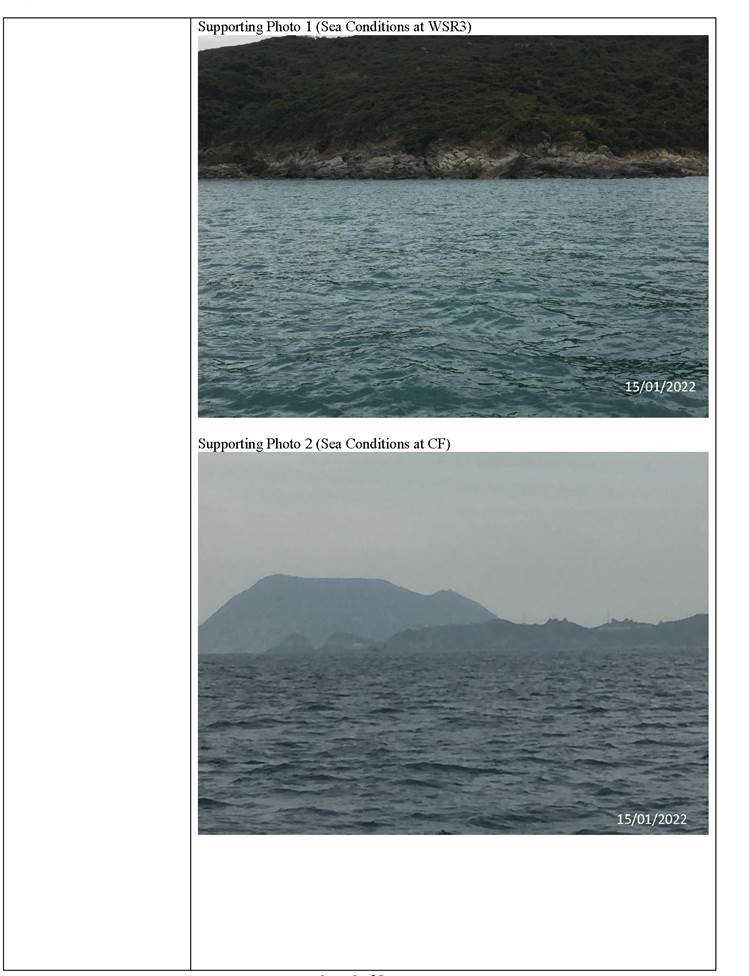
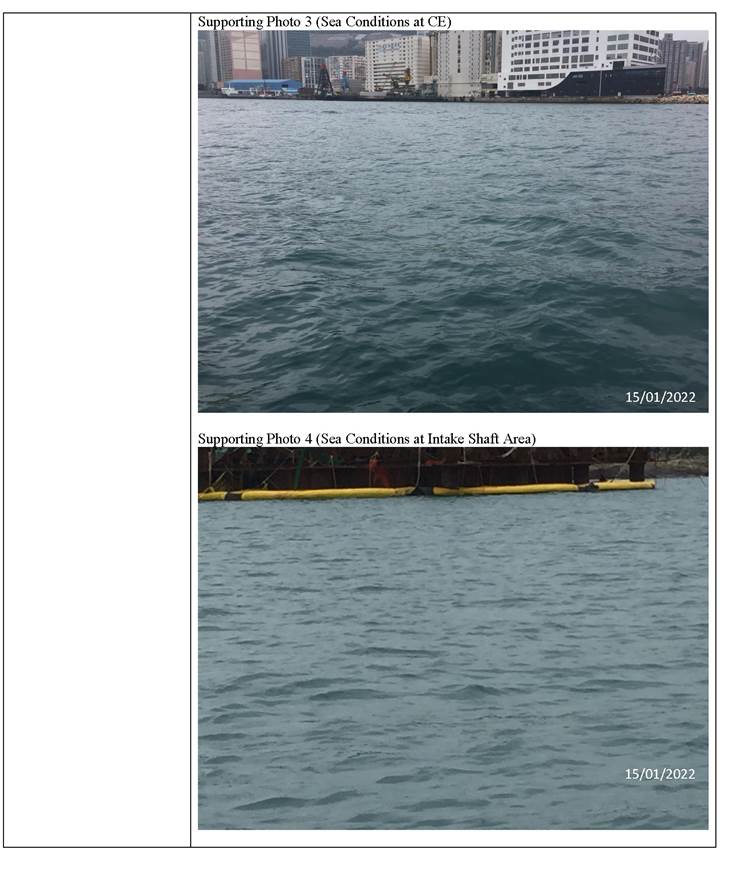
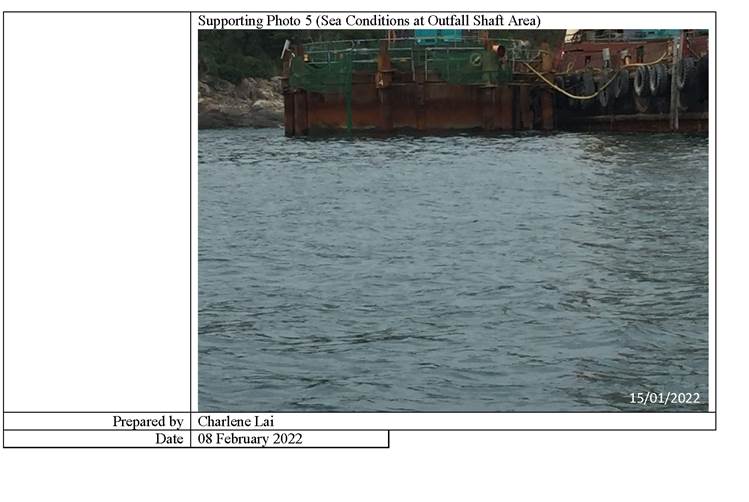
Incident Report
on Action Level or Limit Level Non-Compliance
|
Project |
Design, Build
and Operate First Stage of Tseung Kwan O Desalination
Plant |
|||
|
Date |
18 January 2022 (Lab result
received on 24 January 2022) |
|||
|
Time |
08:00:10:45 (Mid-Flood) and 10:48-14:18 (Mid-Ebb) |
|||
|
Mid-Ebb |
||||
|
Monitoring Location |
WSR1
|
|||
|
Parameter |
Suspended
Solid (SS) |
|||
|
Action &
Limit Levels |
Action Level |
Limit Level |
||
|
> 8.4 mg/L |
> 9.1 mg/L |
|||
|
Measurement Level |
Impact Station(s) of Exceedance |
Control Stations |
Impact Station(s) without Exceedance |
|
|
8.5 mg/L
(WSR 1) |
7.0 mg/L
(CE) 9.7 mg/L
(CF) |
3.3 mg/L
(WSR 2) 3.8 mg/L
(WSR 3) 3.5 mg/L
(WSR 4) 2.7 mg/L
(WSR16) 3.8 mg/L
(WSR 33) 3.8 mg/L
(WSR 36) 3.6 mg/L
(WSR 37) |
||
|
Possible reason for Action or Limit
Level Non-compliance |
Outfall Shaft Area: marine
construction activities, 1) derrick barge supported material lifting
for rock cutting
and pumping clean seepage water within silt curtain area (0800 -2200
hrs); 2) chain-cut the bed rock inside the caisson (0800 - 1900 hrs); 3) tug
boat assisted to maintain the silt curtain system
and material transport (0800
- 1830 hrs) Intake Shaft Area: marine
construction activities, namely 1) derrick barge supported diver��s work on inspecting concrete
finish, integrity of waling structure and the similar inspection works
inside the shaft (double silt
curtain in place) (0800 - 2100
hrs) Marine construction
activities with contact with water: 1) derrick barge supported material lifting for rock
cutting and pumping
clean seepage water
within silt curtain
area (0800 - 2200 hrs); 2) chain-cut the bed
rock inside the caisson (0800 - 1900 hrs); 3) derrick barge supported diver��s work on inspecting concrete
finish, integrity of waling structure
and the similar inspection works inside the shaft (double silt curtain in
place) (0800 - 2100 hrs) |
|||
|
|
Marine vessels on 18 January 2022: -
Derrick barge x 1 (Intake Shaft) -
Derrick barge x 1, chain-cutting machine x 1 inside the caisson; tug
boat x 1 (Outfall Shaft) Dominating sea current direction was found
to be from
Northwest to Southeast at waters to the west side of Tit Cham Chau; and
from West to East at waters to the east side of Tit Cham Chau. Station
WSR1 was located
distant from the construction site
and the possibility of being affected by marine construction
activities were considered limited. SS exceedance was however observed at WSR1 (8.5 mg/L). With reference to the
work schedule provided by the Main
Contractor, marine construction works were conducted at WSR36 (3.8 mg/L) and WSR37 (3.6 mg/L). No SS
exceedances were however observed at WSR36
and WSR37. In view of the inverse relation between distance to marine
works and SS level, the SS
exceedance is concluded not project
relevant. According to the field observation by
sampling team during sampling event, no silt
plume was observed in the Contract site on 18 January 2022. Conditions of the
protective silt curtain at the inland water outfall was satisfactory on 18 January 2022. |
|
Remarks |
Current direction during
mid-ebb sampling on 18
January 2022:
(Sourced from http://current.hydro.gov.hk/en/map.html) |
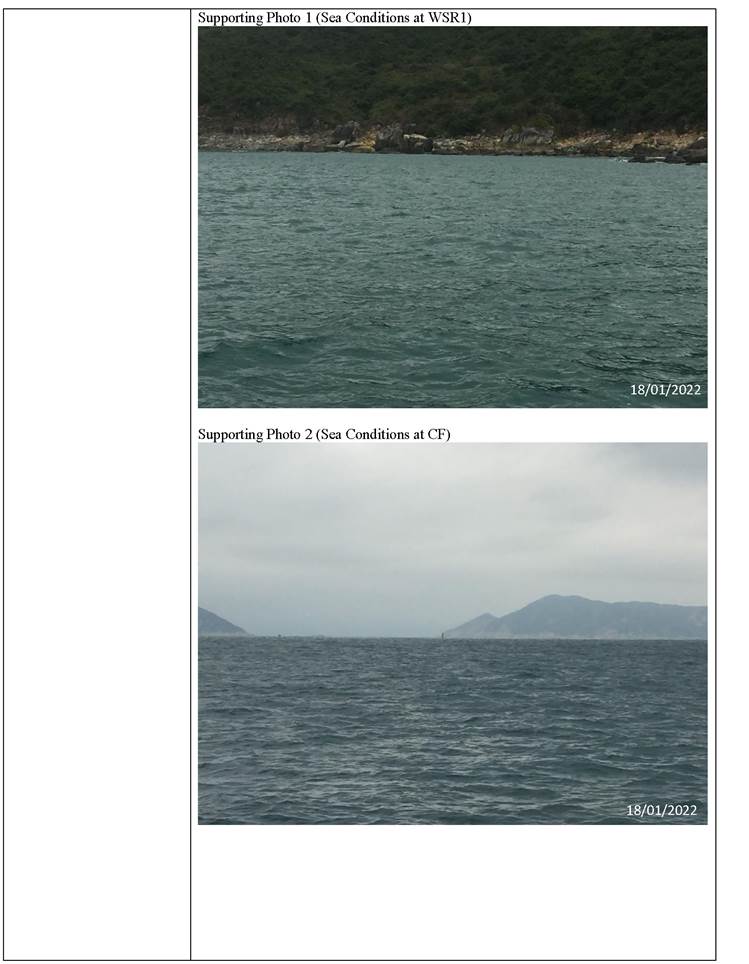
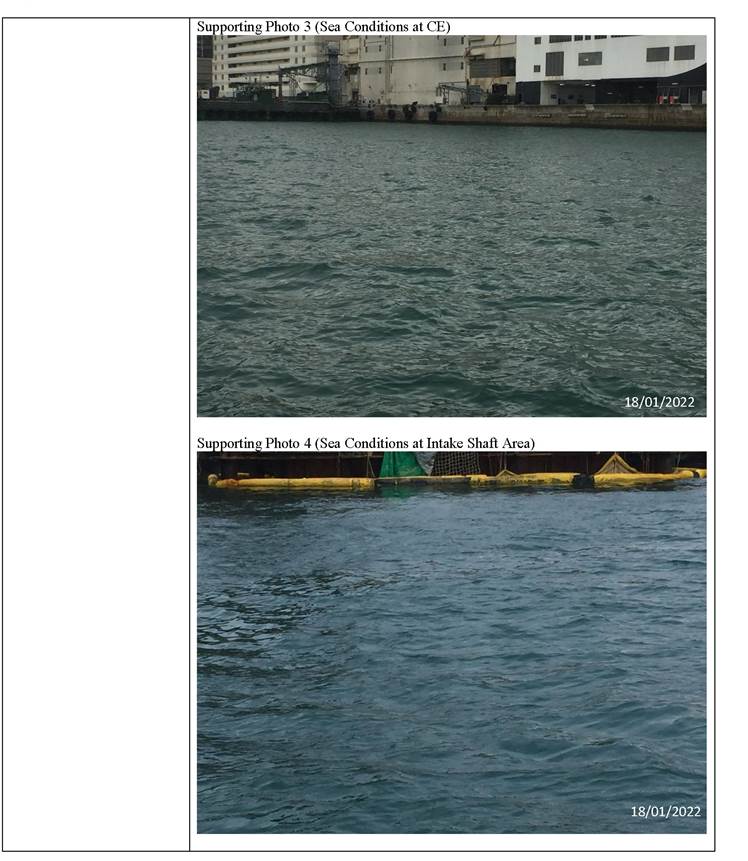
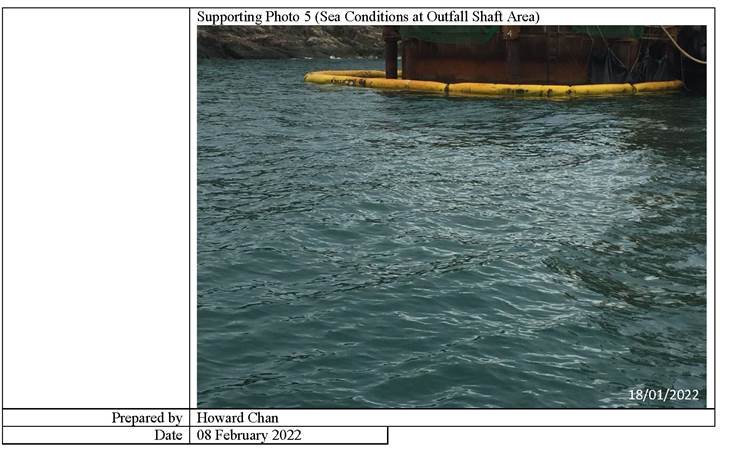
Incident Report
on Action Level
or Limit Level Non-Compliance
|
Project |
Design, Build
and Operate First Stage of Tseung Kwan
O Desalination Plant |
|||
|
Date |
20 January 2022 (Lab result
received on 26 January 2022) |
|||
|
Time |
08:00-10:25 (Mid-Flood) and 11:58-15:28 (Mid-Ebb) |
|||
|
Mid-Flood |
||||
|
Monitoring Location |
WSR16, WSR36, WSR37
|
|||
|
Parameter |
Suspended
Solid (SS) |
|||
|
Action & Limit Levels |
Action Level |
Limit Level |
||
|
> 5.4 mg/L |
> 6.0 mg/L |
|||
|
Measurement Level |
Impact
Station(s) of Exceedance |
Control Stations |
Impact
Station(s) without Exceedance |
|
|
5.5 mg/L
(WSR 16) 7.0 mg/L
(WSR 36) 5.5 mg/L (WSR
37) |
4.0 mg/L
(CE) 4.5 mg/L
(CF) |
5.0 mg/L (WSR1) 4.5 mg/L
(WSR 2) 4.5 mg/L
(WSR 3) 5.2 mg/L (WSR4) 4.8 mg/L (WSR
33) |
||
|
Possible reason for Action or Limit Level
Non-compliance |
Outfall Shaft
Area: marine construction activities, namely 1) derrick barge supported material lifting for rock cutting
and pumping clean
seepage water within
silt curtain area
(0800 - 2100 hrs);
2) chain-cut the bed rock inside the caisson (0800
- 1900 hrs) Intake Shaft Area: marine
construction activities, namely 1) derrick barge mobilized tools & equipment to prepare for TBM
retrieval and welding work inside the shaft
(double silt curtain in place) (0800 - 1800 hrs) Marine construction
activities with contact with water: 1) derrick barge supported material lifting for rock cutting and pumping clean
seepage water within
silt curtain area
(0800 - 2100 hrs);
2) chain-cut the bed rock inside the caisson (0800
- 1900 hrs) Marine vessels on 20 January 2022: -
Derrick barge
x 1 (Intake Shaft) -
Derrick barge
x 1, chain-cutting machine x 1 inside
the caisson (Outfall Shaft) |
|||
|
|
Dominating sea current direction was found to be from
Southeast to Northwest at waters to the west side of Tit Cham Chau; and
from Northeast to Southwest at waters to the
east side of Tit Cham Chau. Station WSR16 was located distant from the
construction site and the possibility of being affected by marine construction activities was considered limited. SS exceedance was however observed at WSR16 (5.5 mg/L). With reference to
the work schedule provided by the Main
Contractor, marine construction works were conducted at WSR36 and WSR37 on 20 January 2022. The SS
level at WSR37 (5.5 mg/L) was however the same
to that at WSR16, which located further from the construction site. Although marine constructions works were
conducted at WSR36, no works were in contact with water. Hence the SS exceedance at WSR36 (7.0 mg/L) maybe
caused by other natural factors. According to the field observation by
sampling team during sampling event, no silt
plume was observed in the Project site on
20 January 2022. Conditions of the protective silt curtain at the inland water
outfall was satisfactory on 20
January 2022. |
|||
|
Mid-Ebb |
||||
|
Monitoring Location |
WSR16,
WSR33, WSR36, WSR37
|
|||
|
Parameter |
Suspended
Solid (SS) |
|||
|
Action & Limit Levels |
Action Level |
Limit Level |
||
|
> 6.0 mg/L |
> 6.5 mg/L |
|||
|
Measurement Level |
Impact
Station(s) of Exceedance |
Control Stations |
Impact
Station(s) without Exceedance |
|
|
7.2 mg/L (WSR16) 8.7 mg/L (WSR33) 6.7 mg/L (WSR36) 7.8 mg/L (WSR37) |
5.0 mg/L
(CE) 6.0 mg/L
(CF) |
5.5 mg/L (WSR1) 6.0 mg/L (WSR2) 5.2 mg/L (WSR3) 5.2 mg/L (WSR4) |
||
|
Possible reason for Action or Limit Level
Non-compliance |
Outfall Shaft Area: marine
construction activities, namely 1) derrick barge supported material lifting for rock cutting
and pumping clean
seepage water within
silt curtain area
(0800 - 2100 hrs);
2) chain-cut the bed rock inside the caisson (0800
- 1900 hrs) |
|||
|
|
Intake Shaft Area: marine
construction activities, namely 1) derrick barge mobilized tools & equipment to prepare for TBM
retrieval and welding work inside the shaft
(double silt curtain in place) (0800 - 1800 hrs) Marine construction
activities with contact with water: 1) derrick barge supported material lifting for rock cutting and pumping clean
seepage water within
silt curtain area
(0800 - 2100 hrs);
2) chain-cut the bed rock inside the caisson (0800
- 1900 hrs) Marine vessels on 20 January 2022: -
Derrick barge
x 1 (Intake Shaft) -
Derrick barge
x 1, chain-cutting machine x 1 inside
the caisson (Outfall Shaft) Dominating sea current direction was
found to be from Northwest to Southeast at waters to the west side of Tit Cham Chau; and
from West to East at waters to the east side of Tit Cham Chau. Station WSR16 was located
distant from the construction site and the possibility of being
affected by marine
construction activities was considered limited. SS exceedance was however noted
at WSR16 (7.2
mg/L). According to the work schedule provided by the Main Contractor, no marine construction works with contact
with water was conducted
at WSR36 during mid-ebb tide on 20 January 2022. SS exceedance was however observed at WSR36 (6.7 mg/L). A
downstream station, WSR33 (8.7 mg/L), showed
higher SS level than that of WSR36, where no marine construction activities with contact with water was
conducted at WSR36.
Although marine construction works with contact
with water were scheduled at WSR37 during mid-ebb tide, the SS level at WSR37 (7.8 mg/L) was similar to that at
WSR16. In view of the inverse relation between
distance to marine works and SS level, the SS exceedance is concluded not project
relevant. According to the field observation by
sampling team during sampling event, no silt
plume was observed in the Project site on
20 January 2022. Conditions of the protective silt curtain at the inland
water outfall was satisfactory on 20
January 2022. |
|
Remarks |
Current direction during
mid-ebb sampling on 20 January 2022:
|
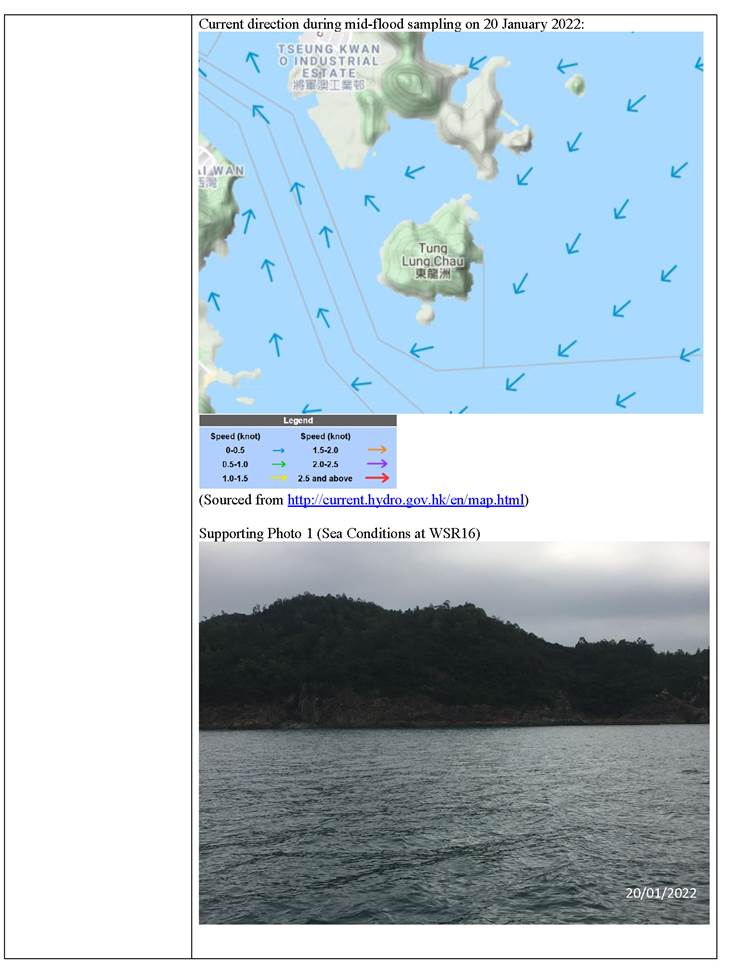
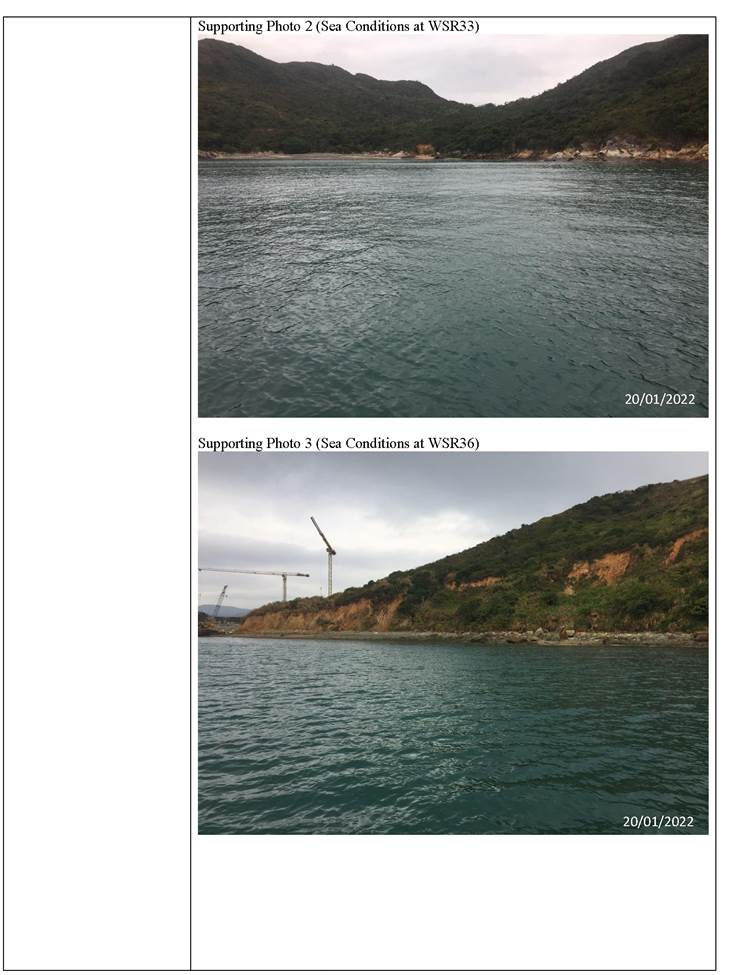
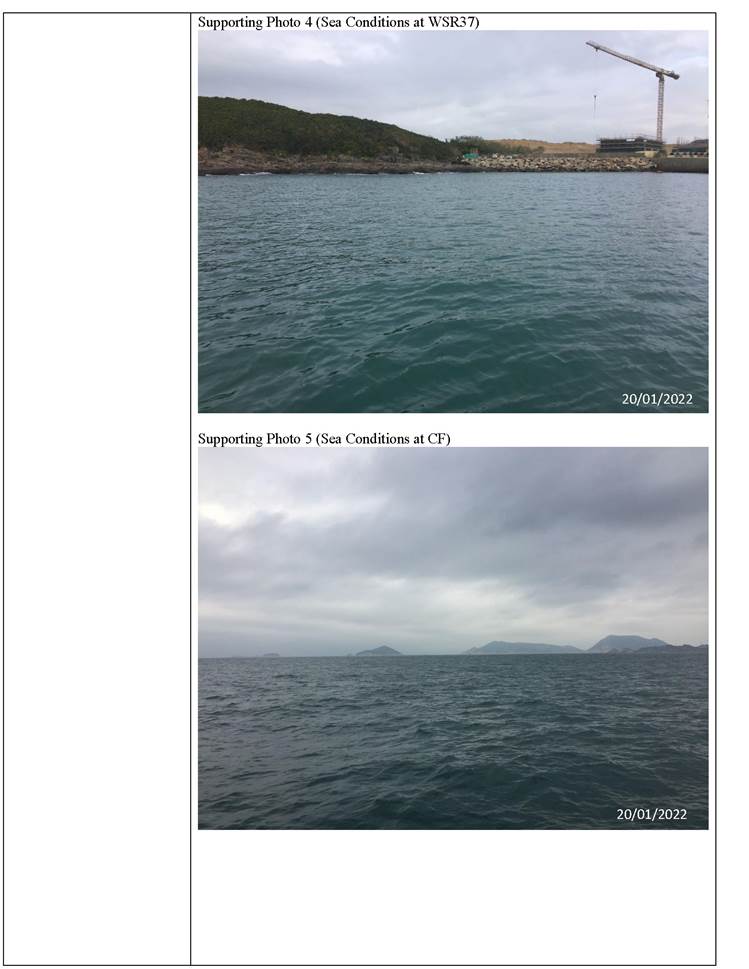
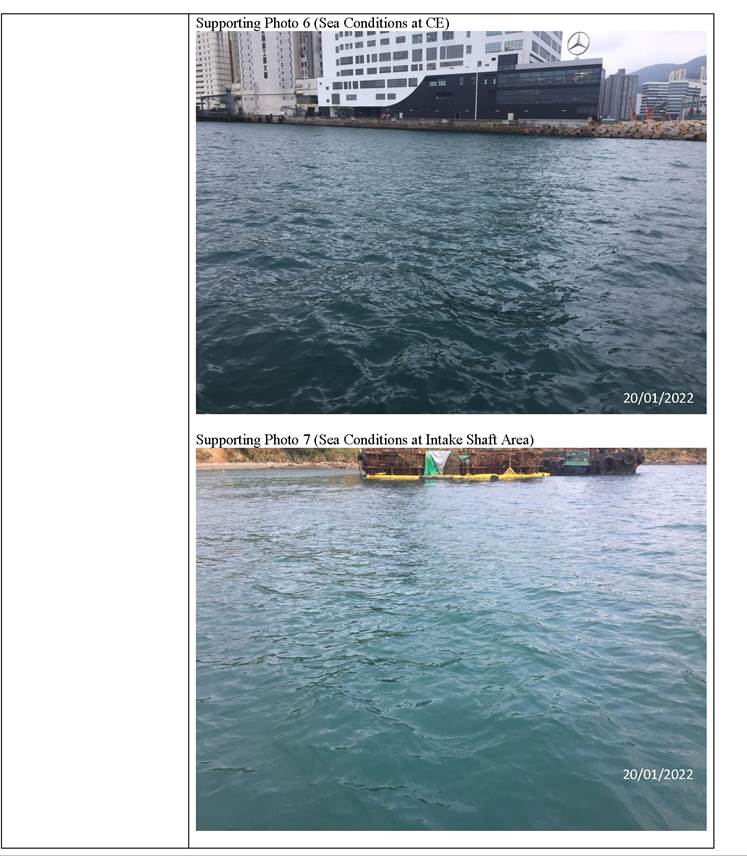
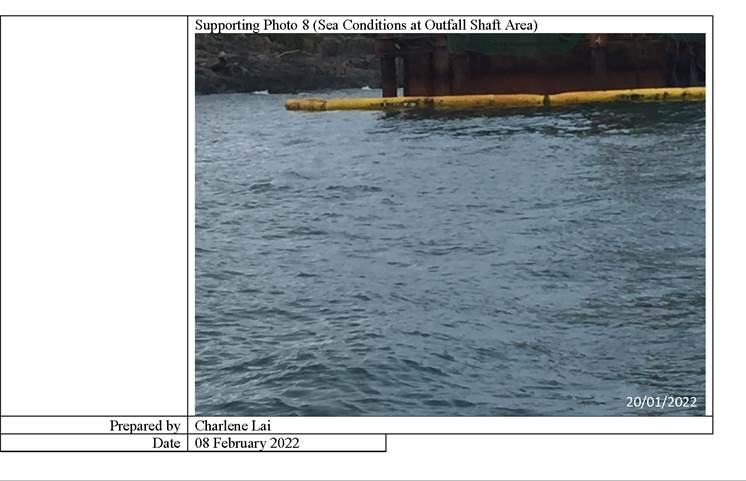
Incident Report
on Action Level
or Limit Level Non-Compliance
|
Project |
Design, Build
and Operate First Stage of Tseung Kwan
O Desalination Plant |
|||
|
Date |
22 January 2022 (Lab result
received on 28 January 2022) |
|||
|
Time |
08:02-11:32 (Mid-Flood) and 13:24-16:54 (Mid-Ebb) |
|||
|
Mid-Flood |
||||
|
Monitoring Location |
WSR4, WSR33, WSR37
|
|||
|
Parameter |
Suspended
Solid (SS) |
|||
|
Action & Limit Levels |
Action Level |
Limit Level |
||
|
> 5.0 mg/L |
> 6.0 mg/L |
|||
|
Measurement Level |
Impact
Station(s) of Exceedance |
Control Stations |
Impact
Station(s) without Exceedance |
|
|
10.7 mg/L (WSR
4) 5.3 mg/L (WSR 33) 5.7 mg/L (WSR
37) |
6.0 mg/L
(CE) 4.2 mg/L
(CF) |
3.8 mg/L (WSR1) 3.7 mg/L
(WSR 2) 4.0 mg/L
(WSR 3) 4.2 mg/L
(WSR 16) 4.2 mg/L (WSR
36) |
||
|
Possible reason for Action or Limit Level
Non-compliance |
Outfall Shaft
Area: marine construction activities, namely 1) derrick barge supported material lifting for rock cutting
and pumping clean
seepage water within
silt curtain area
(0800 - 2100 hrs);
2) chain-cut the bed rock inside the caisson (0800
- 1900 hrs) Intake Shaft Area: marine
construction activities, namely 1) derrick barge assisted to mobilize vibratory hammer for retrieving
7 nrs. pipe piles. All works inside the double silt curtain (0800
- 1800 hrs) Marine construction
activities with contact with water: 1) derrick barge supported material lifting for rock cutting and pumping clean
seepage water within
silt curtain area
(0800 - 2100
hrs); 2) chain-cut the bed rock inside the caisson (0800 - 1900 hrs); 3) derrick barge assisted to mobilize
vibratory hammer for retrieving 7 nrs. pipe piles. All works inside the double silt curtain (0800 - 1800 hrs) Marine vessels on 22 January 2022: -
Derrick barge
x 1, vibratory hammer x 1 (Intake
Shaft) -
Derrick barge
x 1, chain-cutting machine x 1 inside
the caisson (Outfall Shaft) |
|||
|
|
Dominating sea current direction was found to be from
Southeast to Northwest at waters to the west side of Tit Cham Chau; and
from Northeast to Southwest at waters to the
east side of Tit Cham Chau. Station WSR4 was located distant from the construction site and the
possibility of being
affected by marine construction activities was considered limited. SS
exceedance was however observed at
WSR4 (10.7 mg/L). Although marine construction activities were scheduled at WSR36 and WSR37 during
mid-flood tide, the SS level at WSR36 (4.2
mg/L) and WSR37 (5.7 mg/L) were lower than stations that located
further from the construction site,
namely WSR4. An upstream station, WSR33, has a higher SS level (5.3 mg/L) than that of WSR36 (4.2
mg/L), and lower than stations that located further from the construction site (WSR4). Hence
the SS exceedance at WSR33 maybe caused
by other natural factors. In view
of the inverse
relation between distance to marine works
and SS levels, the SS
exceedance is concluded not project relevant. According to the field observation by
sampling team during sampling event, no silt
plume was observed in the Contract site
on 22 January 2022. Conditions of the protective silt curtain at the inland water
outfall was satisfactory on 22
January 2022. |
|||
|
Mid-Ebb |
||||
|
Monitoring Location |
WSR3
|
|||
|
Parameter |
Suspended
Solid (SS) |
|||
|
Action & Limit Levels |
Action Level |
Limit Level |
||
|
> 5.0 mg/L |
> 6.0 mg/L |
|||
|
Measurement Level |
Impact
Station(s) of Exceedance |
Control Stations |
Impact
Station(s) without Exceedance |
|
|
5.2 mg/L (WSR3) |
4.2 mg/L
(CE) 5.0 mg/L (CF) |
4.8 mg/L (WSR1) 5.0 mg/L (WSR2) 5.0 mg/L (WSR4) 4.8 mg/L (WSR16) 4.8 mg/L (WSR33) 3.7 mg/L (WSR36) 3.3 mg/L (WSR37) |
||
|
Possible reason for Action or Limit Level
Non-compliance |
Outfall Shaft
Area: marine construction activities, namely 1) derrick barge supported material lifting for rock
cutting and pumping
clean seepage water
within silt curtain area (0800 - 2100 hrs);
2) chain-cut the bed rock inside the caisson (0800
- 1900 hrs) Intake Shaft Area: marine
construction activities, namely 1) derrick barge assisted to mobilize vibratory hammer for retrieving
7 nrs. pipe piles. All works inside the double silt curtain (0800
- 1800 hrs) Marine construction
activities with contact with water: 1) derrick barge supported material lifting for rock cutting and pumping clean
seepage water within
silt curtain area
(0800 - 2100
hrs); 2) chain-cut the bed rock inside the caisson (0800 - 1900 hrs); 3) derrick barge assisted to mobilize
vibratory hammer for retrieving 7 nrs. pipe piles. All works inside the double silt curtain (0800 - 1800 hrs) Marine vessels on 22 January 2022: -
Derrick barge
x 1, vibratory hammer x 1 (Intake
Shaft) -
Derrick barge
x 1, chain-cutting machine x 1 inside
the caisson (Outfall Shaft) Dominating sea current direction was
found to be from Northwest to Southeast at waters to the west side of Tit Cham Chau; and
from West to East at waters to the east side of Tit Cham Chau. Station
WSR3 was located distant from the construction site and the possibility of being affected by marine construction
activities was considered limited. SS exceedance was however noted at WSR3 (5.2 mg/L). With reference to the work
schedule provided by the Main
Contractor, marine construction works were conducted at WSR36 (3.7 mg/L) and WSR 37 (3.3 mg/L). No SS
exceedances were however observed at WSR36 and WSR37. In view
of the inverse
relation between distance to marine works
and SS level,
the SS exceedance is concluded not project
relevant. According to the field observation by sampling
team during sampling event, no silt plume
was observed in the
Contract site on 22 January 2022. Conditions of the protective silt
curtain at the inland water
outfall was satisfactory on 22 January 2022. |
|
Remarks |
Current direction during mid-ebb sampling on 22 January 2022:
Current direction during mid-flood sampling on 22 January 2022:
(Sourced from
http://current.hydro.gov.hk/en/map.html) |
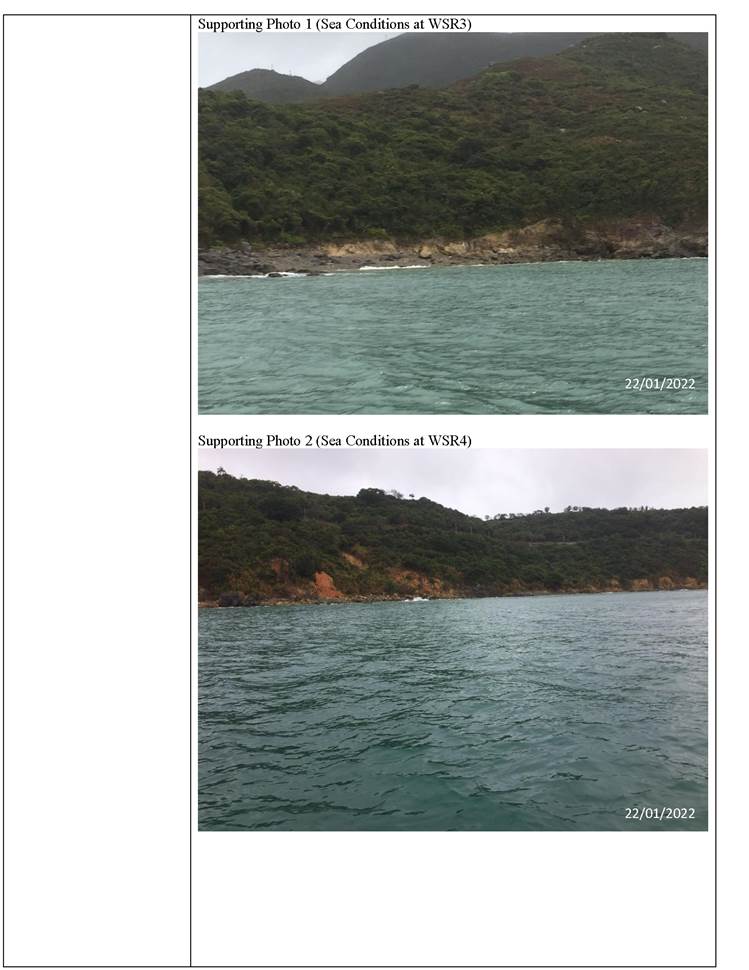
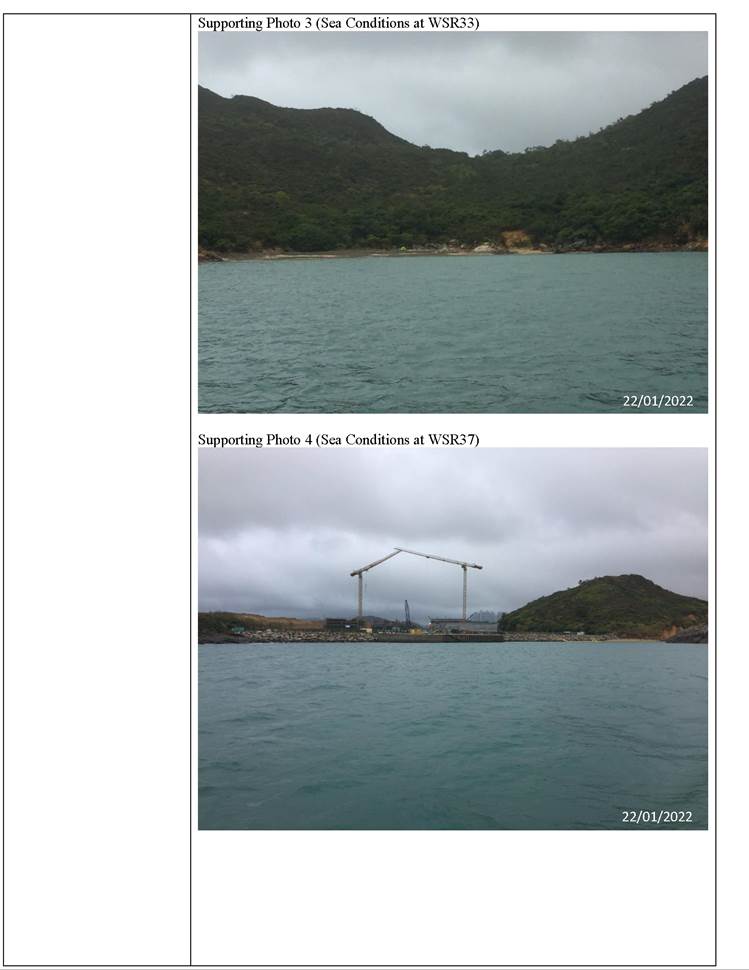
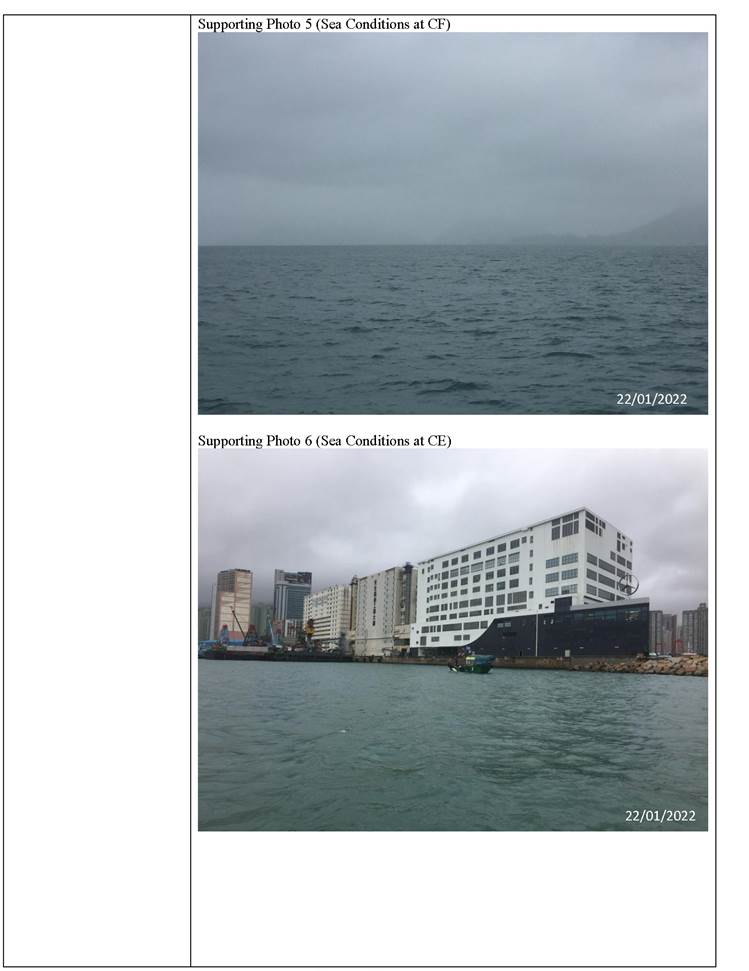
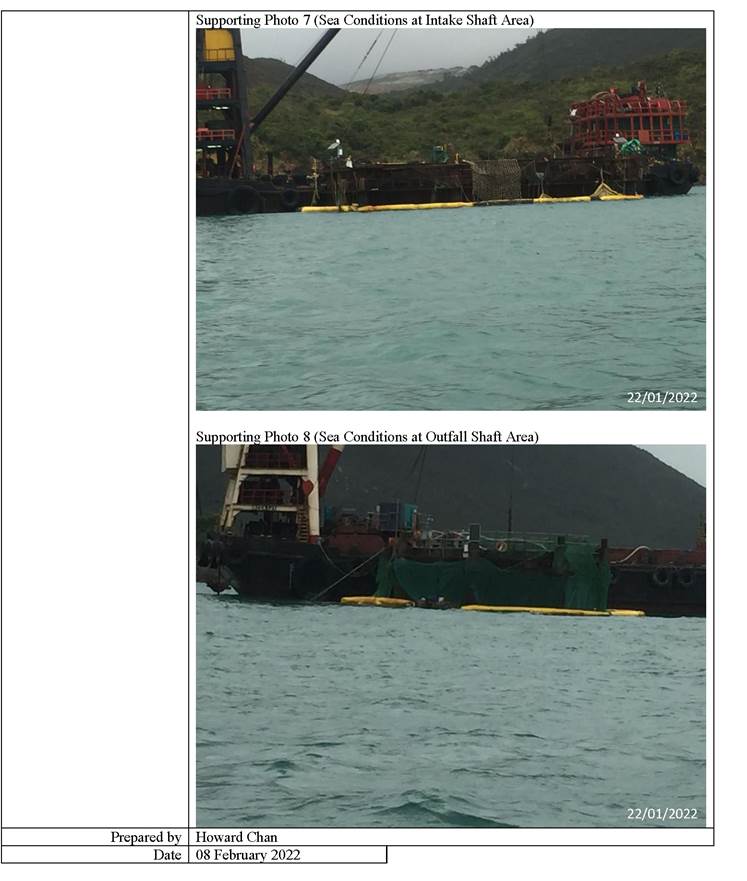
Incident Report
on Action Level
or Limit Level Non-Compliance
|
Project |
Design, Build
and Operate First Stage of Tseung Kwan
O Desalination Plant |
|||
|
Date |
25 January 2022 (Lab result
received on 31 January 2022) |
|||
|
Time |
09:59-13:29 (Mid-Flood) and 15:43-19:00 (Mid-Ebb) |
|||
|
Mid-Ebb |
||||
|
Monitoring Location |
WSR37
|
|||
|
Parameter |
Suspended
Solid (SS) |
|||
|
Action & Limit Levels |
Action Level |
Limit Level |
||
|
> 5.0 mg/L |
> 6.0 mg/L |
|||
|
Measurement Level |
Impact
Station(s) of Exceedance |
Control Stations |
Impact
Station(s) without Exceedance |
|
|
5.5 mg/L
(WSR 37) |
2.8 mg/L
(CE) 2.8 mg/L
(CF) |
2.7 mg/L (WSR1) 3.8 mg/L
(WSR 2) 3.1 mg/L
(WSR 3) 4.2 mg/L
(WSR 4) 4.2 mg/L
(WSR16) 3.5 mg/L
(WSR 33) 4.7 mg/L
(WSR 36) |
||
|
Possible reason for Action or Limit Level
Non-compliance |
Outfall Shaft Area: marine construction activities, 1) derrick
barge supported material lifting for rock cutting and pumping clean seepage water within silt curtain area (0800 -2200 hrs); 2) chain-cut the bed rock
inside the caisson
(0800 - 1900 hrs) Intake Shaft Area: marine
construction activities, namely 1) derrick barge assisted housekeeping work inside its hopper (0800 - 1800 hrs) Marine construction
activities with contact with water: 1) derrick barge supported material lifting for rock cutting and pumping clean
seepage water within
silt curtain area
(0800 -2200 hrs); 2) chain-cut the bed rock
inside the caisson
(0800 - 1900 hrs) Marine vessels on 25 January 2022: -
Derrick barge
x 1 (Intake Shaft) -
Derrick barge
x 1, chain-cutting machine x 1 inside
the caisson (Outfall Shaft) |
|||
|
|
Dominating sea current direction was
found to be from Northwest to Southeast at waters to the west side of Tit Cham Chau; and
from West to East at waters to the east side of Tit Cham Chau. It was noted that pumping of the clean
seepage of marine water within the silt curtain was conducted on 25 January 2022. As advised by Main
contractor, two separate pumping
systems were constructed for respectively the
unpolluted water ingress
through the edge
of the caisson
and surface water/
washings from the rock drilling/ chain cutting work. For unpolluted marine water
ingress, it will be piped to an isolated metal skip where appropriate-sized submersible pumps sink in to pump out
the ��clean�� water into an abandoned tremie pipe out of the caisson. The discharge point
shall be enclosed by a silt
curtain setup. Since
the seepage marine
water was unpolluted, the seepage water
can be discharged to water bodies
without a water
discharge license. For surface water/washings resulted from rock
cutting activities, it will be directly pumped at the local low point
all the way
up to the water treatment facilities/water sedimentation tank
in place on the derrick barge aside. The expected silty water will be
treated by water treatment facilities/water sedimentation tank before
being piped to discharge within
silt curtain area. As been
advised by the Main Contractor, on-site operative verified the unpolluted seepage
water was visually clear on 25 January 2022.
The SS level
at WSR37 (5.5 mg/L) was similar to that at
WSR36 (4.7 mg/L), which is a downstream station where no SS exceedance
was observed. According to the field
observation by sampling team during sampling event, no silt plume
was observed in the
Contract site on 25 January 2022. Conditions of the protective silt curtain at the inland water
outfall was satisfactory on 25
January 2022. |
|
Remarks |
Current direction during mid-ebb sampling on 25 January 2022:
(Sourced from http://current.hydro.gov.hk/en/map.html) |
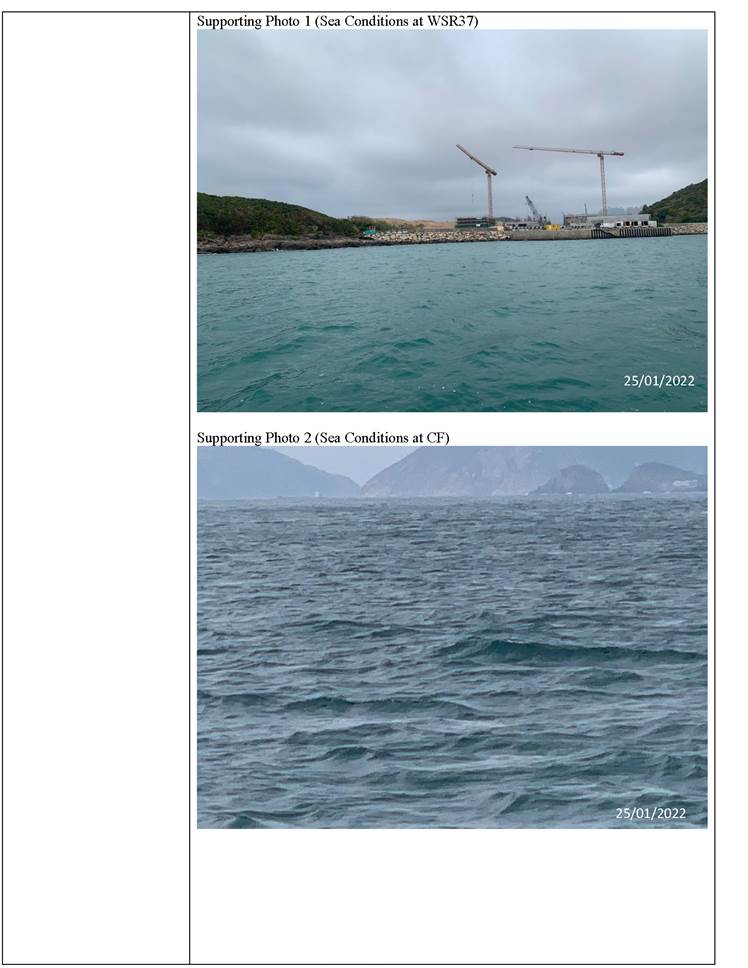
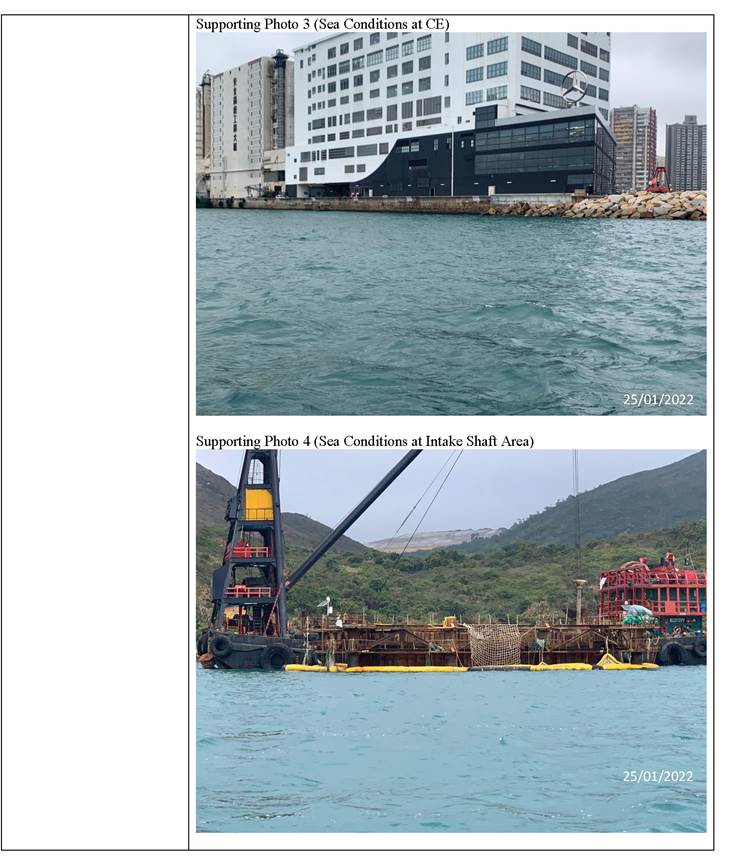
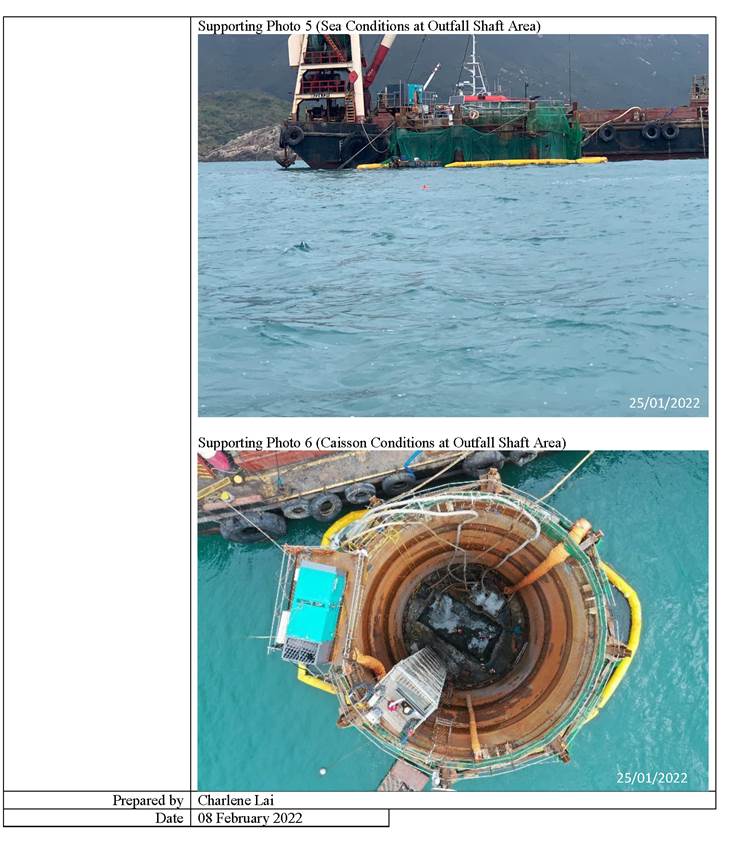
Incident Report
on Action Level
or Limit Level Non-Compliance
|
Project |
Design, Build
and Operate First Stage of Tseung Kwan
O Desalination Plant |
|||
|
Date |
27 January 2022 (Lab result
received on 05 February 2022) |
|||
|
Time |
11:26-14:56 (Mid-Flood) and 08:00-09:12 (Mid-Ebb) |
|||
|
Mid-Ebb |
||||
|
Monitoring Location |
WSR1, WSR33
|
|||
|
Parameter |
Suspended
Solid (SS) |
|||
|
Action & Limit Levels |
Action Level |
Limit Level |
||
|
> 8.4 mg/L |
> 9.1 mg/L |
|||
|
Measurement Level |
Impact
Station(s) of Exceedance |
Control Stations |
Impact
Station(s) without Exceedance |
|
|
10.3 mg/L (WSR
1) 10.3 mg/L (WSR
33) |
7.0 mg/L
(CE) 5.8 mg/L
(CF) |
4.6 mg/L
(WSR 2) 6.3 mg/L
(WSR 3) 5.2 mg/L
(WSR 4) 4.7 mg/L
(WSR16) 4.2 mg/L
(WSR 36) 3.8 mg/L
(WSR 37) |
||
|
Possible reason for Action or Limit Level
Non-compliance |
Outfall Shaft Area: marine construction activities, 1) derrick
barge supported material lifting for rock
breaking and pumping clean seepage water
within silt curtain area (0800 -2100 hrs); 2) mini-backhoe broke the bed
rock inside the
caisson (0800 - 1900 hrs) Intake Shaft Area: marine
construction activities, namely 1) derrick barge assisted to demobilize vibratory hammer
and the retrieved pipe
piles (0800 - 2300 hrs) Marine construction activities with contact
with water: 1) derrick barge supported material
lifting for rock breaking and pumping clean seepage water within silt curtain area (0800
-2100 hrs) Marine vessels on 27 January 2022: -
Derrick barge
x 1; vibratory hammer
x 1 (Intake Shaft) -
Derrick barge
x 1; mini-backhoe x 1 inside the caisson (Outfall Shaft) Dominating sea current direction was
found to be from Northwest to Southeast at waters to the west side of Tit Cham Chau; and
from West to East at waters to the east side of Tit Cham Chau. |
|||
|
|
Station WSR1 was located distant from the construction site and the
possibility of being
affected by marine construction activities were considered limited. SS
exceedance was however observed at WSR1 (10.3
mg/L). With reference to the work
schedule provided by the Main Contractor, marine
construction works were conducted at WSR36 (4.2 mg/L) and WSR37 (3.8 mg/L). No SS exceedances were however
observed at WSR36 and WSR37. The
SS level at WSR33 (10.3 mg/L) was at the same level to that located further from the site (WSR1),
suggesting that the SS exceedance at WSR33 maybe caused by other natural factors. In view of the inverse
relation between distance to marine works
and SS level, the SS
exceedance is concluded not project relevant. According to the field observation by
sampling team during sampling event, no silt
plume was observed in the Contract site
on 27 January 2022. Conditions of the protective silt curtain at the inland water
outfall was satisfactory on 27
January 2022. |
|
Remarks |
Current direction during mid-ebb sampling on 27 January 2022:
(Sourced from http://current.hydro.gov.hk/en/map.html) |
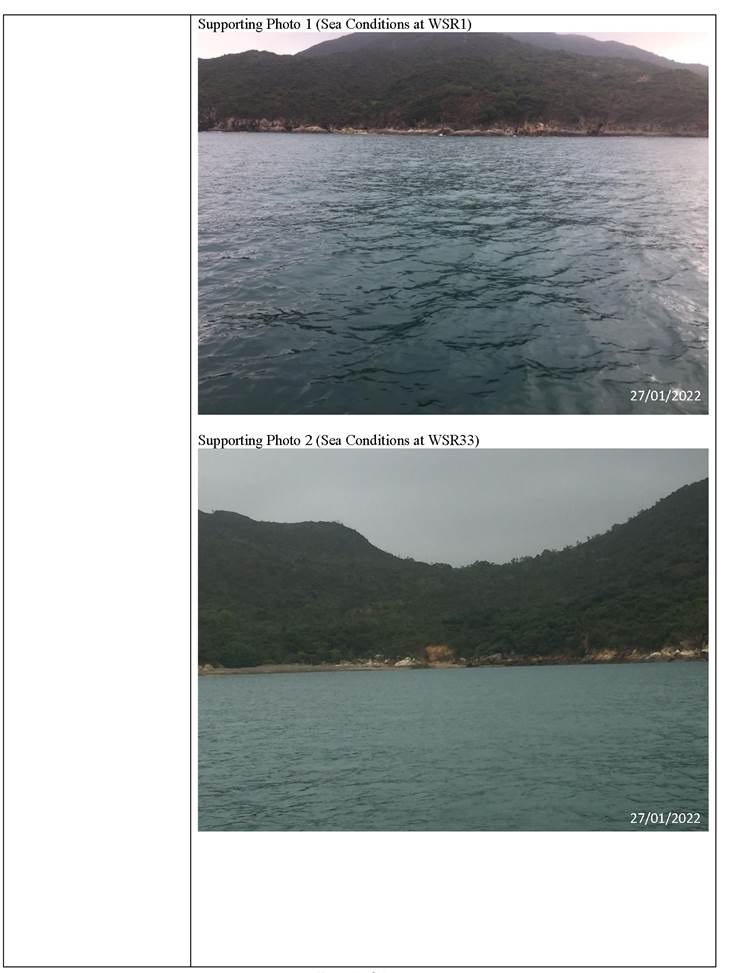
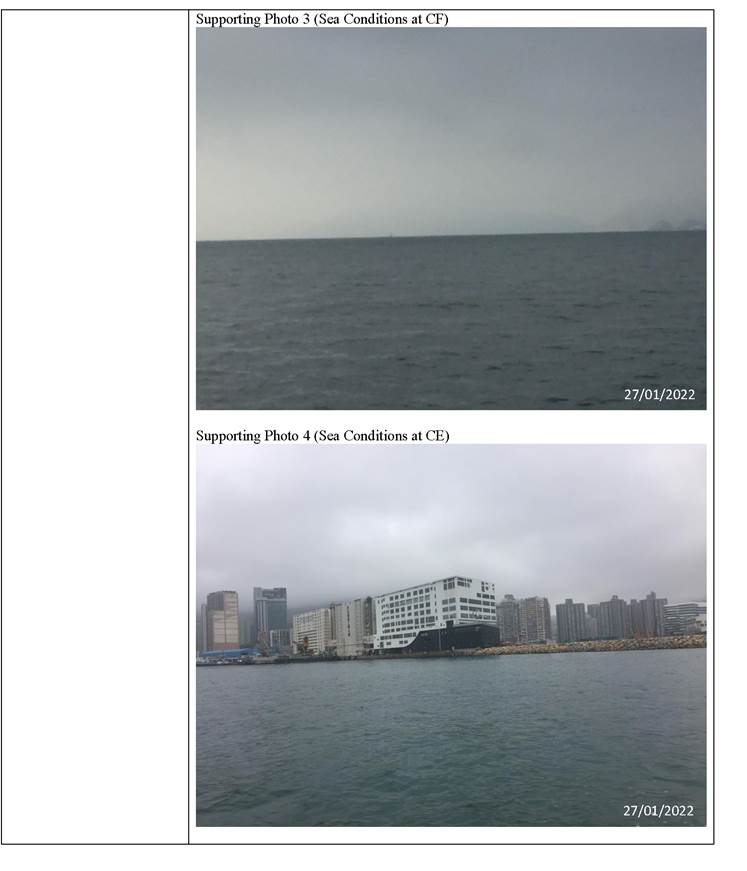
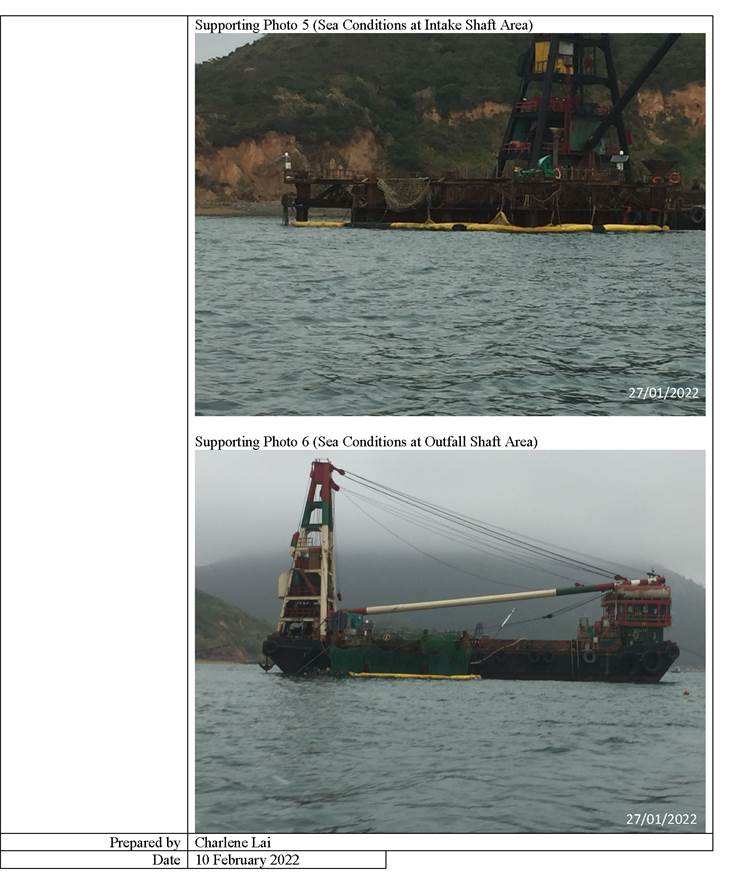
Incident Report
on Action Level
or Limit Level Non-Compliance
|
Project |
Design, Build
and Operate First Stage of Tseung Kwan
O Desalination Plant |
|||
|
Date |
29 January 2022 (Lab result
received on 08 February 2022) |
|||
|
Time |
13:10-16:40 (Mid-Flood) and 08:14-11:44 (Mid-Ebb) |
|||
|
Mid-Ebb |
||||
|
Monitoring Location |
WSR3, WSR4
|
|||
|
Parameter |
Suspended
Solid (SS) |
|||
|
Action & Limit Levels |
Action Level |
Limit Level |
||
|
> 6.8 mg/L |
> 7.4 mg/L |
|||
|
Measurement Level |
Impact
Station(s) of Exceedance |
Control Stations |
Impact
Station(s) without Exceedance |
|
|
9.3 mg/L
(WSR 3) 19.0 mg/L (WSR
4) |
5.7 mg/L
(CE) 4.1 mg/L
(CF) |
4.1
mg/L (WSR 1) 4.2
mg/L (WSR 2) 6.6 mg/L
(WSR16) 5.5 mg/L
(WSR 33) 5.8 mg/L
(WSR 36) 2.9 mg/L
(WSR 37) |
||
|
Possible reason for Action or Limit Level
Non-compliance |
Outfall Shaft Area: marine construction activities, 1) derrick
barge supported material lifting for rock
breaking and pumping clean seepage water
within silt curtain area (0800 -1300 hrs); 2) Rock breaking work ceased and mini-backhoe demobilized. The derrick barge
towed out of Works
site (1300 - 1900 hrs) Intake Shaft Area:
marine construction activities, namely 1) N/A Marine construction activities with contact
with water: 1) derrick barge supported material
lifting for rock breaking and pumping clean seepage water within silt curtain area (0800
-1300 hrs) Marine vessels on 29 January 2022: -
Nil (Intake Shaft) -
Derrick barge
x 1; tug boat x 1; mini-backhoe x 1 inside
the caisson (Outfall Shaft) Dominating sea current direction was
found to be from Northwest to Southeast at waters to the west side of Tit Cham Chau; and
from West to East at waters to the east side of Tit Cham Chau. |
|||
|
|
Stations WSR3 and WSR4 were located distant
from the construction site and the possibility
of being affected by marine construction activities were considered limited. SS exceedances were however observed at
WSR3 (9.3 mg/L) and WSR4 (19.0 mg/L). With reference to the work schedule provided by the Main Contractor, marine
construction works were conducted at WSR37 (2.9 mg/L). No SS
exceedances were however observed
at WSR36 (5.8 mg/L) and WSR37. In view of the inverse relation between distance to marine works and SS
level, the SS exceedance is concluded not project relevant. According to the field observation by
sampling team during sampling event, no silt
plume was observed in the Contract site
on 29 January 2022. Conditions of the protective silt curtain at the inland water
outfall was satisfactory on 29
January 2022. |
|
Remarks |
Current direction during
mid-ebb sampling on 29 January 2022:
(Sourced from http://current.hydro.gov.hk/en/map.html) |
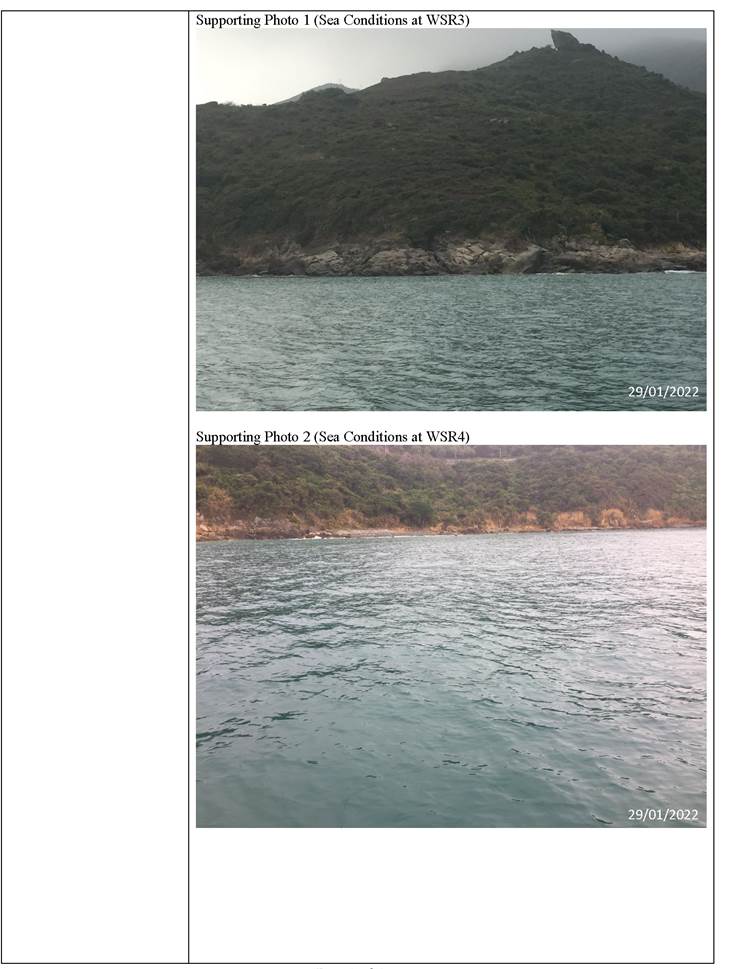
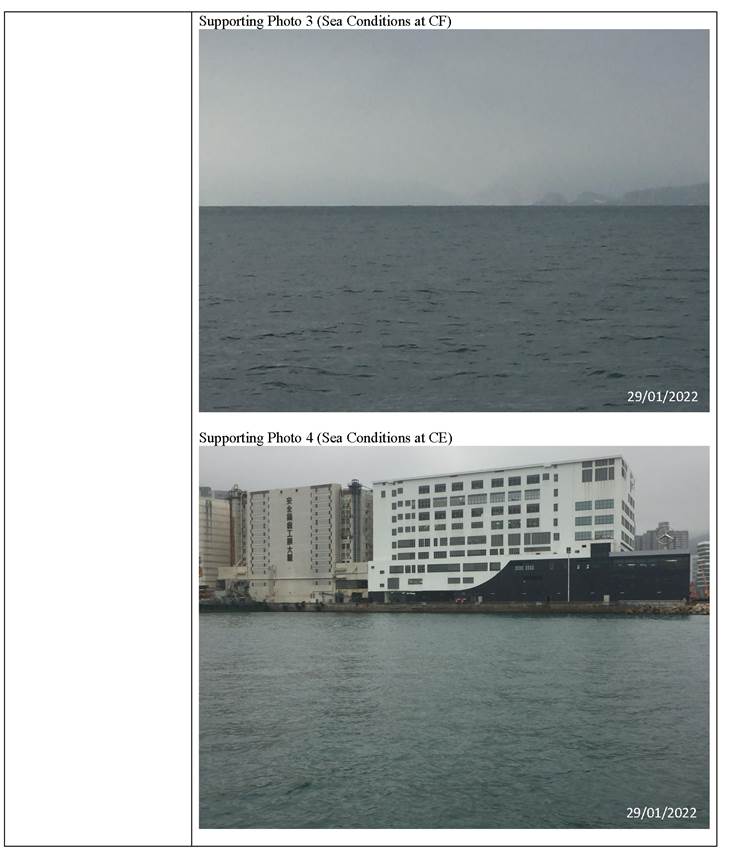
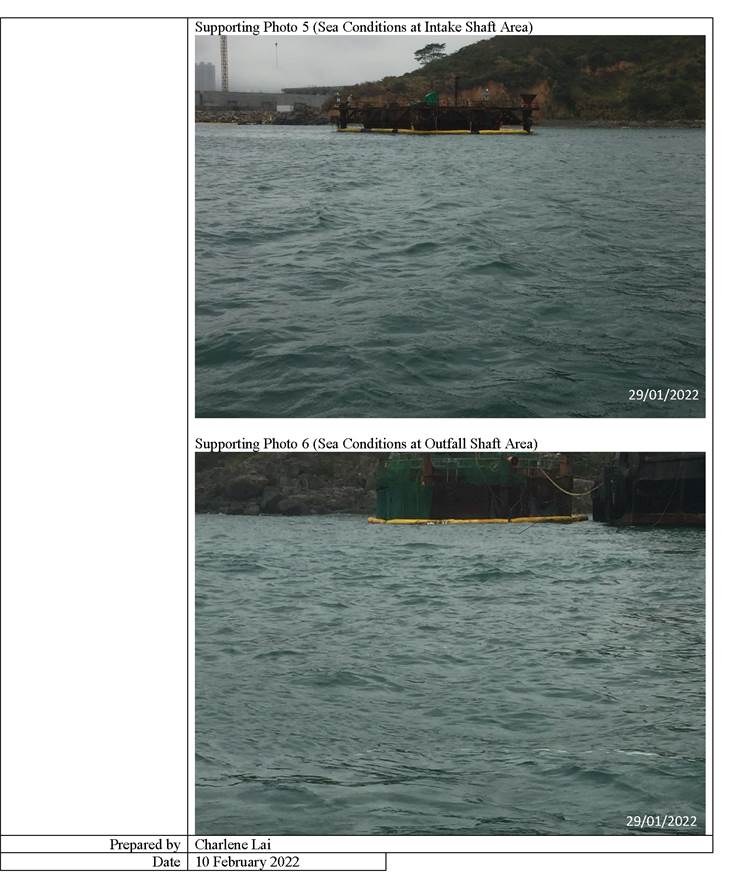
Incident Report
on Action Level
or Limit Level Non-Compliance
|
Project |
Design, Build
and Operate First Stage of Tseung Kwan
O Desalination Plant |
|||
|
Date |
31 January 2022 (Lab result
received on 09 February 2022) |
|||
|
Time |
15:07-18:37 (Mid-Flood) and 10:06-13:36 (Mid-Ebb) |
|||
|
Mid-Flood |
||||
|
Monitoring Location |
WSR1, WSR3, WSR4, WSR16
|
|||
|
Parameter |
Suspended
Solid (SS) |
|||
|
Action & Limit Levels |
Action Level |
Limit Level |
||
|
> 5.0 mg/L |
> 6.0 mg/L |
|||
|
Measurement Level |
Impact
Station(s) of Exceedance |
Control Stations |
Impact
Station(s) without Exceedance |
|
|
5.3 mg/L (WSR1) 11.3 mg/L (WSR
3) 6.2 mg/L
(WSR 4) 6.1 mg/L
(WSR 16) |
4.0 mg/L
(CE) 3.4 mg/L
(CF) |
4.1 mg/L
(WSR 2) 3.1 mg/L
(WSR 33) 3.7
mg/L (WSR 36) 3.8
mg/L (WSR 37) |
||
|
Possible reason for Action or Limit Level
Non-compliance |
Outfall Shaft Area: marine construction
activities, namely 1) N/A Intake
Shaft Area: marine construction activities, namely 1) N/A Marine
construction activities with
contact with water: 1) N/A Marine vessels on 31 January 2022: -
N/A (Intake Shaft) -
N/A (Outfall Shaft) Dominating sea current direction was found to be from
Southeast to Northwest at waters to the west side of Tit Cham Chau; and
from Northeast to Southwest at waters to the
east side of Tit Cham Chau. Stations WSR1, WSR3, WSR4 and WSR16 were
located distant from the construction site and the possibility of being affected by marine construction activities was considered limited. SS exceedances were
however observed at WSR1 (5.3 mg/L), WSR3 (11.3
mg/L), WSR4 (6.2
mg/L) and WSR16
(6.1 mg/L). According to the construction work schedule provided by Main Contractor, no marine
activities were conducted at both Intake
and Outfall shafts
on 31 January 2022. All vessels
were |
|||
|
|
demobilized & towed out of the Works
area and no water pumping at Outfall on the
day. Hence the SS exceedances at WSR1, WSR3, WSR4 and WSR16 maybe
resulted from other natural
factors. According to the field observation by
sampling team during sampling event, no silt
plume was observed at the Contract site on 31 January 2022. Conditions of the protective silt curtain at the inland water
outfall was satisfactory on 31
January 2022. |
|||
|
Mid-Ebb |
||||
|
Monitoring Location |
WSR33
|
|||
|
Parameter |
Suspended
Solid (SS) |
|||
|
Action & Limit Levels |
Action Level |
Limit Level |
||
|
> 5.0 mg/L |
> 6.0 mg/L |
|||
|
Measurement Level |
Impact
Station(s) of Exceedance |
Control Stations |
Impact
Station(s) without Exceedance |
|
|
6.5 mg/L
(WSR33) |
3.3 mg/L
(CE) 3.7 mg/L
(CF) |
4.2 mg/L (WSR1) 5.0 mg/L (WSR2) 4.8 mg/L (WSR3) 4.0 mg/L (WSR4) 4.6 mg/L (WSR16) 4.2 mg/L (WSR36) 4.0 mg/L (WSR37) |
||
|
Possible reason for Action or Limit Level
Non-compliance |
Outfall Shaft Area: marine construction
activities, namely 1) N/A Intake
Shaft Area: marine construction activities, namely 1) N/A Marine
construction activities with
contact with water: 1) N/A Marine vessels on 31 January 2022: -
N/A (Intake Shaft) -
N/A (Outfall Shaft) Dominating sea current direction was
found to be from Northwest to Southeast at waters to the west side of Tit Cham Chau; and
from West to East at waters to the east side of Tit Cham Chau. According to the construction work schedule
provided by Main Contractor, no marine activities
were conducted at both Intake and Outfall shafts on 31 January 2022. All vessels were demobilized & towed out
of the Works area and no water pumping at Outfall
on the day. Hence the SS exceedance at WSR33 maybe resulted from other natural
factors. According to the field observation by
sampling team during sampling event, no silt
plume was observed at the Contract site on 31 January 2022. Conditions of the protective silt
curtain at the inland water
outfall was satisfactory on 31 January 2022. |
|
Remarks |
Current direction during mid-ebb sampling on 31 January 2022:
Current direction during mid-flood sampling on 31 January 2022:
(Sourced from http://current.hydro.gov.hk/en/map.html) |
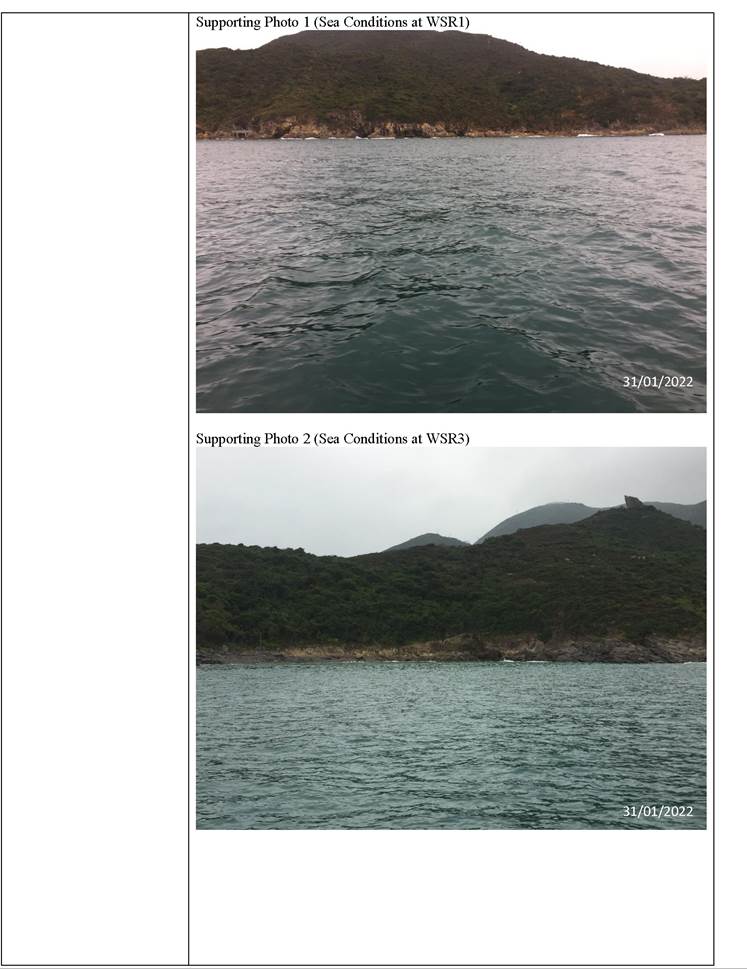
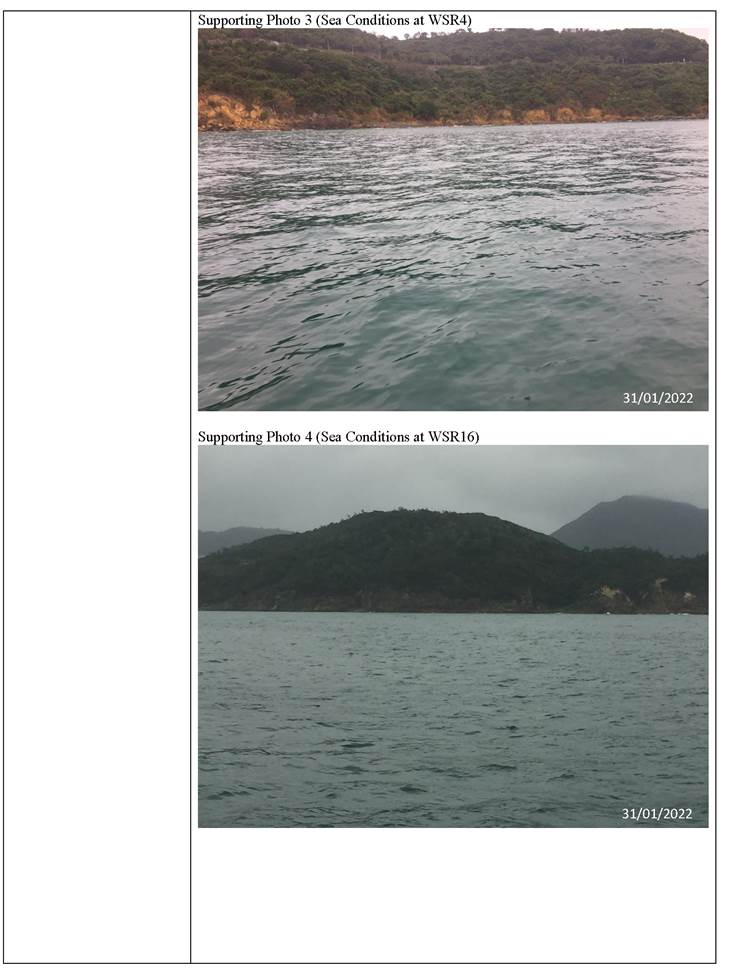
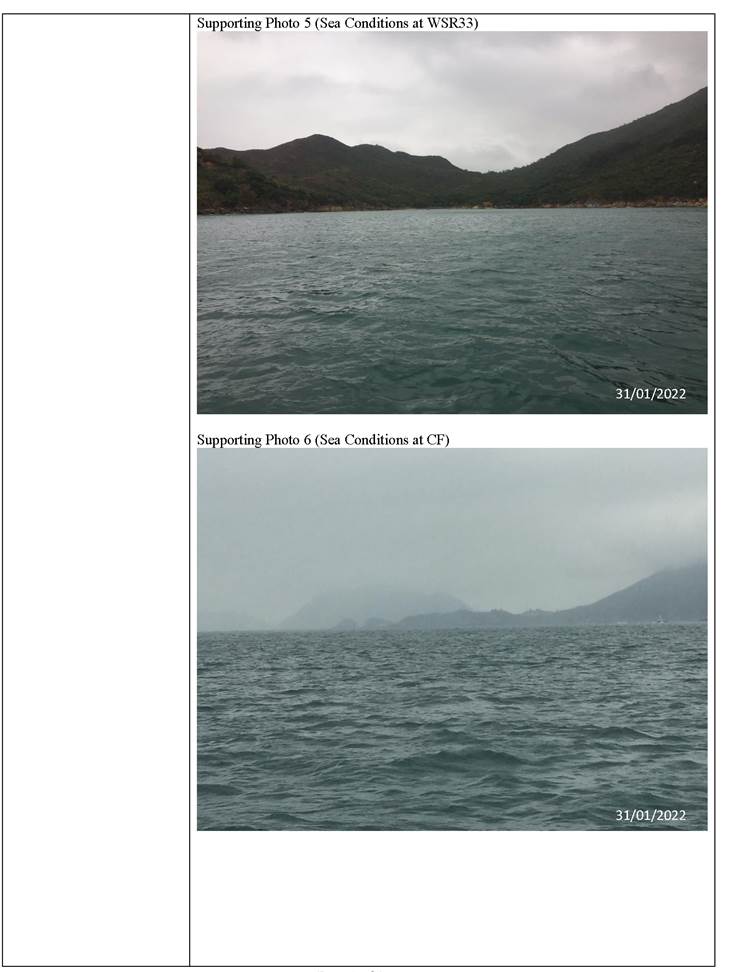
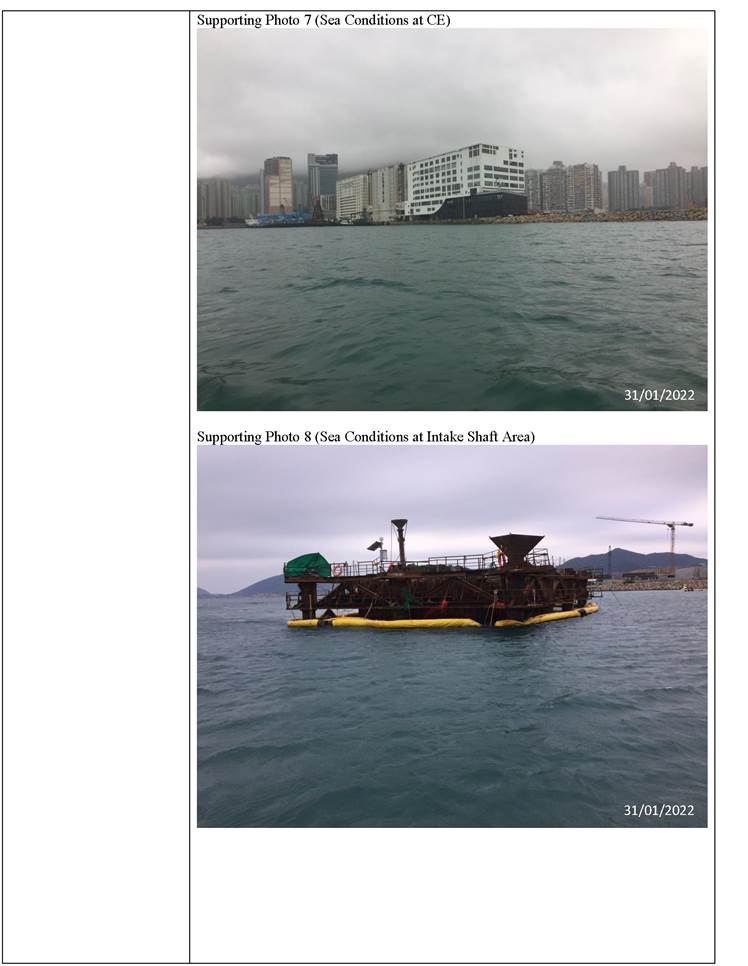
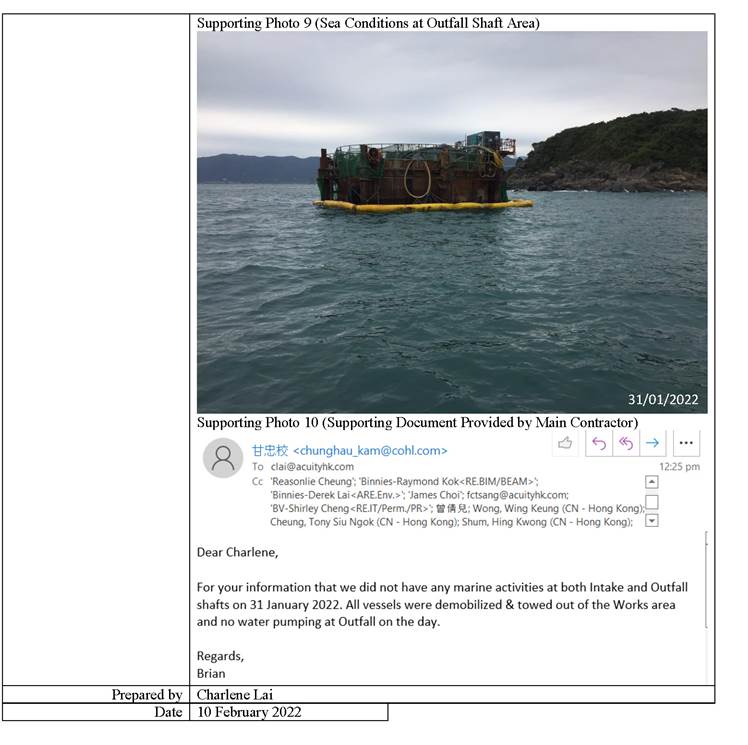
Investigation Report for the Suspect Oil Spill at the Water near Outfall
Shaft
|
Date Received |
15 January
2022 afternoon (Text Message from AJCJV��s Environmental Officer) |
|
Incident Witness |
Environmental Protection Department Inspector |
|
Nature of Event |
* |
|
Source |
* |
|
Details of the
Incident: AJCJV��s
Environmental Officer received a text message from Environmental Protection
Department Inspector on 14 January
2022 afternoon claiming observations of susceptible oil spillage at the water
surface nearby to Outfall Shaft during their routine drone check
on 13 January 2022 (Figure 1). The message from EPD was relayed
to the Environmental Team (ET) by AJCJV on 15 January 2022 morning. As been reported
by the AJCJV, immediate investigation has been made after the acknowledgement
of the incident, whilst
implementing emergency clean up measures on any residue oil spillage. The
clean up action was completed COP
on 14 January 2022. The follow-up site inspection at the concerned area was
carried out by EPD inspector
physically on the next day of the reported incident, accompanied by
Supervising Officers�� Representative
(SOR) and AJCJV (i.e. 15 January 2022). During
the site inspection, brief interview was conducted with
AJCJV��s section agent
on the possible causes of the incident. No solid conclusion was made, and the site
visit was completed before lunch time on 15 January 2022. Abstracted from the investigation carried out by AJCJV,
no physical work
was conducted at the concerned area on 13 January
2022 morning due to dewatering pump failure, which the rock coring works that
was originally scheduled during
time of concerned was postponed to the afternoon at around 1330hrs of the
same day. No lifting of
diesel/chemical drums have been carried out in the meantime, and no reported
observations of oil leakage was
received. AJCJV reported that the concerned area which oil spillage was found
was near to the south side of the
derrick barge, where only the resting compartment of the barge situates.
Disel storage tanks were positioned
at the opposite side underneath the crane tower. Further checking with the
tidal information (Figure 2)
at the nearest Tai Miu Wan Station from Hong Kong Observatory suggested the
flow direction after lunch break was from the east/northeast towards
Outfall Shaft (flood
tide) on 13 January 2022. The routine weekly inspection carried out on 11 January
2022 with ET and Independent Environmental Checker (IEC) did not spot any substantial deficiencies of the concern
marine works in general (Figure 3). This observation was confirmed by the photo
records from the regular water monitoring scheduled on both 11 January 2022 and 13 January 2022 (Figure 4 to
Figure 7),
with no irregularities and visual pollutants reported by the water
sampling team of ET. Follow-up visit was
conducted with SOR, IEC and ET on 17 January 2022 (Figure 8) and no oil spillage
or oil stain was observed on sea
surface near to the Outfall Shaft Area. Further interview was conducted by ET
and IEC with the site staff
and it was confirmed that the statements suggested by AJCJV
was valid. The email message from EPD on 19 January
2022 also acknowledged from the fact that no lifting of diesel
drums and no works at
outfall shaft before 1330hrs when the incident was observed, the findings
suggested the oil spillage was
unlikely originated from the Outfall Shaft. The incident may therefore be
considered as non-project related (Figure 9) However, EPD advised further precautionary measures should
be implemented with close monitoring and supervision.
EPD also reminded AJCJV to strictly comply to the requirements as stipulated
in the condition C6.2 of the WPCO
license WT00035775-2020, that any accidental discharge, emergency bypass or
overflow of untreated effluent or
an operation upset which places the discharge in a temporary state of
non-compliance with the license should
be reported to EPD within 24 hours of the incident. |
|
![]()
MONITORING
|
Ad hoc Monitoring undertaken |
* |
|
-- |
|
FOLLOW-UP SITE VISIT
|
Date |
Status / Observation |
|
17 January 2022 |
Follow-up
visit was conducted with SOR, IEC and ET on 17 January 2022 and no oil spillage or oil stain
was observed on sea surface near to the Outfall Shaft Area. Further interview
was conducted with the site operator and it was confirmed that the statements suggested by AJCJV was valid. |
Conclusion
![]()
Supporting Photos
|
Figure 1: Suspect Oil Spill found on 13 January 2022
(Based photo provided by EPD
inspector) |
|
Figure 2: Tidal Information at the Nearest Tai Miu Wan Station from Hong Kong Observatory on 13 January
2022 |
|
|
|
Figure 3: Observations
during Routine Weekly
Inspection on 11 January 2022
near to Outfall Shaft Area |
|
Figure 4: Photo Records
from Regular Water
Monitoring provided by ET ��s Monitoring Team on 11 January
2022 near to Outfall Shaft
Area (Mid-Ebb) |
|
Figure 5: Photo Records from Regular Water
Monitoring provided by ET ��s Monitoring Team
on 11 January 2022 near
to Outfall Shaft
Area (Mid-Flood) |
|
|
|
Figure 6: Photo Records from Regular Water
Monitoring provided by ET ��s Monitoring Team
on 13 January 2022 near
to Outfall Shaft
Area (Mid-Ebb) |
|
Figure 7: Photo Records from Regular
Water Monitoring provided by ET ��s Monitoring Team on 13 January 2022 near to Outfall Shaft Area (Mid-Flood) |
|
|
|
Figure 8: Observations
during Follow-up Site
Inspection on 17 January
2022 near to Outfall
Shaft Area |
|
|
|
Figure 9: Email message from EPD on
19 January 2022 |
|
|
|
|
|
Figure 10:
Emergency clean up measures on any residue
oil spillage |
STATUS
OF COMPLAINANT: *Follow-up/Closed
Prepared by : Charlene Lai
Designation : Environmental Team Member
:
Signature
![]() Date : 25 January
2022
Date : 25 January
2022